Long Time Stability of Pb-Free Sn-9Zn Elements
for AC-Low Voltage Fuse Performance
Kazuhiro Matsugi
1, Yasuhiro Iwashita
1, Yong-Bum Choi
1, Gen Sasaki
1and Koji Fujii
2 1Area of Mechanical Material Engineering, Graduate School of Engineering, Hiroshima University, Higashi-Hiroshima 739-8527, Japan
2The Chugoku Electric Power Co. Inc., Hiroshima 730-8701, Japan
In order to evaluate the stability in long time for the performance of AC-low voltage fuses, this study aimed to measure the changes of the specific resistivity, specific heat and thermal conductivity due to the microstructure-change, using a diffusion couple consisting of the Sn-9Zn fuse element and Cu-connector which are exposed at 443 K for 7.2 ks. The reaction area with the thickness of 5mmconsisting of Sn, Cu and Zn phases, was formed at its interface. The values in their properties were increased due to microstructure-change caused by the diffusion. The equations for the estimation of their values could be represented as a function of temperature. The good stability in long time for the un-melt down performance at 210 A of electric current, was confirmed by three-dimensional voltage and temperature calculations on fuse elements after diffusion. [doi:10.2320/matertrans.M2010389]
(Received November 17, 2010; Accepted January 31, 2011; Published March 30, 2011)
Keywords: long time stability, lead-free tin-zinc alloys, fuse element, environmentally friendly materials, diffusion, temperature simulation
1. Introduction
Lead and its alloys or compounds are considered environ-mental hazards because of lead’s toxicity therefore many countries are going to ban their use.1,2)Pb-containing solders are being phased out for environmental reasons mentioned above. Despite numerous studies on Pb-free solders in recent years,2) there are only a limited number of reports on the
research and development for high temperature Pb-free alternative solder. High temperature solders have been widely used in various types of applications not only as die-attach solders but also for assembling optical compo-nents, automobile circuit boards, circuit modules for step soldering, etc. Needless to say, the practical Pb-Sn alloys used as solders in industries are classified into two groups (Pb-5 mass%Sn and Pb-60 mass%Sn) by their melting tem-peratures.
The Pb-60Sn alloy has been also used as AC-low voltage fuse elements in electric power line.3,4) Due to the world-wide legislative requirements,5,6) it is important to develop viable alternative Pb-free alloys for AC-fuse elements used in electric power line. The main requirements for alternative fusible alloys are:
1) Low melting point: The melting points should be comparable to practical Pb-Sn system alloys.
2) Availability: There should be adequate supplies or reserves available of candidate metals.
3) Ability of manufacture: The production of raw materials should not be difficult.
The Sn-9Zn alloy has been investigated in our previous study as a Pb-free alloy for low-voltage fuse elements, except for the points of its performance in a break at high value (3000 A) in electric current, weather proof and wettability on copper.3,4,7) In contrast, since an eutectic point (471 K) of Sn-Zn system alloys is similar to that (456 K) of the practically used Pb-60Sn, it has been also considered by other investigators as a candidate alloy system for a lead-free
solder material.8,9) The Sn-Zn eutectic system which is
basically classified as an anomalous eutectic alloy, has a broken-lamellar type eutectic structure.10) The faceting lamellas are Zn and the nonfaceting face is the Sn matrix. Under rapid cooling conditions, the lamellar Zn becomes fibrous,10,11) which means the sensitivity to solidifying conditions. It is considered that electrical and thermal conductivity of Sn-Zn eutectic system alloys are difficult to be estimated using Maxwell12) and Landauer13) models,
because those properties are directly influenced by morphol-ogy of each phase in them. In our previous study, specific resistivity and thermal conductivity could be estimated as a function of temperature and alloy composition in the compositional ranges classified from the standpoint of continuity or non-continuity of constituent phases such as primary Zn, Sn-solid solution and eutectic in microstructures of Sn-1 to 100Zn alloys.14)It is important in the shape-design
of fuse elements that temperature distributions in the fuse element-connector-electric wire system, are exactly known using the estimated values as the function of temperature and alloy composition, in some conditions evaluating the main requirements4,7)(period showing melt or un-melt down and temperature increment at fixed current flow conditions) for AC-low voltage fuse elements. It is important for practical application of Sn-Zn alloys as lead-free fuse elements used in electric power line, that their microstructural stability is achieved even after long time use. There is little report for the deterioration of both electrical and thermal properties caused by the microstructural change in the long time use of Sn-Zn alloys.
The present study aimed to measure the changes in values of the specific resistivity, specific hest, thermal conductivity and density caused by the microstructural change, using diffusion couples consisting of fuse elements of Sn-9Zn and connectors of pure Cu which are exposed at high temperature near the melting point, as accelerated atomic diffusion.
2. Experimental Procedures
2.1 Preparation of Sn-9Zn/Cu diffusion couples and requirement for fuse elements
Pure Sn with the purity of 99.9% and pure Zn with the purity 99.9% were weighed according to the nominal composition of the eutectic Sn-9 mass%Zn alloy. They were melted in a graphite crucible in air. Molten metal was held for 1.2 ks at temperature which was 50 K higher than the eutectic temperature of 471 K. Its melt was cast into the cold split-die made of carbon steel with the inner diameter of 15 mm and height of 115 mm.
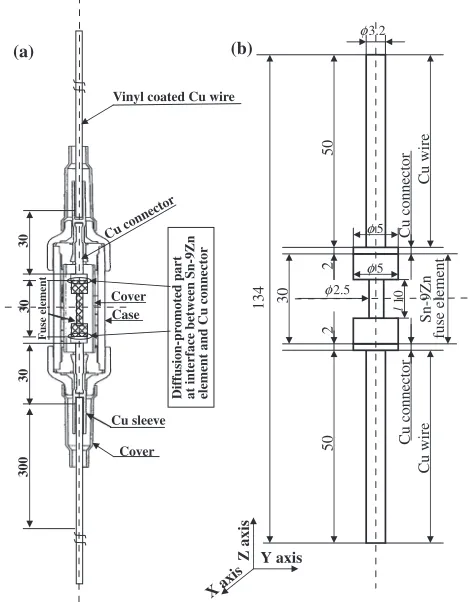
The schematic illustration showing the assembly of some parts in a fuse box is shown in Fig. 1(a). The fuse box consisted of a Sn-9Zn fuse element, copper connector, copper sleeve, cover, case and vinyl coated electric copper wire with a diameter of 3.2 mm.4,7) The dissimilar connection is
achieved between the Sn-9Zn fuse element and Cu connector, which leads to the microstructural change at their interface by atomic diffusion of each element. Therefore, Sn-9Zn/ pure Cu diffusion couples were prepared by vacuum vapor deposition. Used source of Cu had the purity of 99.9%. The Sn-9Zn substrate with the diameter of 13 mm and thickness of 5 mm, was carefully mechanical polished and cleaned with deionized water, for the observation of microstructural change.
For AC-low voltage fuses used in electric power line, one of main requirements is the un-melt down of a fuse element for 3 s at 210 A after current discharge of 72 A.3,4)In practical uses, the electrical current near 210 A may be discharged to fuse elements in their long service life. As accelerated diffusion, Sn-9Zn/pure Cu diffusion couples were heat-treated at 443 K near the eutectic temperature for 7.2 ks in air.
2.2 Measurement of physical properties
The microstructural observation was carried out using an optical microscope. The specific resisitivity (e) was
simul-taneously measured from 293 K to about 420 K by the standard four probe d.c. method in air using a computer-controlled equipment. The size of samples was 11
15mm. The temperature gradient along the length (15 mm) of samples for the measurement of e was about 5 K. The
thermal conductivity () was measured from 293 to 420 K using samples with the diameter of 11 mm, under the steady-state condition in air. Density () measurement using a high density liquid was performed by Archimedes’ method. The specific heat (cp) was measured by differential scanning
calorimetry in the temperature range from 293 to 463 K at rate of 5 K/min in a nitrogen stream. X-ray diffraction (XRD) analysis employing nickel filtered Cu-K radiation was
performed for phase identification. Qualitative analysis was carried out by an electron probe micro analyzer (EPMA) with a wave-length dispersive spectrometer.
2.3 Model for electrical and thermal calculations
The assembly of the Sn-9Zn fuse element, copper connector and electric copper wire, and the size of each object used in this calculation are shown in Fig. 1(b). A three-dimensional Cartesian coordinate system was used in the fuse element-connector-electric wire system. The
governing equations are based on Ohm’s and Fourier’s laws for electrical and thermal analyses, which can be written as following eqs. (1) and (2), respectively,
ece
@E
@t ¼
@2E
@x2 þ
@2E
@y2 þ
@2E
@z2 ¼0 ð1Þ
wherece,E andt represented the capacitance, voltage and
time, respectively,
cp
@T
@t ¼
@2T
@x2 þ
@2T
@y2 þ
@2T
@z2
þQ ð2Þ
whereT andQrepresented the temperature and amount of heat generation per 1 sec, respectively. Qis obtained from thee, electrical conductivity, and current density calculated
from the potential difference along x, y, z directions. Therefore,Qcan be written as following eq. (3),
Q¼e
1 e ffiffiffiffiffiffiffiffiffiffiffiffiffiffiffiffiffiffiffiffiffiffiffiffiffiffiffiffiffiffiffiffiffiffiffiffiffiffiffiffiffiffiffiffiffiffiffiffiffiffiffiffiffiffiffi @E @x 2
þ @E
@y
2
þ @E
@z 2 s 0 @ 1 A 2
ð3Þ
The finite difference method, FDM, was used to solve the above equations for voltage and temperature as a function of time and position.
The governing equation for boundary mesh points such as the fuse element/connector, was represented by eq. (4),
cpvol.
@T
@t ¼ X6
i¼1 Si
TiT
li
þX
3
j¼1
hAjðTcTjÞ þQ ð4Þ Vinyl coated Cu wire
Cu connector Case Cover 30 Cu sleeve 300 30 30 Cover Diffusion-pr omoted part
at interface between Sn-9Zn element and Cu connector
Cu wire Sn-9Zn fuse element Cu connector Cu wire Cu connector 50 50 2 2 30 134 φ3.2
φ 5
φ 5 φ2.5
l
10
Y axis
Z axis
X axis
(a) (b)
Fuse element
[image:2.595.308.543.76.377.2]wherevol.was the volume of the element,liwas the distance
between the mesh point representing the element and its neighboring mesh point in each direction, Ti was the
temperature of the neighboring mesh point in i direction,Aj
was the areas facing the boundary,TcTjwas temperature
difference of between noted mesh points and air through the interface,hwas heat transfer coefficient at the interfaces.
3. Results and Discussion
3.1 Microstructures before and after diffusion
[image:3.595.75.263.74.220.2]The microstructure of as-cast Sn-9Zn alloy is shown in Fig. 2. The microstructure showed a typical Sn-Zn eutectic structure with the light contrast Sn-solid solution and the dark contrast Zn phases which were formed alternately. Sn-9Zn is considered to be a two phase material consisting of pure Zn and Sn-solid solution with Zn of less than 1 mass%, and Sn-solid solution phase was continuous one in this alloy. The cross section of Sn-9Zn/pure Cu diffusion couples is shown in Fig. 3. Vacuum vapor deposition of Cu was uniformly achieved on Sn-9Zn surface and its deposited layer had the thickness of approximately 20mm.
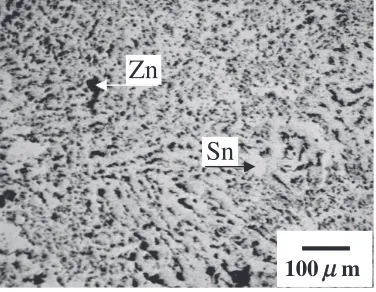
For Sn-9Zn/pure Cu diffusion couple after the heat treatment at 443 K for 7.2 ks, Sn and Zn atoms diffused toward the Cu side while Cu atoms diffused toward the Sn-9Zn substrate, compared with the initial origin of its interface, as shown in Fig. 4. In contrast, in the Sn-9Zn side, the eutectic microstructure (see, Fig. 4(a)) on the area located remote from the interface, was the same as one before the diffusion (see, Fig. 2). The Sn, Zn and Cu-concentration profiles were changed monotonously in the reaction layer with approximately 5mm. Kirkendall voids were also observed in the Sn-9Zn substrate, which agreed with the result open literature.15)Three phases of Sn, Cu and Zn were identified by XRD in reaction area caused by diffusion, as shown in Fig. 5. On the other hand, in the solder joints between eutectic Sn-3.5Ag and Cu, both Cu6Sn5 and Cu3Sn
Sn
Zn
100
µ
m
Fig. 2 The optical micrograph showing the microstructure of the Sn-9Zn alloy used for a fuse element.
20
µ
m
Cu
Sn-9Zn
Fig. 3 An optical micrograph of cross-section of an diffusion couple consisting of Sn-9Zn and pure Cu, before the heat treatment at 443 K for 7.2 ks.
Interface before diffusion
20
µ
m
Cu
Sn-9mass%Zn
(a)
(b)
[image:3.595.308.530.77.542.2] [image:3.595.49.291.274.465.2]intermetallic compounds are formed after aging at 443 K (same temperature to this study) for 63 ks, which lead to the diffusion controlled mechanism.16)There is not the formation
of any intermetallic compounds at the heat condition in this study. In contrast, in the Sn-9Zn side after diffusion, the XRD profiles obtained from the area located remote from the interface, were the same as ones before diffusion (see, Fig. 5(b)), which agreed with the same microstructure before and after the diffusion as shown in Figs. 2 and 4(a).
3.2 The change of physical properties on specimens after diffusion
The specific resistivity was measured using diffusion couples before and after heat treatments, at various temper-atures of the range of 293–420 K. Figure 6 shows the temperature dependence ofe, on samples before and after
the diffusion at 443 K for 7.2 ks. As can be seen in the figure,
e increased monotonously with increasing temperature,
regardless of the heat treatment condition, and eincreased
by the formation of diffusion area shown in Fig. 4.
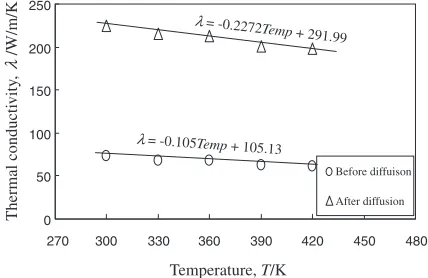
The thermal conductivity was measured using diffusion couples before and after heat treatments, at various temper-atures of the range of 293–420 K. Figure 7 shows the temperature dependence of , on samples before and after the heat treatment at 443 K for 7.2 ks. As can be seen in the figure, decreased monotonously with increasing
temper-ature, regardless of the heat treatment condition, and
increased by the formation of diffusion area shown in Fig. 4. The specific heat was measured using diffusion couples before and after heat treatments, at various temperatures of the range of 293–463 K. Figure 8 shows the temperature dependence of cp, on samples before and after the heat
treatment at 443 K for 7.2 ks. As can be seen in the figure,
cp increased monotonously with increasing temperature,
regardless of the heat treatment condition, andcp increased
by the formation of diffusion area shown in Fig. 4.
The density was measured using diffusion couples before and after heat treatments, at 290–355 K according to Archimedes’ principle. Figure 9 shows the temperature dependence of , on samples before and after the heat treatment at 443 K for 7.2 ks. As can be seen in figure,
decreased monotonously with increasing temperature, regardless of the heat treatment conditions. There was little change of, even by the formation of diffusion area shown in Fig. 4.
It is found below the melting point of the Sn-9Zn alloy, that the values ofe,,cpandcan be generally represented
using the equations as the function of the temperature, as listed in Figs. 6–9. Here, the values of e and change
depending on not only volume fraction of Zn and Sn-solid solution phases but also morphologies of both phases in
Sn-Fig. 5 X-ray diffraction profiles obtained from (a) pure Cu, (b) Sn-9Zn and (c) the reaction area of the diffusion couple consisting of Sn-9Zn and pure Cu after the heat treatment at 443 K for 7.2 ks.
0 5 10 15 20 25 30
270 310 350 390 430 470
Before diffusion
After diffusion
Temperature, T/K
Specif
ic resisti
vity
,
ρe/µ
Ω
cm
ρe= 0.0433
Temp – 0.564
ρe= 0.0755
Temp–7.461
Fig. 6 Specific resistivity measured in this study for an diffusion couple consisting of Sn-9Zn and pure Cu, before and after the heat treatment at 443 K for 7.2 ks.
0 50 100 150 200 250
270 300 330 360 390 420 450 480
Before diffuison
After diffusion
Temperature, T/K
Thermal conducti
vity
,
λ
/W/m/K
λ= -0.2272Temp + 291.99
λ= -0.105Temp + 105.13
Fig. 7 Thermal conductivity measured in this study for an diffusion couple consisting of Sn-9Zn and pure Cu, before and after the heat treatment at 443 K for 7.2 ks.
0.10 0.15 0.20 0.25 0.30 0.35 0.40 0.45
270 310 350 390 430
Before diffusion
After diffusion
Temperature, T/K
Specif
ic heat,
C
p
/kJ/kg/K
Cp= 3.70x10
-4Temp + 0.154
Cp= 3.04x10
-4Temp + 0.232
[image:4.595.62.280.73.206.2] [image:4.595.319.533.74.213.2] [image:4.595.318.533.272.424.2] [image:4.595.64.278.275.414.2]Zn system alloys.14) Therefore, it is considered that their
same values are shown on both Sn-9Zn parts in diffusion couples before and after the heat treatments, because of same microstructure as shown in Figs. 2, 4, 5.
The e, , cp and measured at room temperature are
also listed in Table 1, for the Sn-9Zn/Cu before and after diffusion, and pure copper4)for electric power line.
Temper-ature conductivity () determined by eq. (5), was obtained using values of the,cpandin this study, for evaluation of
heat-conduction as one requirement for fuse elements.
¼=ðcpÞ ð5Þ
The value of the temperature conductivity for the sample after diffusion is 2.5 times larger than that of one before diffusion, which approaches to that of pure copper, and leads to the satisfaction for the requirement of un-melt down for 3 s under the higher fixed value (210 A) of electric current, due to the larger amount of the heat transfer by heat conduction. In contrast, the value in e of the sample after
diffusion is 1.2 times, compared with that of the sample before diffusion, which leads to the reject for the require-ment of un-melt down due to larger amount of Joule’s heat generation. It is found on the basis of on the results of Figs. 6–9, that this result of both generation and heat-conduction at room temperature, is same to one obtained from the condition of higher temperatures. The temperature-increment per unit time at the center of the fuse element, is decided by the balance between the heat generation and heat conduction amount throughout the fuse
element-connector-electric wire system, under 3D heterogeneously heat release in air. Therefore, it can be confirmed by electrical and thermal calculations as mentioned below section 3.3, that the critical time of 3 s for the un-melt down performance at 210 A is satisfied or not on samples after diffusion.
3.3 Temperature simulation under the constant current discharge of 72 and 210 A
The voltage and temperature were calculated using eqs. (1) and (2), respectively. The electric current of 72 A was firstly discharged from the edge surface of the copper electric wire to another one, as shown in Fig. 1(b). The current density on the edge surface of the electric wire was 8.95 A/mm2 initially at room temperature. For instance, the
measured value in the total electrical resistance was 706m
throughout the fuse element-connector-electric wire system having the diameter of 2.5 mm and length of 10 mm in the smaller diameter part of fuse element, as shown in Fig. 1(b). The electrical and thermal calculations were carried out, considering both diffusion areas with thickness of 5mmat the interfaces between Sn-9Zn fuse elements and Cu connectors, see Figs. 1, 4(b). The equations for the estimation ofe,,cp
andas the function of the temperature listed in Figs. 6–9, were used in the calculations. The time step was 0.0001 s in temperature calculations.
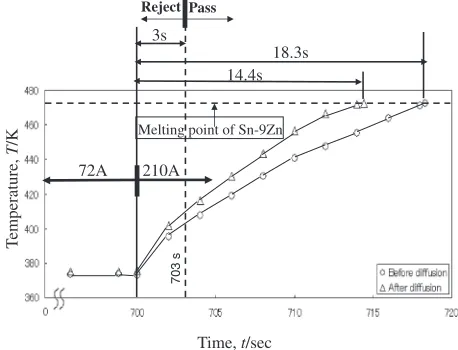
The change in calculated temperature at the center of fuse element with respect to current discharge time at a constant current discharge of 72 and 210 A is shown in Fig. 10. For AC-low voltage fuses used in electric power line, fuse element with the diameter of 2.5 mm and length of 10 mm in the smaller diameter part was designed for the fuse element-connector-electric wire system, as shown in Fig. 1(b).4)The
saturated values in the temperature were shown after the current discharge for 700 s at 72 A in this calculation, although the constant current was discharged via fuse elements for 1 ks in the practical experiments.4)The constant current of 210 A was discharged via the fuse element-connector-electric wire system after the current discharge of 72 A for 700 s, in the potential and thermal calculations. The
7.05 7.10 7.15 7.20 7.25 7.30 7.35
270 290 310 330 350 370
Before diffusion
After diffusion
Temperature, T/K
Density
, ρ
/g/cm
3
ρ before= -4.42x10⁻⁴Temp + 7.435 ρafter= -3.57x10⁻⁴
Temp + 7.403
Fig. 9 Density measured in this study for an diffusion couple consisting of Sn-9Zn and pure Cu before and after the heat treatment at 443 K for 7.2 ks.
210A
18.3s 14.4s
703 s
72A 3s
Melting point of Sn-9Zn
Time, t/sec
T
emperature,
T
/K
[image:5.595.63.278.73.211.2]Reject Pass
Fig. 10 The relation between the time and temperature at the center of fuse elements, before and after the heat treatment, obtained from the calculations under the constant current flow of 72 A for 700 s, and 210 A to melting point of 471 K.
Table 1 The specific resistivity, thermal conductivity, specific heat, density and temperature conductivity at 293 K for Sn-9Zn/Cu before and after diffusion, and pure copper.
Specimens
Specific Resistivity,
mcm
Thermal conductivity,
W/m/K
Specific heat, kJ/kg/K
Density, kg/m3
Temperature conductivity,
m2/s
Sn-9Zn/Cu before diffusion
12.1 73.8 0.262 7:31103 3:85105
Sn-9Zn/Cu after diffusion
14.6 225.4 0.321 7:30103 9:60105
[image:5.595.311.540.75.250.2] [image:5.595.46.291.299.416.2]temperature at the center of fuse elements before and after diffusion, reached to the melting temperature after the current discharge time for 18.3 and 14.4 s, respectively, at 210 A, after the current discharge of 72 A for 700 s. The time more than 3 s for the un-melt down requirement at 210 A can be satisfied even on samples after diffusion. However, it is considered in section 3.2 that the achievement of the un-melt down performance becomes to be difficult, on samples after the diffusion because of the heat generation due to larger value ine, as listed in Table 1. It is found on the temperature
simulation that this requirement was satisfied even on the Sn-9Zn element which was microstructural-changed, after diffusion.
The stability for performance of fuse elements in long time is kept even on specimens having the microstructural change at interface Sn-9Zn/Cu which was caused by diffusion under the condition of accelerated heat treatment at 443 K near the eutectic temperature for 7.2 ks. In contrast, long time stability can be evaluated using proposed equations for the estimation ofe,,Cpandrepresented as a function of temperature,
by computer simulation consisting of three dimensionally electrical and thermal calculations on the basis of Ohm’s and Fourier’s laws.
4. Conclusions
(1) For Sn-9Zn/pure Cu diffusion couples after the heat treatment at 443 K for 7.2 ks, the reaction area with the thickness of 5mmwas formed at its interface. The reaction area consisted of three phases of Sn, Cu and Zn.
(2) Specific resistivity, thermal conductivity and specific heat were also increased due to the microstructural change caused by the diffusion. The equations for the estimation of specific resistivity, thermal conductivity, specific heat and density could be represented as a function of temperature. The increase in temperature conductivity and specific resistivity on fuse elements after the diffusion, led to the satisfaction and reject of the un-melt down requirement due to large amount of heat-conduction and -generation, respectively, under the higher fixed value (210 A) of electric current as one of main requirements for fuse elements.
(3) On the basis of electrical and thermal calculations, the temperature at the center of fuse elements before and after
diffusion, reached to the melting temperature after the current discharge time of 18.3 and 14.4 s, respectively, at 210 A, after the current discharge of 72 A for 700 s. This result meant the satisfaction for one requirement for AC-low voltage fuses used in electric power line, even for fuse elements after the diffusion.
(4) The stability in long time for the un-melt down performance was kept on fuse elements having the micro-structural change at interface Sn-9Zn/Cu which was caused by the diffusion under the condition of the accelerated heat treatment at 443 K for 7.2 ks.
Acknowledgements
This research was supported in part by Grant-in-Aid from the Chugoku Electric Power Co. Inc.
REFERENCES
1) S. Jin, D. R. Frear and J. W. Morris, Jr.: J. Electron Mater.23(1994) 709–713.
2) K. Suganuma: Solid State Mater. Sci.5(2001) 55–64.
3) T. Narahashi: Thesis for Master’s Degree, Hiroshima University, Higashi-Hiroshima, Japan, (2006) pp. 2–5.
4) O. Yanagisawa, K. Matsugi, Y. Kikuchi, M. Sako, T. Narahashi, K. Fujii, Y. Kumagai and K. Fujita: Sn alloys for electric fuse elements and electric fuses using their elements, Japan Patent, (2009) No. 4244035.
5) Electronic Material Handbook: vol. 1, (ASM International, Materials
Park, Ohio, 1989) pp. 965–966.
6) P. Biocca: Surf. Mount Technol.13(1999) 64–67.
7) K. Matsugi, G. Sasaki, O. Yanagisawa, Y. Kumagai and K. Fujii: Mater. Trans.47(2006) 2413–2420.
8) W. Yang and R. W. Messler, Jr.: J. Electron Mater.23(1994) 765–772. 9) H. Mavoori, J. Chin, S. Vaynman, B. Moran, L. Keer and ME. Fine:
J. Electron Mater.26(1997) 783–790.
10) F. Vnuk, M. Sahoo, D. Baragar and R. W. Smith: J. Mater. Sci.15 (1980) 2573–2583.
11) R. Elliott and A. Moore: Scr. Metall.3(1969) 249–251.
12) J. C. Maxwell: A Treatise on Electricity and Magnetism, vol. 1, (Oxford Univ. Press, Oxford, 1873) p. 365.
13) R. Landauer: J. Appl. Phys.23(1952) 779–784.
14) K. Matsugi, G. Sasaki, O. Yanagisawa, Y. Kumagai and K. Fujii: Mater. Trans.48(2007) 1105–1112.
15) Y. W. Wang, Y. W. Lin and C. R. Cao: Microscop. Reli.49(2009) 248–252.