Thermal Stability of a Rhenium-Based Diffusion Barrier
Coating Layer on a Ni-Based Superalloy
Yongming Wang
1;*, Somei Ohnuki
1, Shigenari Hayashi
1,
Takayuki Yoshioka
2, Motoi Hara
3and Toshio Narita
21Materials Science Division, Graduate School of Engineering, Hokkaido University, Sapporo, 060-8628, Japan 2Laboratory of Specially Promoted Research, Hokkaido University, Sapporo, 060-8628, Japan
3Division of Intelligent Materials, Department of Materials Science and Engineering, Akita University, Akita, 010-8502, Japan
The thermal stability of coatings containing a Re-based diffusion barrier layer was investigated by surface and cross-sectional analysis methods. A Re-based barrier layer accompanied by an outer Ni-Cr-Al layer was prepared by electrolytic plating onto a Ni-based superalloy, followed by Cr-pack cementation in vacuum at 1523 K. Vacuum annealing was carried out at 1423 K for 25 h. Another type of coating specimen, with an additional Al reservoir layer on the Re-based barrier layer, was oxidized in air for 25 one-hour cycles at 1423 K. EDXRF, XRD, SEM, EDS and EPMA were used for analysis to evaluate the effects of the heat treatments. It was found that the barrier layer decomposed at high temperature when it was coated with a low-Al Ni-Cr-Al phase, but had good stability when it was adjacent to a high-Al Ni-Cr-Al phase. [doi:10.2320/matertrans.48.127]
(Received October 24, 2006; Accepted December 8, 2006; Published January 25, 2007)
Keywords: rhenium-based diffusion barrier, nickel-based superalloy, thermal stability
1. Introduction
Thermal barrier coatings (TBC) are a key technology for advanced gas turbine materials to provide thermal insulation from the hot gas stream, because of their outstanding thermo-mechanical properties. The TBC structure is composed of four main layers; a superalloy substrate, an aluminum-rich bond coat, a thermally grown oxide (TGO) and a ceramic top coat. The top coat is the thermal insulator, the TGO is for oxidation resistance, the bond coat is for bonding to the substrate, and the superalloy is for structural loads. Through-out the lifetime, each layer can interact at high temperature in
active gas environments.1) However, by increasing the
turbine inlet temperature, 1973 K for the next generation gas turbine engines, microstructural degradation of the substrate and layers can be enhanced by interdiffusion
between them.1,2) Recently, a novel diffusion barrier bond
coat, having a duplex structure of Al reservoir and Re-based alloy layers, has been developed for improving high temper-ature properties. It has been shown that the Re-based alloy layer can suppress mutual diffusion effectively and improve
the life span of a TBC.3,4)
However, fundamental understanding about the thermal stability of the barrier layer has not been sufficiently reported. The aim of the present study was to obtain fundamental knowledge about the stability of the barrier layer after heat treatments.
In this paper, three kinds of specimen with the barrier layer were investigated using surface analysis methods and cross-sectional analysis methods. Furthermore, the thermal stabil-ity for the barrier layer is discussed on the basis of the experimental results.
2. Experimental
The nickel-based single crystal superalloy TMS-82+5)
was used as the substrate, where the nominal composition is Ni-7.8Co-4.9Cr-1.9Mo-8.7W-5.3Al-0.5Ti-6.0Ta-0.1Hf-2.4Re (mass%). The superalloy was cut into discs of 1.2 mm in thickness and 15 mm in diameter from a cylindrical ingot,
and the normal direction to the disc surface is the h100i
direction of the single-crystal alloy. The disc surface was ground with abrasive paper #150 and then cleaned ultrasoni-cally in a methanol and benzene solution.
Three kinds of specimen were prepared in this study. The first was an as-formed specimen, which was formed with two
steps: electrolytic plating and Cr-pack cementation.3)A
Ni-70 at% Re layer of 3mmin thickness was first electroplated
on the disc substrate at 323 K. Then, a 2mm-thick Ni-20 at%
W layer at 343 K and a 3mm-thick Ni layer at 323 K were
sequentially electroplated. The Cr-pack cementation was carried out using a powder mixture of Ni-30 at% Cr alloy and
Al2O3 powders at 1523 K for 10 h, followed by cooling in
vacuum. This process produced a two-layered structure on the substrate, an outer Ni-Cr-Al layer and a Re-rich layer
which is known to act as the diffusion barrier.3,4)The second
was a vaccum-annealed specimen, which was prepared from an as-formed specimen by heat-treating at 1423 K for 25 h in vacuum. The third was an oxidized specimen that was coated with an Al reservoir layer, and then oxidized in air under thermal cycling. The experimental details of this specimen
are summarized as follows: A 30mm-thick Ni layer was
electroplated on an as-formed barrier layer specimen from an
aqueous solution. Next, the electrodeposition of Zr at1:7V
for 18 s and of Al at1:4V for 5.6 ks was sequentially from
molten salt baths. A 25-cycle oxidation test was performed in air under thermal cycling conditions between room temper-ature and 1423 K, and maintained for 1 h at 1423 K. The three kinds of specimen are referred to as as-formed, annealed and oxidized respectively.
*Graduate Student, Hokkaido University
Surface analysis was carried out using energy-dispersive X-ray fluorescence spectrometer (EDXRF), a field emission scanning electron microscope (FE-SEM) equipped with energy dispersive ray spectroscopy (EDS), and also
X-ray diffraction (XRD) using a =2 detector with Cu-K
beam. In order to obtain a clean cross-sectional surface with minimal mechanical damage, a new method of cross-section polishing (CP) utilizing an Ar ion beam was employed. After sectioning, the specimens were comprehensively character-ized using combinations of FE-SEM, EDS and electron probe micro analyzer (EPMA).
3. Results
3.1 Surface structure and composition
[image:2.595.319.531.68.550.2]Table 1 shows the EDXRF results obtained from the sur-face of the three kinds of specimen. The annealed specimen showed a significant decrease in Cr content compared to the as-formed specimen. The reason was that Cr evaporation occurred during the annealing process due to its high vapor pressure. For the oxidized specimen, it appears that Zr segregated to the surface, because a relatively high content of Zr was detected. Oxygen wasn’t considered in this measure-ment, because the EDXRF method is unable to detect it.
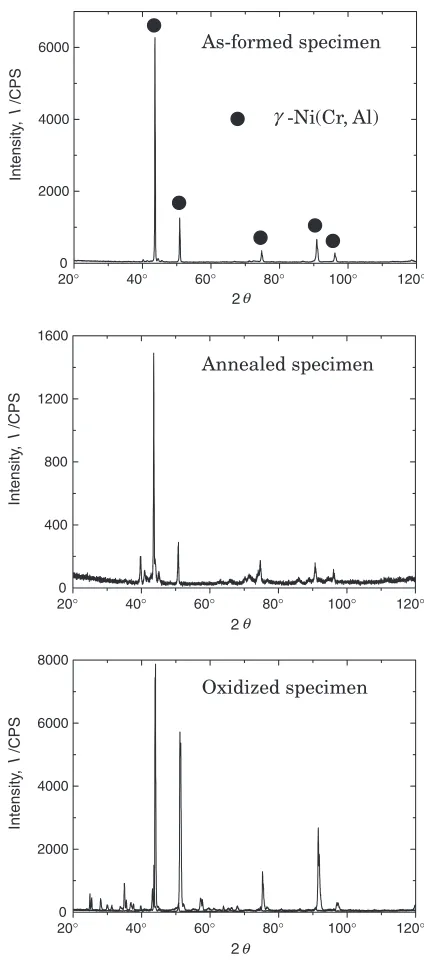
Figure 1 shows a series of XRD patterns corresponding to the three kinds of specimen. The pattern of the as-formed
specimen indicates that the outer layer was composed of a
-Ni(Cr, Al) phase. The annealed and oxidized specimens also exhibited the same main peaks as that of the as-formed specimen. However, the enlarged profile from the oxidized specimen, as shown in Fig. 2, suggested the formation of an
-Al2O3 scale, which appeared to have no preferred
orientation, since its relative XRD intensities coincide with
those of powder samples.6)
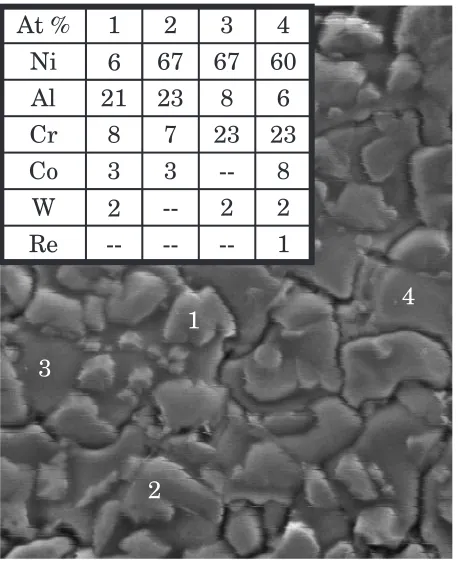
Figure 3 is a secondary electron image (SEI) which shows the surface morphology of the as-formed specimen. The surface morphology consists of protruding grains with irregular size and flat matrix, as shown at the points 1–2 and 3–4, respectively. Local EDS measurement was carried out for the points 1–4, and the results shown in the inset table indicate the grains were enriched in Al, while the matrix was higher in Cr. Images of EDS-mapping for Al, Cr and Ni, as shown in Fig. 4, also indicate the coexistence of Al-rich and Cr-rich phases. It is suggested that the outer layer was comprised of a two-phase mixture. However,
crystallo-Table 1 The results of EDXRF obtained from the surfaces of the as-formed, annealed and oxidized specimens.
at% As-formed Annealed Oxidized
Ni 59.42 58.29 28.37
Cr 17.43 2.06 1.11
Al 7.83 15.13 69.97
Re 4.31 10.94 —
W 2.85 5.63 —
Co 5.86 3.14 0.21
Ti 0.50 1.35 —
Ta 0.91 1.89 —
Mo 0.89 1.53 —
Zr — — 0.34
200° 40° 60° 80° 100° 120°
2000 4000 6000
Intensity
,
I
/CPS
2
-Ni(Cr, Al) As-formed specimen
20°0 40° 60° 80° 100° 120°
400 800 1200 1600
Intensity
,
I
/CPS
2
Annealed specimen
200° 40° 60° 80° 100° 120°
2000 4000 6000 8000
Intensity
,
I
/CPS
2
Oxidized specimen θ
θ θ
γ
Fig. 1 XRD patterns obtained from the surfaces of (a) as-formed specimen, (b) annealed specimen and (c) oxidized specimen.
20 30 40 50 60 70
0 200 400 600 800 1000
Intensity
,
I
/CPS
2
-Al2O3
θ
α
° °
° °
° °
[image:2.595.45.291.94.230.2] [image:2.595.322.530.610.764.2]graphic difference between the two phases was not found in the XRD pattern.
Figure 5 shows the surface morphology of the annealed specimen. As shown in Table 1, the annealed specimen contained approximately 2 at% Cr on its surface. Many submicron scale grains formed on the surface, while the
protruding grain morphology of the as-formed was not observed. As shown in the inset table, the small grains with bright-contrast, indicated by points 1–4, were enriched with
O and Al. However, no corresponding peaks for -Al2O3
were found in the XRD profile. The surface matrix was
compositionally similar to0-Ni
[image:3.595.56.285.172.453.2]3Al phase.
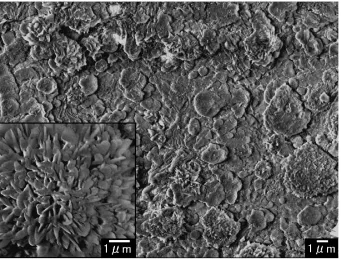
Figure 6 shows a surface image of the oxidized specimen.
The surface was a protective oxide layer, since-Al2O3was
confirmed by XRD. In some areas, the morphology of the oxide scale was interesting, for example the flower-like morphology shown in the inset picture.
[image:3.595.308.547.268.451.2]3.2 Cross-sectional structure
Figure 7 shows cross-sectional SEM images of the as-formed, annealed and oxidized samples. In the as-formed
1
2
3
4
8
--
3
3
Co
2
2
--2
W
23
23
7
8
Cr
1
--
----
Re
6
8
23
21
Al
60
67
67
6
Ni
4
3
2
1
At %
Fig. 3 SEI of the surface of as-formed specimen and EDS results from related points.
Al
Cr Ni
5 mµ
Fig. 4 Surface SEI and EDS-mapping images from the as-formed speci-men.
5 67 28 --6
3 76 19 --5
2 23 39 36 4
3 30 39 28 3
2 24 40 34 2
4 38 33 25 1
Si N Al O At%
1 2
3
4
5 6
(a) (b)
[image:3.595.127.468.500.756.2]state, the barrier layer and outer layer were approximately
4mm and 6mmin thickness, respectively. The thickness of
the barrier layers of both annealed and oxidized specimens clearly changed. The barrier layers were partly decomposed after the vacuum annealing, and the decomposition after oxidation was more pronounced. The decomposition ap-peared to occur at the outer surface of the barrier layer for both the annealed and oxidized specimens. The decomposi-tion was likely due to the dissoludecomposi-tion of Re into other phases. In the annealed specimen, the outer layer also significantly decreased in thickness due to Cr evaporation, and Re-rich precipitates were found in the outer layer, while a second phase was found in the barrier layer. After the heat treat-ments, voids in the barrier layer coalesced, decreasing in number but increasing in size. In the oxidized specimen,
precipitation of a Re-rich phase was not observed to occur in the Al reservoir.
Figure 8 shows a cross-section of the as-formed specimen, on which the EPMA concentration profiles of major elements (Re, Ni, Cr and Al) are superimposed. The barrier layer contained about 35 at% Re, 18 at% Ni and 27 at% Cr, and the
adjacent regions were composed of a -phase. The
concen-tration profiles revealed that Re dissolved from the barrier layer into its neighboring regions during the formation process.
After high-temperature annealing in vacuum, slope con-centration profiles were exhibited both in the barrier layer and outer layer, as shown in Fig. 9. The EPMA result clearly revealed that the outer layer became low in Cr due to Cr evaporation leaving the layer Al rich. The inner region adjacent to the barrier layer was composed of the same phase
of the outer layer. This region was 3–4mmin thickness. The
Fig. 6 Surface SEI of the oxidized specimen and a partially magnified image.
(a) (b) (c)
Surface
Surface
Substrate
Fig. 7 Cross-sectional SEIs of the (a) as-formed specimen, (b) annealed specimen and (c) oxidized specimen.
0 20 40 60 80
0 10 20 30
Distance, d/ mµ
Content,
c
/(at%)
Al Ni Cr Re
Surface
[image:4.595.129.470.72.331.2] [image:4.595.48.289.377.558.2] [image:4.595.314.540.379.536.2]phase with high-Al and low-Cr was in dark contrast in the back-scatter electron image (BEI), superimposed by the EPMA plotting. Re was nearly free in the high-Al phase, but Re-rich phase was precipitated in the high-Al outer layer.
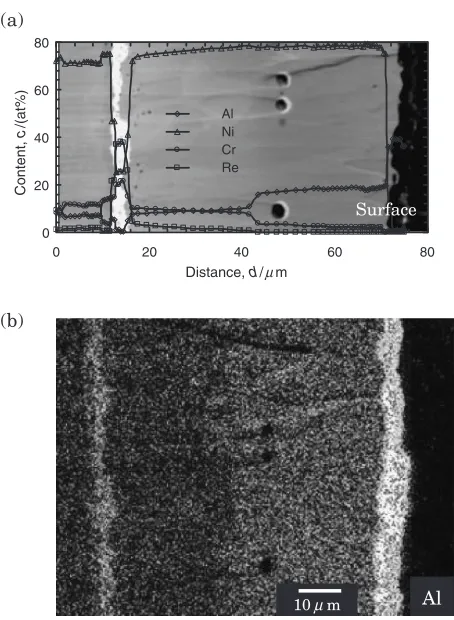
Figure 10(a) shows a backscattered SEM image, with superimposed EPMA profile for the oxidized specimen, and Fig. 10(b) shows an Al EDS-mapping image obtained from the same area. The Al reservoir was divided into two regions; an inner region with high Ni and an outer region with high Al, corresponding to the initial Ni electroplating layer and Al electrodeposition layer respectively. The Kirkendall voids
formed in midsection of the Al reservoir indicate the initial interface between the two plating layers. Re dissolved from the barrier layer into its low-Al neighboring region, and Re content decreased gradually with increasing Al content and there was almost no Re in the high-Al region. An interesting feature of Al distribution was the formation of a high-Al layer adjacent to the inner side of the barrier layer. This high-Al
region, with a thickness of about 2mm, was confirmed by
both EPMA and BEI. Re was also very low in this high-Al region, and the interface between this region and the barrier layer appeared to keep its integrity from the as-formed state, as the barrier layer did not appear to change at its inner interface. The EDS-mapping image of Al also clearly shows these layers in the oxidized specimen.
4. Discussion
Re in the barrier layer plays a critical role in the phase stability and the diffusion barrier effect, and dissolution of Re into the neighboring phases from the barrier layer can result in the decomposition of the barrier layer. The thermal stability of the barrier layer is determined by the solid solubility of Re in the neighboring phases at high temper-atures.
In the case of a barrier layer coating on a Ni-based superalloy, the barrier layer, with or without an Al reservoir, will always be sandwiched by Ni(-Cr)-Al phases, both before and after heat-treatments. The average compositions of the phases adjacent to the barrier layer for each specimen in the present study were plotted on the Ni-Cr-Al ternary diagram
(1423 K),7) considering only Ni, Cr and Al, as shown in
Fig. 11. The figure clearly shows that Re cannot be dissolved into a Ni-Cr-Al phase with high-Al content (greater than
14at% Al in the figure). This result is in agreement with the
ternary Re-Ni-Al phase diagram8) in which the high-Al
phases, such as 0 and phase, also show very low Re
solubility limits.
0 20 40 60 80
0 5 10 15 20
Distance, d/ mµ
Content,
c
/(at%)
Al Ni Cr Re
Surface
Fig. 9 BEI and EPMA result from the annealed specimen; cross-sectional concentration profiles of Al, Ni, Cr and Re.
0 20 40 60 80
0 20 40 60 80
Distance, d/ mµ
Content,
c
/(at%) Al Ni
Cr Re (a)
Surface
(b)
[image:5.595.311.536.73.258.2]Al 10µ m
Fig. 10 (a) BEI and EPMA result from as-formed specimen; cross-sectional concentration profiles of Al, Ni, Cr and Re. (b) EDS-mapping image of Al in corresponding region. Note that Al was enriched in the region adjacent to the inner side of the barrier layer.
1 1’ 3
3’ 2’ 2
Axis in atomic fraction
Fig. 11 Ternary-approximation compositions of the phases in the regions adjacent to the barrier layer. The composition with high Re content is plotted as filled squares, and with very low Re content is plotted as filled dots. 1 (10), 2 (20) and 3 (30), representing the outer (inner) neighboring
[image:5.595.57.284.74.224.2] [image:5.595.55.282.277.587.2]In the as-formed state, Re was dissolved from the barrier layer into both its inner and outer neighboring regions, the Ni-Cr-Al phase contained 10.8 at% Al and 1.9 at% Re in the inner neighboring region, about 9.4 at% Al and 2.4 at% Re in the outer neighboring region. When the as-formed specimen was annealed at high temperature in vacuum, more Re dissolved from the barrier layer into the outer neighboring region during the initial annealing stage, and so the barrier layer was partly decomposed from its outer interface. However, Cr evaporation led to an increase in Al concen-tration in the outer Ni-Cr-Al phase, so dissolution of Re was suppressed. As a result, the dissolved Re was re-precipitated as a Re-rich phase due to its low solubility limit in such a high-Al phase, as shown in Fig. 7(b). The high-Re content detected by EDXRF in the annealed specimen, as shown in Table 1, should be due to the Re-rich precipitates and the decrease in thickness of the outer layer. In the oxidized specimen, the phase in the outer neighboring region of the barrier layer contained approximately 9.4 at% Al and about 2 at% Re dissolved into it from the barrier layer. Because this
low-Al Ni-Cr-Al phase was very thick (30mm), the barrier
layer was significantly decomposed from its outer interface. Kirkendall voids formed near the rest of the barrier layer should be in the region of the decomposed barrier layer.
However, an inverse phenomenon was found in the inner neighboring regions of the barrier layers. A high-Al Ni-Cr-Al phase was formed in this region in both the annealed and oxidized specimens. Thus, Re of the barrier layer was only partially dissolved into the inner neighboring regions during heat treatment, and almost no decomposition of the barrier layer happened at its inner interface. The SEM images of the cross section illustrated that the inner interface of the barrier layer was almost unchanged, as shown in Fig. 7, 9 and 10.
5. Summary
Changes in coatings with a Re-based diffusion barrier layer by heat treatment were studied by methods of surface and cross-sectional analysis. The following are the main results from this experiment:
(1) In the as-formed state, the coating was comprised of two layers, a Re-based alloy layer known as a diffusion barrier layer, and a Ni-based outer layer which appeared
to be composed of a-0mixture from the results of the
surface analysis.
(2) After annealing at 1423 K in vacuum for 25 h, both Cr
concentration and the thickness of the outer layer significantly decreased, and Al oxide formed on the coating surface.
(3) After cyclic oxidization, a protective Al-oxide scale was formed on the surface of the Al reservoir.
(4) A high-Al inner region adjacent to the barrier layer was quickly formed in the initial stages of both annealing and cyclic oxidation. Decomposition of the barrier layer was suppressed at its inner interface.
(5) The decomposition of the barrier layer was due to Re dissolving from the barrier layer into a neighboring low-Al Ni-Cr-Al phase. The solid solubility of Re significantly decreased with increasing Al concentra-tion in the Ni-Cr-Al phase.
The barrier layer should have good thermal stability at
high temperatures, such as 1423 K, since -NiAl phase is
usually utilized as the Al reservoir in practice.9,10)
Acknowledgement
The investigation was carried out with financial support from Specially Promoted Research under contract number 16001004, from a Grant-in-Aid for Scientific Research, Ministry of Education, Culture, Sports, Science and Tech-nology, Japan.
REFERENCES
1) T. Narita: High Temp. Soc.28(2002) 135–143. 2) M. J. Pomeroy: Mater. and Design26(2005) 223–231.
3) T. Narita, K. Z. Thosin, L. Fengqun, S. Hayashi, H. Murakami, B. Gleeson and D. Young: Mater. Corros.56(2005) 923–929.
4) T. Narita, S. Hayashi, F. Lang and K. Z. Thosin: Mater. Sci. Forum502
(2005) 99–104.
5) T. Hino, Y. Ishiwata, Y. Yoshioka, K. Nagata, T. Kobayashi, Y. Koizumi, H. Harada and T. Yamagata: Proc. Int. Cong. on Gas Turbine, (Kobe, 1999) pp. 169–174.
6) M. King, W. F. McClune, H. E. Clark, B. L. Frank, T. M. Kahmer, L. Zwell, L. R. Bernstein, W. E. Mayo, H. F. McMurdie, F. J. Rotella and M. E. Mrose:Powder Diffraction File, Set46(1212), (International Centre for Diffraction Data, U.S.A, 1996) pp. 483.
7) G. Petzow and G. Effenberg:Ternary Alloys, Volume 4, A Compre-hensive Compendium of Evaluated Constitutional Data and Phase Diagrams, (VCH publishers, New York, 1991) pp. 415.
8) W. Huang and Y. A. Chang: Mater. Sci. Eng. A259(1999) 110–119. 9) K. Vaidyanathan, E. H. Jordan and M. Gell: Acta Mater.52(2004)
1107–1115.