Phase-Field Simulation of Ferroelectric Domain
Microstructure Changes in BaTiO
3T. Koyama
*and H. Onodera
Computational Materials Science Center, National Institute for Materials Science, Tsukuba 305-0047, Japan
Phase-field method has recently been extended and utilized across many fields of materials science. Since this method can systematically incorporate, the effect of coherency strain induced by lattice mismatch and applied stress as well as external electrical and magnetic fields, it has been applied to many material processes including solidification, solid-state phase transformations, and various types of complex microstructure changes.
In this article, we focus on the ferroelectric domain microstructure changes followed by the structural phase transition from cubic to tetragonal phase in BaTiO3, and its morphological developments are simulated on the basis of the phase-field method. The circuit structure of
polarization moments of ferroelectric domains including twin defects is simulated, and the domain morphology is controlled by both the electric dipole-dipole interaction among polarization moments and the elastic interaction among domains with different tetragonal distortion. The ferroelectric domain exchange induced by external electric field is also simulated, then the dielectric property, i.e., the polarization hysteresis curve, is calculated by integrating all thexcomponents of polarization moment vector over the microstructure. Furthermore, the simulation of the reversible ferroelectric domain switching, which is a new phenomenon recently discovered by Ren, is also simulated as an advanced application of the present simulation model. [doi:10.2320/matertrans.MC200806]
(Received November 18, 2008; Accepted January 19, 2009; Published April 25, 2009)
Keywords: phase-field method, ferroelectric material, polarization domain, polarization hysteresis, time dependent Ginzburg-Landau (TDGL) equation
1. Introduction
Phase field method has been successfully applied to various materials processes including solidification, solid-state phase transformations and microstructure changes.1–8) Using phase field methodology, one can deal with the evolution of arbitrary morphologies and complex micro-structures without explicitly tracking the positions of inter-faces. It is rather straightforward to incorporate the effect of coherency and applied stresses, as well as the electrical and magnetic fields.
The phase-field simulation method of the structural phase transition in ferroelectric materials and the polarization domain exchanges by external electric field has been proposed by Li et al.,9–11) where the material employed
for calculation was the lead zirconate titanate (PZT) thin film. Recently, the temperature-strain phase diagram for BaTiO3 thin films was also calculated based on the
phase-field method.12) As the practical application to the ferro-electric random access memory, the ferroferro-electric domain switching in the memory has been analyzed on the basis of the phase-field model by Dayal and Bhattacharya.13)
There-fore, the simulation method has been well established, currently.
On the other hand, the reversible ferroelectric domain switching controlled by thermal treatment has been recently discovered by Ren14,15) in BaTiO
3 based ferroelectric
materials. Since this phenomenon induces the extremely large piezoelectric strain, this phenomenon has been ex-pected as a new type of a piezoelectric actuator.
In this paper, firstly, we focus on the ferroelectric domain microstructure changes followed by the structural phase transition from cubic to tetragonal phase in BaTiO3, and
simulate its morphological developments on the basis of the phase-field method. Then the microstructure development during the ferroelectric domain exchange induced by external electric field and the polarization hysteresis curve with this microstructure changes are simulated. Finally, we modify the conventional simulation method so as to be able to calculate the reversible ferroelectric domain switching newly discov-ered by Ren,14) and simulate the domain microstructure
changes and polarization hysteresis curve during this rever-sible ferroelectric domain switching.
2. Simulation Method
In this section, firstly, the phase-field simulation
meth-od9–12) of calculating the structural phase transition from
cubic to tetragonal phase and the ferroelectric domain microstructure changes in BaTiO3 is explained. Secondary,
we account for the mechanism of the reversible ferroelectric domain switching and propose its modeling method based on the phase-field simulation.
2.1 Phase-field simulation of the ferroelectric domain microstructure changes
The order parameter describing the ferroelectric domain structure is spontaneous polarization moment Pðr;tÞ ¼ ðP1ðr;tÞ;P2ðr;tÞ;P3ðr;tÞÞ which is the function of spatial positionrand timet. This order parameterPðr;tÞis regarded as the phase field order parameter in the phase-field method. The temporal evolutions of the polarizationPðr;tÞ, i.e., the structural phase transition and ferroelectric domain micro-structure changes, are described by the time dependent Ginzburg-Landau (TDGL) equation:
@Pi
@t ¼ LP
Gsys
Pi
; ð1Þ
where LP is the relaxation kinetic coefficient and we set
LP¼1, which means the timetis normalized toLPand the
symbol of normalized time is denoted ast0in this paper.G
sys
is the total free energy of the system, and the quantity
Gsys=Piis the thermodynamic driving force for the spatial and temporal evolution ofPðr;tÞ. The total free energyGsysis
expressed as
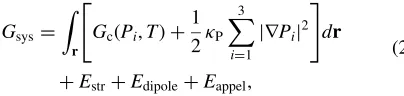
Gsys ¼ Z
r
GcðPi;TÞ þ 1
2P
X3
i¼1 jrPij2
" #
dr
þEstrþEdipoleþEappel;
ð2Þ
whereGcðPi;TÞis a bulk free energy density,Estris an elastic
strain energy, Edipole is a dipole-dipole interaction energy
among polarization moments in the microstructure,Eappelis
an electric potential energy induced from the external electric field, and the second term in the integrant is a ferroelectric domain wall energy which is expressed by the same form as the gradient energy in phase-field method. P is a gradient
energy coefficient which is assumed to be constant, P¼
8:01016(Jm2/mol), in this study. We assumed that the
strain field and electric field are always at equilibrium for a given polarization field distribution.
The bulk free energy density of the BaTiO3 system under
a stress-free boundary condition is described by a Landau-Devonshire polynomial as
Gc¼1ðP21þP 2 2þP
2
3Þ þ11ðP 4 1þP
4 2þP
4 3Þ
þ12ðP21P22þP22P23þP32P21Þ þ111ðP16þP62þP63Þ þ112½P21ðP24þP43Þ þP22ðP41þP43Þ þP32ðP41þP42Þ þ123P21P
2 2P
2
3þ1111ðP 8 1þP
8 2þP
8 3Þ
þ1112½P61ðP22þP23Þ þP62ðP21þP23Þ þP36ðP21þP22Þ þ1122ðP41P42þP24P43þP43P41Þ
þ1123ðP41P22P23þP21P24P23þP21P22P43Þ; ð3Þ
where the coefficients1,ij,ijkandijklare adjusted to the
BaTiO3 single crystal properties, and the values of which
have been determined by Liet al.16)
The elastic strain energy is given as
Estr ¼
1
2
Z
r
Cijklf"cijðrÞ "
0
ijðrÞgf"
c
klðrÞ "
0
klðrÞgdr; ð4Þ
whereCijkl is the elastic stiffness tensor,"cijðrÞand"
0
ijðrÞare
the total strain and the stress-free strain, respectively. The elastically homogeneous case and the cubic symmetry are assumed in this study, then the employed values ofCijkl are
C11 ¼2:481011 (Pa), C12¼1:571011 (Pa) and C44¼
0:911011 (Pa).17)The stress-free strain"0
ijðrÞis expressed
by the function of the polarization momentPðrÞas
"011ðrÞ ¼Q11P21ðrÞ þQ12P22ðrÞ þQ12P23ðrÞ
"022ðrÞ ¼Q12P21ðrÞ þQ11P22ðrÞ þQ12P23ðrÞ
"033ðrÞ ¼Q12P21ðrÞ þQ12P22ðrÞ þQ11P23ðrÞ
"012ðrÞ ¼ ð1=2ÞQ44P1ðrÞP2ðrÞ
"013ðrÞ ¼ ð1=2ÞQ44P1ðrÞP3ðrÞ
"023ðrÞ ¼ ð1=2ÞQ44P2ðrÞP3ðrÞ;
ð5Þ
where coefficients Qij represents the electrostrictive
coeffi-cient, and the values of the BaTiO3 single crystal case are
obtained from Ref. 16). The total strain "ijðrÞ is calculated based on the Khachaturyan’s mesoscopic elasticity theory18)
as
"cijðrÞ ¼ Z
k
1
2fpiðnÞnjnqþpjðnÞninqg
Cpqlm"0lmðkÞexpðikrÞ
dk ð2Þ3;
ð6Þ
wherekis a reciprocal vector in Fourier space andnk=jkj
is unit vector alongkdirection.ikðnÞis the inverse matrix
of 1
ik ðnÞ Cijklnjnl, and"0ijðkÞis the Fourier transform of
"0
ijðrÞ.
The dipole-dipole interaction energy among polarization moments in the microstructure is given as
Edipole¼
1 2 Z r Z r0 1 4"0"00
ij
jrr0j3
3ðrir0iÞðrjrj0Þ
jrr0j5
PiðrÞPjðr0Þdr0dr; ð7Þ where ij is Kronecker delta, "0 and "00 are the dielectric
constant of vacuum and the relative permittivity, respec-tively. In this study, we assumed the value of "00 to be
"00¼3000. The electric potential energy induced from the
external electric field is calculated by
Eappel¼
Z
r
Ei;appelPiðrÞdr
¼ ðE1;appelPP1þE2;appelPP2þE3;appelPP3Þ: ð8Þ
Ei;appelis a vector component of external electric field and the
P
Piis an spatial average ofPiðrÞ. Since the periodic boundary condition of the microstructure is employed in this study, there is no surface so the depolarization energy is neglected in this study. Numerical simulation of the microstructure changes is performed based on the conventional deference method.
[image:2.595.83.285.160.208.2]2.2 Phase-field simulation of the reversible ferroelectric domain switching
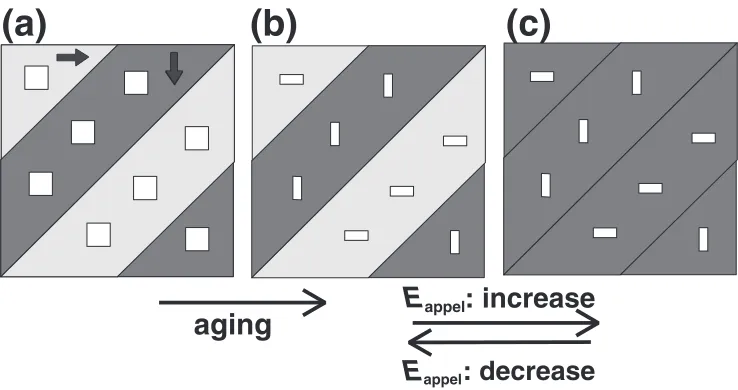
Figure 1 shows the schematic illustration explaining the mechanism of the reversible ferroelectric domain switching, which has been proposed by Ren.14)The light and dark gray
ferroelectric domain microstructure will change to (c). When the external electric field is decreased, the ferroelectric domain microstructure will get back to (b), because the previous orientation of c-axis is memorized by the aniso-tropic point defects arrangement. Further details of this mechanism is explained in Ref. 14).
Since this mechanism above mentioned is similar to the mechanism of the rubber-like behavior of reversible marten-sitic transformation19)as discussed in Ref. 10), we employed
the calculation method20,21) proposed for modeling the
rubber-like behavior of reversible martensitic transformation to simulate the reversible ferroelectric domain switching in BaTiO3.
In the simulation model of the rubber-like behavior, the new order parameter iðr;tÞ which describes the slow dynamics of point defects rearrangement is introduced to calculate the reversible domain switching. In addition to eq. (1), the temporal evolution of iðr;tÞ are also assumed to be described by the time dependent Ginzburg-Landau (TDGL) equation:
@i
@t ¼ L
Gsys
i
; ð9Þ
where L is the relaxation kinetic coefficient of the field
iðr;tÞ. The total free energy of the systemGsysis modified as
Gsys ¼ Z
r
GcðPi;TÞ þ 1
2P
X3
i¼1 jrPij2
þ1
2W
X3
i¼1
ðPiiÞ2þ 1
2
X3
i¼1 ðriÞ2
dr
þEstrþEdipoleþEappel:
ð10Þ
The third term in the integrant indicates the interaction energy between PiðrÞ and iðrÞ, in which W and are
the phenomenological parameters. The fourth term in the integrant is a gradient energy of the fieldiðrÞ, and is a
corresponding gradient energy coefficient.
3. Results and Discussion
3.1 Simulation results of the ferroelectric domain mi-crostructure changes
Figure 2 shows the two-dimensional simulation of the structural transformation from cubic to tetragonal phase in BaTiO3at 298 K, where the black part is a cubic phase, and
the gray and white parts correspond to the tetragonal phase. The gray level also indicates the orientation of polarization moment vector which is indicated by arrows in Fig. 2(f), the direction of which is parallel to the c-axis of the tetragonal phase.
At early stage of structural transformation from cubic to tetragonal phase, the tweed-like structure having the struc-tural modulation along the diagonal direction is developed (see (a)–(c)). Then the microstructure gradually changes to the twin domain morphology during coarsening of domains (see (d)–(f)), where the interface between brighter and darker pert is the twin boundary. This twin microstructure is formed due to relax the elastic constraint induced from the structural phase transition. Furthermore, the continuous circuit of the polarization moments is formed by the dipole-dipole inter-action among polarization moments (see the arrows in (f)). Note that the twin domain boundary of the tetragonal phase is coincident with the 90 ferroelectric domain boundary, and
the 180 ferroelectric domain boundary is located inside a
[image:3.595.113.482.73.268.2]twin domain.
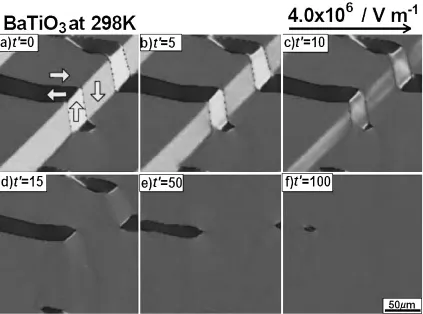
Figure 3 shows the two-dimensional simulation of the polarization domain microstructure change induced by the external electric field applied along horizontal direction (see the upper right arrow). The applied external electric field is set to be constant and the value of which is 4
106(V/m), and the Fig. 2(f) is employed as the initial microstructure for this simulation, so Fig. 3(a) is the same as Fig. 2(f).
The behavior of ferroelectric domain exchanges with the external electric field is simulated from (a) to (f). Initially,
(a)
(b)
(c)
aging
E
appel: increase
E
appel: decrease
[image:3.595.49.292.647.727.2]Fig. 2 Two-dimensional simulation of the structural transformation from cubic to tetragonal phase in BaTiO3at 298 K.
[image:4.595.86.510.71.377.2] [image:4.595.87.510.442.756.2]the domains having polarization moment along the vertical direction, which is perpendicular to the external electric field, start to disappear (see (b)–(d)), because these domains are energetically unstable not only for the potential energy by the external electric field but also for the elastic strain energy. Then, the domains having polarization moment pointing left hand side shrink, gradually (see (d)–(f)). In this case, since the entire region is a single twin domain, i.e., tetragonal single crystal, the elastic strain energy does not exist. Therefore, the driving force for microstructure changes is only the potential energy induced by the external electric field. Since we confirmed from this result that the ferro-electric domain exchanges is taken place with the external electric field, we further tried to simulate the ferroelectric domain microstructure changes induced by the external alternating electric field.
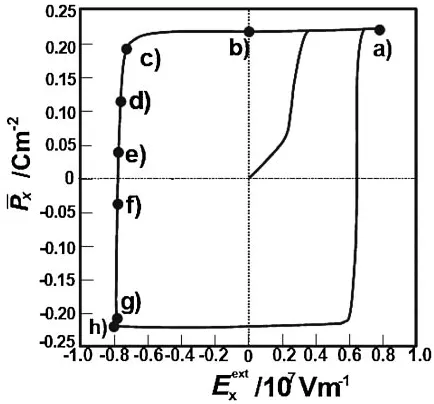
Figure 4 shows the two-dimensional simulation of the polarization domain microstructure changes induced by the external alternating electric field. Since the phase-field method can not calculate nucleation process, the some nucleation site is artificially introduced on the four sides of each figure. The dielectric property, i.e., the polarization hysteresis curve, is calculated by integrating all the x
components of polarization moment vector in the micro-structure (horizontal direction is x-axis), and the calculated dielectric hysteresis curve corresponding to the microstruc-ture changes in Fig. 4 is represented as Fig. 5, where the abscissa is an external alternating electric field and the vertical axis indicates the average polarization moment along horizontal direction. The solid circles (a) to (h) in Fig. 5 are calculated from the figures (a) to (h) in Fig. 4, respectively. The dielectric hysteresis is reasonably calculated in accord-ance with the morphological microstructure changes of the ferroelectric domains.
3.2 Simulation results of the reversible ferroelectric domain switching
Figure 6 shows the two-dimensional simulation of the reversible ferroelectric domain switching induced by the external alternating electric field. The initial microstructure morphology of (a) is artificially set up, where the polarization moment PiðrÞ takes equilibrium value depending on the morphology of the domain microstructure. The order parameter field iðrÞ is fixed so as to satisfy the relation
iðrÞ ¼PiðrÞ, which corresponds to the state of the minimum interaction energy (see the third term in the integrant of eq. (10)). Furthermore, since we want to calculate the typical
Fig. 4 Two-dimensional simulation of the polarization domain microstructure changes induced by the external alternating electric field.
[image:5.595.317.534.383.585.2]case in which the field iðrÞ strongly constrains the polar-ization moment fieldPiðrÞ, the parametersW,,andL
are assumed to be W ¼500(J/mol), ¼1, ¼0 and L¼0, respectively. As a result,iðrÞdoes not change from the initial setting.
The polarization hysteresis curve is calculated by integrat-ing all the xcomponents of polarization moment vector in the microstructure, and the calculated dielectric hysteresis curve corresponding to the microstructure changes in Fig. 6 is represented as Fig. 7. The circles (a) to (l) in Fig. 7 are calculated from the microstructures (a) to (i) in Fig. 6. The feature of the ferroelectric domain microstructure changes is almost same as that observed in Fig. 3, and the reversible domain switching behavior is calculated, reasonably.
4. Conclusions
The ferroelectric domain microstructure changes followed by the structural phase transition from cubic to tetragonal phase in BaTiO3, and the ferroelectric domain microstructure
changes are simulated on the basis of the phase-field method. Furthermore, the simulation of the reversible domain switch-ing, which is a new phenomenon recently discovered by Ren, is also simulated as an advanced application of the present simulation model. The results obtained are as follows: (1) The circuit structure of polarization moments of ferro-electric domains including twin defects is simulated, and the domain morphology is controlled by both the electric dipole-dipole interaction among polarization moments and the elastic interaction among domains with different tetragonal distortion.
(2) The ferroelectric domain exchange induced by external electric field is simulated, and the polarization hysteresis curve is calculated, simultaneously, by integrating all thex
components of polarization moment vector over the micro-structure.
(3) The reversible ferroelectric domain switching in BaTiO3
is reasonably modeled by using the calculation method for the rubber-like behavior in reversible martensitic trans-formation.
Fig. 6 Two-dimensional simulation of the reversible ferroelectric domain switching induced by the external alternating electric field.
[image:6.595.114.483.62.364.2] [image:6.595.316.531.416.615.2]Acknowledgements
This study was supported by Grant-in-Aid for Scientific Research on Priority Areas ‘‘Nano Materials Science for Atomic Scale Modification 474’’, and a Next-Generation Supercomputer Project, from Ministry of Education, Culture, Sports, Science and Technology (MEXT) of Japan. The support from a Grantin-Aid Core Research for Evolutional Science and Technology (CREST), Japan Science and Technology Agency (JST) is also acknowledged.
REFERENCES
1) T. Koyama: Materia Japan (Bull. the Japan Inst. Metals)42(2003) 397. 2) T. Koyama: Ferrum (Bulletin of The Iron and Steel Institute of Japan)9
(2004) 240.
3) T. Koyama: Ferrum (Bulletin of The Iron and Steel Institute of Japan)9
(2004) 301.
4) T. Koyama: Ferrum (Bulletin of The Iron and Steel Institute of Japan)9
(2004) 376.
5) T. Koyama: Ferrum (Bulletin of The Iron and Steel Institute of Japan)9
(2004) 497.
6) T. Koyama: Ferrum (Bulletin of The Iron and Steel Institute of Japan)9
(2004) 905.
7) T. Koyama: Chapter 21 inSpringer Handbook of Materials Measure-ment Methods, ed. by H. Czichos, T. Saito and L. Smith (Springer-Verlag, 2006).
8) T. Koyama: Sci. Technol. Adv. Mater.9(2008) 013006.
9) Y. L. Li, S. Y. Hu, Z. K. Liu and L.-Q. Chen: Appl. Phys. Lett.78
(2001) 3878.
10) Y. L. Li, S. Y. Hu, Z. K. Liu and L.-Q. Chen: Acta Mater.50(2002) 395.
11) J. Wang, S.-Q. Shi, L.-Q. Chen, Y. Li and T.-Y. Zhang: Acta Mater.52
(2004) 749.
12) Y. L. Li and L.-Q. Chen: Appl. Phys. Lett.88(2006) 072905. 13) K. Dayal and K. Bhattacharya: Acta Mater.55(2007) 1907. 14) X. Ren: Nature Mater.3(2004) 91.
15) W. Liu, W. Chen, L. Yang, L. Zhang, Y. Wang, C. Zhou, S. Li and X. Ren: Appl. Phys. Lett.89(2006) 172908.
16) Y. L. Li, L. E. Cross and L.-Q. Chen: J. Appl. Phys.98(2005) 064101. 17) T. Yamada: J. Appl. Phys.43(1972) 328.
18) A. G. Khachaturyan:Theory of Structural Transformations in Solis, (Wiley and Sons, New York, 1983).