Texture and Planar Anisotropy of
r
-Value in Duplex Stainless Steel Sheet
Jun-ichi Hamada
1;*and Hirofumi Inoue
21Steel Research Laboratories, Nippon Steel Corporation, Futtsu 293-8511, Japan
2Department of Materials Science, Graduate School of Engineering, Osaka Prefecture University, Sakai 599-8531, Japan
The effect of cold-rolling reduction on texture and planar anisotropy of ther-value was investigated in type 329J4L duplex stainless steel (DSS) sheet, which has a two-phase ferrite () and austenite () microstructure. In addition, the possibility of predicting the planar anisotropy of ther-value on the basis of the Taylor theory was investigated in consideration of the texture gradient through the thickness. An increase in cold-rolling reduction resulted in the improved averager-value and the strong directionality with a maximum value at the diagonal direction. The phase had an extremely strongbcc-fiber texture and thephase had- andfcc-fiber textures. The texture gradient in the thickness direction was more remarkable in thephase than in thephase. Ther-values calculated from the overall texture of thephase using the relaxed constraints model with two relaxed shear strain constraintse13,e23and a CRSS ratio of 1.1 for {112} andf011gh111iglide systems were in quite good agreement with the experimentalr-values. This suggested that slip deformation in thematrix was dominant for type 329J4L DSS sheet. However, the difference between the experimental and calculated results was remarkable in the vicinity of the diagonal direction.
[doi:10.2320/matertrans.MG200908]
(Received September 28, 2009; Accepted November 18, 2009; Published March 25, 2010)
Keywords: duplex stainless steel,r-value, planar anisotropy, texture, orientation distribution function, Taylor model, cold rolling, annealing, microstructure
1. Introduction
Duplex stainless steels (DSS), such as type 329J4L, which have a two-phase ferrite () and austenite () microstructure, have been adopted for the fabrication of water tanks and heat exchange panels having complicated forms, because they have good corrosion resistance and strength.1–3) In the case of using DSS in form of flat products, the formabilities of the cold-rolled and annealed sheets are important. Then, it is necessary to examine the microstructure and to understand its influence on the mechanical properties of the final product. It has been shown that the yield point and elongation of DSS cold-rolled and annealed sheets depend on the texture of the
matrix with the strong-fiber (f100gh011i f111gh011i) i.e., cold-rolling texture for BCC metal.4–13)However, there are few studies on the planar anisotropy of ther-value and the effect of the texture of each phase on ther-value.7,8)
In this study, the texture and the planar anisotropy of the
r-value were investigated for type 329J4L DSS sheets with different cold-rolling reductions. Additionally, we predicted the planar anisotropy of ther-value on the basis of the Taylor theory from the quantitative texture of each phase, and then the most suitable model for predicting the plastic anisotropy of DSS sheet was also examined by comparison with experimental data.
2. Experimental Procedures
The chemical composition of commercial type 329J4L hot-rolled plate used in this study is given in Table 1. The thickness (t) of the plate was 4.5 mm. Hot-rolled specimens were annealed for 60 s at 1050C, followed by air cooling.
The annealed specimen was cold-rolled to 67%, 78%, and 89% reductions on a laboratory rolling mill, and the cold-rolled sheets were annealed for 30 s at 1075C, followed by
air cooling. Ther-values of the JIS 13B test pieces cut from these sheets were measured after 10% tensile strain at angles of 0, 15, 30, 45, 60, 75, and 90 with respect to the
rolling direction. The average r-value (rm) was calculated using the following equation.
rm¼ ðr0þ2r15þ2r30þ2r45þ2r60þ2r75þr90Þ=12 ð1Þ Also, in this study the anisotropic parameter (Ar) was defined in the next expression,
Ar¼rmaxrmin ð2Þ where,rmaxandrminare the maximum and minimum values among the measured r-values in the seven directions, respectively. Microstructural observations were carried out by optical microscopy on the longitudinal section, or the section parallel to the rolling plane in the center of the final annealed specimens. The textures were quantitatively exam-ined using the orientation distribution function (ODF). Incomplete pole figures of (200), (211), and (310) for the
phase and those of (200), (220), and (311) for the phase were measured on the sections perpendicular to the normal direction (ND-section) and the transverse direction (TD-section) of the sheets by means of the Schultz reflection method using Mo Kradiation. From these pole figures, the ODF was determined using the iterative series-expansion method.14) For estimation of the texture gradient in the sheets, the ND-sectional samples were prepared from various locations in the thickness direction. For measuring the average texture in the thickness direction of the sheets, a TD-sectional sample for pole figure measurement was prepared by stacking and bonding a large number of cut sheet samples.15,16) The ODF on the TD-basis was
trans-Table 1 Chemical composition of steel used (mass%).
C Si Mn P S Ni Cr Mo N
0.02 0.5 0.7 0.02 0.003 6.9 25.2 3.0 0.11
*Formerly at Research & Development Center, Nippon Steel & Sumikin
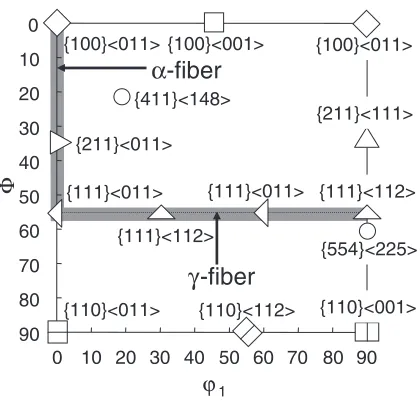
[image:1.595.300.551.362.389.2]formed into the normal ODF on the ND-basis by assuming orthorhombic sample symmetry.15)Figure 1 shows the most important texture components and fibers for the phase in the’2¼45section of ODF (Bunge’s notation).
3. Analytical Procedures
In this study, the prediction of ther-value was carried out from ODF data using the Taylor full-constraints (FC) model17)and the relaxed constraints (RC) model,18)in which some shear-strain components are relaxed in contrast to those in a fully constrained state. Software developed by one of the authors was employed in this calculation.19–22)In this study, the shear strain perpendicular to the tensile direction was taken as requisiteness for relaxing shear component, because it was thought that this component was hard to be most restricted in tensile testing,6,20,21) and the necessity of the relaxation of the other components was examined. In other words, the RC23 model in which shear strain componente23 is left free, RC1323 model in whiche13ande23are left free, and RC121323 model in whiche12,e13, ande23are left free (1, 2, and 3 are defined as the tensile, width, and thickness directions, respectively) were used among several kinds of the RC models having the combination of shear strain components shown in Fig. 2. The RC1323 model, namely the pancake model, has been used as the most suitable model for BCC metals in the previous studies.6,16,20,23,24) On the other hand, in FCC material, austenitic stainless steel and some aluminum alloy, it has been reported that the angular dependence of the yield strength or r-value are estimated by the FC model.6,19,22)Assuming that the elongation in the tensile direction isd"and that the contractions in the width and thickness directions areqd"andð1qÞd", respectively, the deformation tensor can be defined as follows.
E¼
d" e12 e13 0 qd" e23 0 0 ð1qÞd"
2 6 4
3 7
5 ð3Þ
Consequently, the r-value is defined by the following equation.
r¼q=ð1qÞ ð4Þ
In the FC modele13,e23ande12are zero, in the RC23 model
e12 ande13 are zero, and in the RC1323 modele12 is zero. The q-value and r-value in each tensile direction can be calculated from the ODF by minimizing the plastic work of the slip deformation; the minimization can be performed by considering the combination of active slip systems.25,26)The slip systems employed in this calculation were f110gh111i
and f211gh111i for the phase and f111gh011i for the
phase. The values of the critical resolved shear stress (CRSS) ratio of the {211} and {110} glide planes (f211g=f110g) are
assumed to be 0.9, 1.0, and 1.1 in calculations for the
phase using the RC model.
4. Results and Discussions
4.1 R-values
Figure 3 shows the effect of cold-rolling reductions on the planar anisotropies of the r-values measured for the final annealed sheets. All specimens cold-rolled to different reductions showed a strong directionality, i.e. a noticeable planar anisotropy with the so-called reverse V type that had a maximum value at the 45direction. With an increase in the
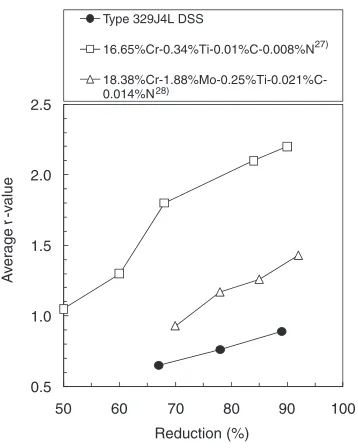
cold-rolling reduction, ther-value, in particular, increased in the vicinity of the 45direction. Figure 4 shows the effect of
cold-rolling reduction on the averager-value. The averager -value also increased with increasing cold-rolling reduction. In this figure, the published experimental data of ferritic single-phase stainless steel sheets27,28)were plotted, too. It is not very meaningful to make a quantitative comparison of the r-value between type 329J4L and ferritic single-phase
0 10 20 30 40 50 60 70 80 90
90 80 70 60 50 40 30 20 10 0
Φ
ϕ
1{100}<011>{100}<001> {100}<011>
{211}<011>
{211}<111>
{111}<011> {111}<011>
{111}<112>
{110}<011> {110}<112> {110}<001> {411}<148>
α
-fiber
γ
-fiber
{554}<225> {111}<112>
Fig. 1 Some important fiber textures and orientations in Euler space (’2¼45section).
X1
X3
X2 e13
X1
X3
X2 e23
X1
X3
X2
e12
Fig. 2 Schematic representation of local shear strain relaxation in relaxed-constraints models.X1,X2 andX3 are the tensile, width and thickness
[image:2.595.66.276.69.270.2] [image:2.595.339.507.73.319.2]stainless steel sheets with different textures, but the improve-ment of the averager-value with the increase in cold-rolling reduction is qualitatively similar to that in the case of ferritic stainless steel sheets. However, the magnitude of anisotropy is large in comparison with the ferritic and austenitic steel sheets,27–29)and there is a characteristic that ther-values in the vicinity of the diagonal direction are remarkably high for type 329J4L DSS sheet.
4.2 Microstructures
Figure 5 shows the microstructures (TD plane) of the final annealed sheets. These sheets consisted of thematrix (dark) elongated parallel to the rolling direction and the phase (white) partially fragmented by the phase. The result of measuring the fraction of thematrix of final annealed sheet with 67% cold-rolling reduction by using the image analysis was about 63%. In this observation, there is no significant
0.0 0.5 1.0 1.5 2.0 2.5
0 10 20 30 40 50 60 70 80 90
r
-v
alue
Angle to rolling direction,θ/ °
Red. 67%
Red. 78%
Red. 89%
Fig. 3 Planar anisotropy of ther-value measured for final annealed sheets.
0.5 1.0 1.5 2.0 2.5
50 60 70 80 90 100
A
v
er
age
r
-v
alue
Reduction (%)
Type 329J4L DSS
16.65%Cr-0.34%Ti-0.01%C-0.008%N
18.38%Cr-1.88%Mo-0.25%Ti-0.021%C-0.014%N
27)
28)
Fig. 4 Effect of cold-rolling reductions on averager-value.
RD
ND
(a)
20
µ
m
(b)
20
µ
m
(c)
20
µ
m
[image:3.595.338.517.69.293.2] [image:3.595.90.250.72.295.2] [image:3.595.144.455.335.642.2]effect of cold-rolling reduction on the microstructures of the final annealed sheets, but the fragmented phase seems to increase with increasing rolling reduction.
4.3 Textures
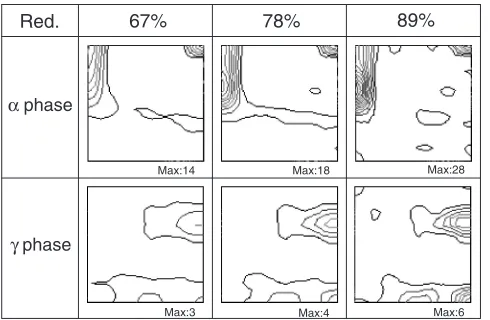
Figure 6 shows the ’2¼45 sections of the ODFs determined from the ND-section pole figures of the center layers in the final annealed specimens with different cold-rolling reductions. The features of a strong bcc-fiber (f100gh011i-f211gh011i-f111gh011i) and an undeveloped -fiber (f111gh011i-f111gh112i) in the final annealed sheets are similar to the previous studies.4–10) The orientation density increased with increasing cold-rolling reduction. The main orientation is f100gh011i at a 67% cold-rolling reduction, while it is f211gh011i at 78% and 89% cold-rolling reductions. From the calculated result of the planar aniso-tropy of ther-value for some ideal orientations, the diagonal direction of the f211gh011i component shows a higher r -value than the longitudinal and transverse directions.16)It is speculated that the development off211gh011icomponent in the phase with an increase in cold-rolling reduction is related to the enhancement of anisotropy by the increasedr -value in the 45 direction. The phase has a-fiber texture
including major components off112gh111i (Copper-orienta-tion), f123gh634i (S-orientation), and f011gh211i (Brass-orientation), and afcc-fiber texture including major compo-nents off011gh100i(Goss-orientation) andf011gh211i. The orientation density in the phase increases with increasing cold-rolling reduction.
Figure 7 shows the ’2¼45 sections of the ODFs determined from the ND-section pole figures of the surface, quarter, and center layers in the final annealed specimen with a 67% cold-rolling reduction. Although the phase exhibits almost no texture change along the thickness direction, the
phase has a significant texture gradient in the thickness direction. Namely, in the phase, the bcc-fiber is strongly developed in the quarter and center layers, but in the surface layer the orientation density is weak compared with the other layers, and the Goss orientation f011gh100i is slightly formed. Thus, when there is such a texture gradient in the thickness direction, it is impossible to precisely predict the planar anisotropy of the r-value from the texture on a
particular ND-section.16,20–22) Figure 8 shows the overall ODFs determined from the TD-section pole figures for the
and the phases in the final annealed sheets with different cold-rolling reductions. In this figure, the overall ODFs are presented in’2section through Euler space in order to show in particular the fiber texture of the phase clearly. In terms of the type of texture, the overall ODFs are the same as the partial ODFs in various locations through the sheet thickness; the maximum orientation densities of the overall ODFs have a tendency to be weak in comparison with those of the partial ODFs in the center layers. This proves that the texture gradient in the thickness direction is taken into account in the overall texture.
4.4 Predictions ofr-value
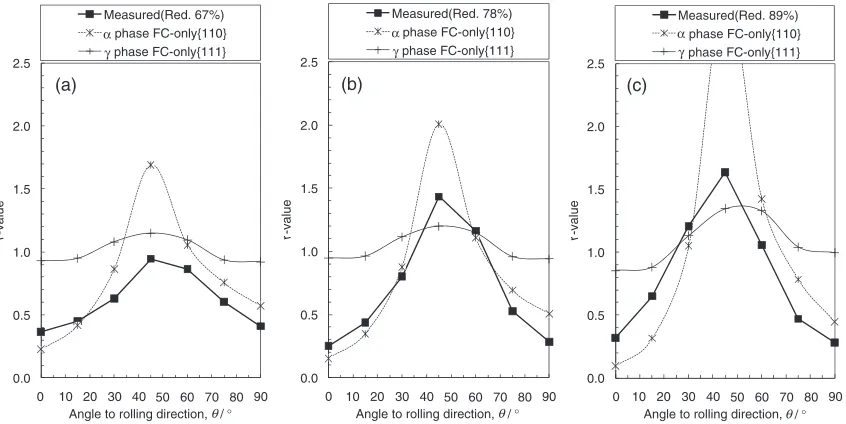
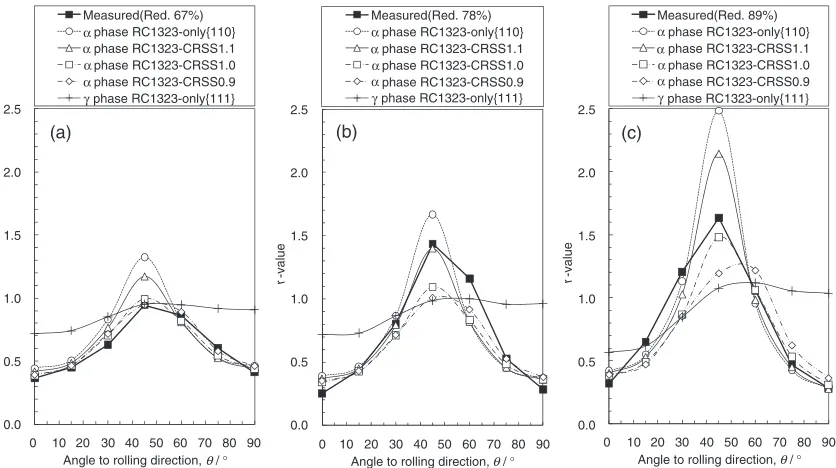
Figure 9 shows the planar anisotropies of the r-values measured experimentally and calculated using the FC model from an overall texture of theor phase. The predicted results obtained by the RC23, RC1323, and RC121323 models are compared with the experimental results in Figs. 10, 11, and 12, respectively. The anisotropies of the calculated results using any model from the overall texture of the phase are smaller than those obtained by experi-ments. The calculated values using the FC model for the
phase also significantly differ from the experimental values in all conditions of cold-rolling. The predicted results obtained by the RC23 and RC121323 models for the
phase overestimated ther-value in the vicinity of the 0and/
or 90 directions in comparison with the RC1323 model.
When the RC1323 model for the phase, which was the most suitable model for ferritic steel sheets,16,20,21,23,24) is used, the calculated results become much closer to the experimental values in comparison with the other models. The RC1323 model with relaxed shear strains for the
phase gives a better agreement than the FC models assuming homogeneous deformation in all grains for the and
phases. For thef211gh111iandf110gh111iglide systems in the phase, CRSS ratios of 0.9523,24) and 1.16,16,20,21)have been reported to be suitable for single-phase ferritic steels. The result indicates that the prediction for the 45direction has a tendency toward overestimation when only a {110} slip system is used for calculation, so that we should Max:14
Max:3
Max:18
Max:4
Red. 67% 78% 89%
Max:28
Max:6
α phase
γ phase
Fig. 6 ’2¼45 sections of ODFs in the center layer for final annealed
sheets. Contour levels: 2 to 28, step 2 forphase, and 1 to 6, step 1 for phase.
Section
Max:12
Max:3 Max:5
Max:2
Max:14
Max:3
t/30 t/4 t/2
α phase
γ phase
[image:4.595.48.293.72.232.2] [image:4.595.305.547.73.233.2]consider both the {110} and {211} slip systems for the
phase in type 329J4L DSS sheet like in single-phase ferritic steels. From the calculations by CRSS ratios of 0.9, 1.0, and 1.1, the most suitable ratio cannot be determined, but a
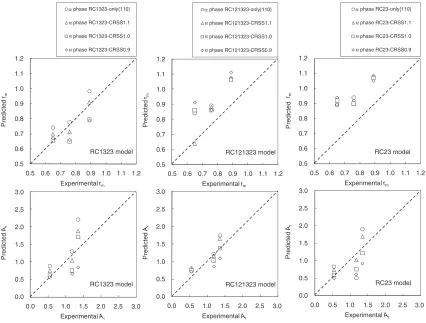
CRSS ratio of 1.0 or 1.1 provides the calculated value close to the experimental value. The comparisons in rm and Ar between the experimental result and the calculated one by some models are shown in Fig. 13. From these results, it
(a)
(b)
(c)
(d)
(e)
(f) Max:10
Max:2 Max:8
Max:2
Max:18
Max:5
Fig. 8 Overall textures through sheet thickness for (a), (c), and (e)phase, and (b), (d), and (f)phase in final annealed sheets with (a) and (b) 67%, (c) and (d) 78%, and (e) and (f) 89% cold-rolling reductions. Contour levels: 2 to 18, step 2 forphase, and 1 to 5, step 1 for phase.
0.0 0.5 1.0 1.5 2.0 2.5
0
r
-value
Angle to rolling direction, θ/ ° Measured(Red. 67%)
phase FC-only{110} phase FC-only{111}
0.0 0.5 1.0 1.5 2.0 2.5
0
r
-value
Angle to rolling direction, Measured(Red. 78%)
phase FC-only{110} phase FC-only{111}
0.0 0.5 1.0 1.5 2.0 2.5
0
r
-value
Angle to rolling direction, Measured(Red. 89%)
phase FC-only{110} phase FC-only{111}
(a) (b) (c)
α γ α
γ
θ/ ° θ/ °
α γ
10 20 30 40 50 60 70 80 90 10 20 30 40 50 60 70 80 90 10 20 30 40 50 60 70 80 90
[image:5.595.69.526.68.415.2] [image:5.595.89.512.478.690.2]should be noted that among the models investigated in this study, the RC1323 model with a CRSS ratio of 1.1 for the
phase gives comparatively good coincidence with the measured values. In order to provide the best prediction for the r-value, i.e. in order to determine both the model and CRSS ratio, it is necessary to make a comparison with a number of experimental data. However, because the same RC model for thematrix is suitable in spite of differences in the existence of the secondary phase and the morphology of grains in type 329J4L DSS sheet and ferritic single phase sheet, it is suggested that slip deformation in the matrix which is softer than the phase, and the volume fraction are more dominant in tensile behavior at relatively low strain in
type 329J4L DSS sheet, and that inhomogeneous deforma-tion occurs in the phase similar to single-phase ferritic steels.
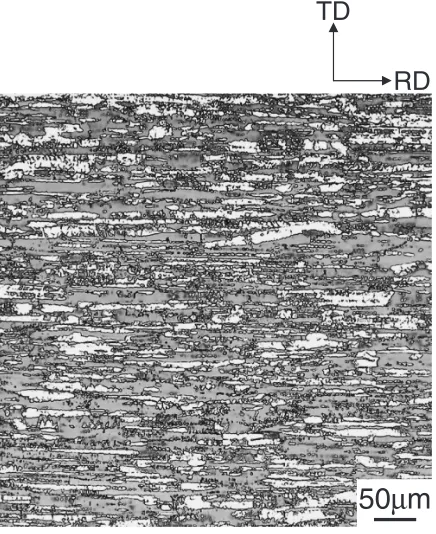
Furthermore, much attention should be paid to the direction where the difference between the experimental and calculated values is remarkable, especially to the diagonal direction. The microstructure on the rolling plane in the center layer is shown in Fig. 14. As both theand
phases are elongated along the longitudinal direction unlike single-phase materials, a shape factor of thephase or grain boundaries should be considered for DSS sheets. From the viewpoint of the morphological contribution, Moverare et al.8) presented that for loading at the 45 direction, the
0.0 0.5 1.0 1.5 2.0 2.5 0 r -value Measured(Red. 89%) phase RC23-only{110} phase RC23-CRSS1.1 phase RC23-CRSS1.0 phase RC23-CRSS0.9 phase RC23-only{111} 0 r -value Measured(Red. 78%) phase RC23-only{110} phase RC23-CRSS1.1 phase RC23-CRSS1.0 phase RC23-CRSS0.9 phase RC23-only{111} 0 r -value
Angle to rolling direction, Measured(Red. 67%) phase RC23-only{110} phase RC23-CRSS1.1 phase RC23-CRSS1.0 phase RC23-CRSS0.9 phase RC23-only{111}
(a) (b) (c)
θ/ ° 10 20 30 40 50 60 70 80 90
Angle to rolling direction, θ/ ° 10 20 30 40 50 60 70 80 90
[image:6.595.93.511.71.305.2]Angle to rolling direction, θ/ ° 10 20 30 40 50 60 70 80 90 0.0 0.5 1.0 1.5 2.0 2.5 0.0 0.5 1.0 1.5 2.0 2.5 α α α α γ α α α α γ α α α α γ
Fig. 10 Planar anisotropy ofr-value measured and calculated using RC23 model from the overall texture for final annealed sheets with (a) 67%, (b) 78%, and (c) 89% cold-rolling reduction.
0.0 0.5 1.0 1.5 2.0 2.5 r -value
Angle to rolling direction, Measured(Red. 67%) phase RC1323-only{110} phase RC1323-CRSS1.1 phase RC1323-CRSS1.0 phase RC1323-CRSS0.9 phase RC1323-only{111}
0 10 20 30 40 50 60 70 80 90
r
-value
Angle to rolling direction, θ/ ° Measured(Red. 78%) phase RC1323-only{110} phase RC1323-CRSS1.1 phase RC1323-CRSS1.0 phase RC1323-CRSS0.9 phase RC1323-only{111} r -value
Angle to rolling direction, Measured(Red. 89%) phase RC1323-only{110} phase RC1323-CRSS1.1 phase RC1323-CRSS1.0 phase RC1323-CRSS0.9 phase RC1323-only{111}
(a) (b) (c)
θ/ ° θ/ °
0 10 20 30 40 50 60 70 80 90 0 10 20 30 40 50 60 70 80 90
0.0 0.5 1.0 1.5 2.0 2.5 0.0 0.5 1.0 1.5 2.0 2.5 α α α α γ α α α α γ α α α α γ
[image:6.595.92.510.352.586.2]direction of maximum shear stress was oriented to the same direction as the elongated microstructure and the slip lines extended over a greater distance compared with loading at the rolling and transverse directions. Further investigations in consideration of the morphology and observations of the deformation structure are required in future to realize the precise prediction of plastic anisotropy in DSS sheets.
5. Conclusions
In this study, the effect of cold-rolling reduction on texture and planar anisotropy of ther-value was investigated in type 329J4L DSS sheet. Moreover, the possibility of predicting the planar anisotropy of the r-value on the basis of the Taylor theory was examined in consideration of the texture
r
-value
Angle to rolling direction, Measured(Red. 89%) phase RC121323-only{110} phase RC121323-CRSS1.1 phase RC121323-CRSS1.0 phase RC121323-CRSS0.9 phase RC121323-only{111} 0 r -value
Angle to rolling direction, Measured(Red. 78%) phase RC121323-only{110} phase RC121323-CRSS1.1 phase RC121323-CRSS1.0 phase RC121323-CRSS0.9 phase RC121323-only{111} 0.0 0.5 1.0 1.5 2.0 2.5 r -value
Angle to rolling direction, Measured(Red. 67%) phase RC121323-only{110} phase RC121323-CRSS1.1 phase RC121323-CRSS1.0 phase RC121323-CRSS0.9 phase RC121323-only{111}
(a)
(b)
(c)
θ/ °
0 10 20 30 40 50 60 70 80 90 0 10 20 30 40 50 60 70 80 90 0 10 20 30 40 50 60 70 80 90
0.0 0.5 1.0 1.5 2.0 2.5 0.0 0.5 1.0 1.5 2.0 2.5
θ/ ° θ/ °
[image:7.595.91.510.70.306.2]α α α α γ α α α α γ α α α α γ
Fig. 12 Planar anisotropy ofr-value measured and calculated using RC121323 model from the overall texture for final annealed sheets with (a) 67%, (b) 78%, and (c) 89% cold-rolling reduction.
0.5 0.6 0.7 0.8 0.9 1.0 1.1 1.2
0.5 0.6 0.7 0.8 0.9 1.0 1.1 1.2
Predicted
rm
Experimental rm
phase RC1323-only{110} phase RC1323-CRSS1.1 phase RC1323-CRSS1.0 phase RC1323-CRSS0.9 RC1323 model Predicted Ar
Experimental Ar
RC1323 model
Predicted
rm
Experimental rm
phase RC121323-only{110} phase RC121323-CRSS1.1 phase RC121323-CRSS1.0 phase RC121323-CRSS0.9 RC121323 model Predicted Ar
Experimental Ar
RC121323 model rm
Experimental rm
phase RC23-only{110} phase RC23-CRSS1.1 phase RC23-CRSS1.0 phase RC23-CRSS0.9 RC23 model 0.0 0.5 1.0 1.5 2.0 2.5 3.0 Predicted Ar
Experimental Ar
RC23 model
0.0 0.5 1.0 1.5 2.0 2.5 3.0 0.0 0.5 1.0 1.5 2.0 2.5 3.0
0.0 0.5 1.0 1.5 2.0 2.5 3.0 0.0 0.5 1.0 1.5 2.0 2.5 3.0 0.0 0.5 1.0 1.5 2.0 2.5 3.0 0.5 0.6 0.7 0.8 0.9 1.0 1.1 1.2 0.5 0.6 0.7 0.8 0.9 1.0 1.1 1.2
0.5 0.6 0.7 0.8 0.9 1.0 1.1 1.2 0.5 0.6 0.7 0.8 0.9 1.0 1.1 1.2 α α α α α α α α α α α α Predicted
[image:7.595.85.511.350.673.2]gradient in the thickness direction. The main results can be summarized as follows:
(1) With an increase in cold-rolling reduction, the average
r-value rm increased, and a strong directionality appeared, having the maximum value in the diagonal direction.
(2) Thephase had an extremely strongbcc-fiber texture, and the phase had - and fcc-fiber textures. With an increase in rolling reduction, the orientation density became higher in both phases. The texture gradient in the thickness direction was more remarkable in thephase than in the
phase.
(3) The r-values calculated from the overall texture through sheet thickness of the phase using the Taylor theory with the RC1323 model and a CRSS ratio of 1.1 were in quite good agreement with the experimentalr-values like single-phase ferritic steels, and it was concluded that the
matrix was dominant in tensile deformation of type 329J4L DSS sheet.
Acknowledgment
One of the authors (J.H) would like to thank Mr. Kazuyuki Agata and Mr. Noriaki Yagi, Nippon Steel & Sumikin Stainless Steel Corp., for the X-ray measurements.
REFERENCES
1) J. Charles: Steel Re.79(2008) 455–465.
2) J.-O. Nilsson: Mater. Sci. Technol.8(1992) 685–700.
3) N. Ono, J. Hamada, I. Muto and T. Komori: CAMP-ISIJ16(2003) 550. 4) G. Fargas, N. Akdut, M. Anglada and A. Mateo: ISIJ Int.48(2008)
1596–1602.
5) J. Hamada and N. Ono: Mater. Trans. submitted.
6) H. Inoue, J. Hamada and T. Goto:Yield strength and microstructure in steels—Results of experiment and simulation—, (ISIJ, Tokyo, 2007) pp. 44–49.
7) W. B. Hutchinson, K. Ushioda and G. Runnsjo¨: Mater. Sci. Technol.1 (1985) 728–731.
8) J. J. Moverare and M. Ode´n: Metall. Mater. Trans. A 33A(2002) 57–71.
9) J. Keichel, J. Foct and G. Gottstein: ISIJ Int.43(2003) 1781–1787. 10) J. Keichel, J. Foct and G. Gottstein: ISIJ Int.43(2003) 1788–1794. 11) T. Maki, T. Furuhara and K. Tsuzaki: ISIJ Int.41(2001) 571–579. 12) T. Maki: Netsu Shori39(1999) 5–11.
13) X. Huang, K. Tsuzaki and T. Maki: Scr. Metall. Mater.33(1995) 341– 346.
14) H. Inoue and N. Inakazu: J. Japan Inst. Metals58(1994) 892–898. 15) H. Inoue and T. Takasugi: Z. Metallkd.92(2001) 82–88.
16) J. Hamada, K. Agata and H. Inoue: Mater. Trans.50(2009) 752–758. 17) G. I. Taylor: J. Inst. Metals62(1938) 307–324.
18) H. Honneff and H. Mecking: Proc. 5th Int. Conf. on Textures of Materials, ed. by G. Gottstein and K. Lu¨cke, (Springer-Verlag, Berlin, 1978, Vol. 1) pp. 265–275.
19) H. Inoue and N. Inakazu: J. Japan Inst. Light Met.44(1994) 97–103. 20) H. Inoue:Recrystallization Textures and Their Application to Structure
Control, (ISIJ, Tokyo, 1999) pp. 174–181.
21) H. Inoue, K. Sekine and T. Hasegawa: Proc. 76th JSME Fall Annual Meeting, (The Japan Society of Mechanical Engineers, 1998) pp. 47– 48.
22) H. Inoue and T. Takasugi: Mater. Trans.48(2007) 2014–2022. 23) D. Daniel and J. J. Jonas: Metall. Trans. A21A(1990) 331–343. 24) R. Schouwenaars, P. Van Houtte, E. Aernoudt, C. Standaert and J.
Dilewijns: ISIJ Int.34(1994) 366–372.
25) H. J. Bunge: Kristall und Technik5(1970) 145–175.
26) H. J. Bunge: Texture Analysis in Materials Science, (Butterworths, London, 1982).
27) T. Sawatani, K. Shimizu, T. Nakayama and M. Miyoshi: Tetsu-to-Hagane´63(1977) 843–854.
28) R. M. Davison: Metall. Trans.5(1974) 2287–2294.
29) T. Sato, Y. Tashiro, Y. Honda, M. Nishida and A. Chiba: ISIJ Int.38 (1998) 640–646.