Correlation between Mineral Intake and Urinary
Excretion in Free-Living Japanese Young Women
Munehiro Yoshida1*, Tsutomu Fukuwatari2, Junya Sakai2, Tomiko Tsuji2,3, Katsumi Shibata2
1
Laboratory of Food and Nutritional Sciences, Faculty of Chemistry, Materials and Bioengineering, Kansai University, Suita, Japan;
2
Laboratory of Food Science and Nutrition, Department of Lifestyle Studies, School of Human Cultures, The University of Shiga Prefecture, Hikone, Japan; 3Department of Health and Nutrition, School of Health and Human Life, Nagoya Bunri University, Ina-zawa, Japan.
Email: *hanmyou4@kansai-u.ac.jp
Received October 8th, 2011; revised November 8th, 2011; accepted November 25th, 2011
ABSTRACT
To clarify whether the urinary excretion of calcium, magnesium, phosphorus, iron, zinc, copper, manganese, selenium and molybdenum can be used as an index of their intake, the association between urinary excretion and intake in free-living individuals was examined. A total of 102 healthy free-living female university dietetics students aged 18 - 33 years voluntarily participated in this study, of which 76 students were eligible for this assessment. All food consumed for four consecutive days was recorded accurately by a weighed food record method. A 24-h urine sample was collected on the fourth day, and the urinary levels of sodium, potassium, calcium, magnesium, phosphorus, iron, zinc, copper, manganese, selenium and molybdenum were measured. Significant correlation between urinary excretion and intake was observed in sodium (r = 0.596, p < 0.001), potassium (r = 0.583, p < 0.001), calcium (r = 0.402, p < 0.001), mag-nesium (r = 0.365, p < 0.01), phosphorus (r = 0.509, p < 0.001), selenium (r = 0.349, p < 0.01) and molybdenum (r = 0.265, p < 0.01). On the other hand, urinary excretion was very low and completely independent of the intake in iron, zinc, copper and manganese. These results indicate that urinary calcium, magnesium, phosphorus, selenium and mo-lybdenum can be used as an index of their intake, similarly to sodium and potassium.
Keywords: Mineral Intake; Trace Elements; Urinary Excretion; Assessment; Japanese Young Women
1. Introduction
To assess the nutritional status of healthy free-living hu-mans, the weighed food record method has been used widely to record the dietary intake and to calculate nu-trient intake [1]. Although this method can provide rela-tively precise information regarding dietary intake com-pared with other dietary assessment [2], substantial effort is required for respondents to complete the dietary re-cords and to weigh all food consumed. This often leads to errors in the records, which reveals the limitation of a weighed food record method in terms of accuracy [3]. Alternatively, other methods using quantitative biologi-cal information, such as urinary excretion, or concentra-tions of nutrient or their metabolites in blood, as bio-markers to assess dietary intake or nutritional status have been well studied in recent years.
Many preceding studies have investigated urinary ex-cretion as a biomarker for assessing dietary intake. For example, 24-h urinary nitrogen is established as a marker for protein intake [4], urinary sugars for sugar intake
[5,6], and urinary thiamine for thiamine intake [7]. As re- gards minerals, urinary potassium is established as a mar- ker for potassium intake [8] and urinary iodine for iodine intake [9] as well as urinary sodium for sodium intake [10,11].
In the present study, we measured sodium, potassium, calcium, magnesium, phosphorus, iron, zinc, copper, man- ganese, selenium and molybdenum in 24-h urine and exa- mined the association between urinary mineral excretion and their intake in free-living individuals. In addition, we examined whether the urinary excretion of calcium, magnesium, phosphorus, iron, zinc, copper, manganese, selenium and molybdenum can be used as an index of their intake, similarly to sodium and potassium.
2. Subjects and Methods
2.1. Subjects
This study was reviewed and approved by the Ethics Committee of The University of Shiga Prefecture. A total of 102 healthy free-living female university dietetics stu- dents aged 18 - 33 years voluntarily participated in this
*
study. The purpose and protocol of this study was ex-plained to all participants before joining the study, and written informed consent was obtained from each par-ticipant, and from parents of participants aged < 20 years. We excluded participants diagnosed with cold or influ-enza, and those who had taken mineral supplements at least once during the previous month. In addition, we excluded participants whose 24-h urine collection or die-tary records were considered as incomplete, with a col-lection time outside the 22 - 26 h range, urine volume < 250 mL, creatinine excretion in relation to body weight outside the 10.8 - 25.2 mg/kg range [12], or extremely low or high energy intake (<500 or >4000 kcal/d). After screening, 76 participants were found to be eligible. An-thropometric profiles of the 76 participants are shown and compared with those of general Japanese young wo- men in Table 1. No difference was observed between subjects and general women.
2.2. Dietary Records
This was a 4-day dietary assessment in which the par-ticipants were living freely at college and consuming their normal diet. The first day (Monday) of the experi-mental period was defined as Day 1, etc. To measure dietary intake during the 4-day period precisely, we used a weighed food record method, which is the highest qual-ity in Japan at this time [13,14]. A digital cooking scale (1 g unit; Tanita Inc., Tokyo, Japan), a set of dietary re-cord forms, a dietary rere-cord manual, and a disposable camera were distributed to the participants in advance. Upon entry of the dietary record, the status of food at oral intake was identified as “raw”, “cooked”, “the pres-ence of skin”, “cooking ingredient”, or “with or without seasoning”, and coded according to the Fifth Revised and Enlarged Edition of the Standard Tables of Food Com-position in Japan [15]. The participants took photographs with a disposable camera of the dish before and after eating. Several experienced dietitians used the photogra- phs to complete the data, and asked the participants to resolve any discrepancies or to obtain further information when needed. The food that remained after eating was measured by a digital scale and was deduced from the dietary record. Food, nutrient and energy intake was cal-culated using the Standard Tables of Food Composition
Table 1. Comparison of anthropometric profiles between subjects and general Japanese young women.
Subjects (n = 76) NHNSJ-20081 (n = 284)
Age Height (cm) Weight (kg)
Body mass index (kg/m2)
20.1 ± 2.3 158.3 ± 5.0
50.8 ± 5.2 20.2 ± 1.7
20 - 29 158.3 ± 5.4
51.9 ± 9.5 20.7 ± 3.6
Values are the means ±SD. 1Values for general Japanese young women aged
20 to 29 years described in the National Health and Nutrition Survey of Japan in 2008.
in Japan. For mineral intake, sodium, potassium, calcium, phosphorus, iron, zinc, copper and manganese were as-sessed. Because selenium and molybdenum are not des- ignated in the Standard Table of Food Composition in Japan, intake of these microminerals was calculated us-ing averaged values of the contents for every food groups described in the literature [16,17].
2.3. 24-h Urine Sampling
A single 24-h urine sample was collected on Day 4 to measure urinary mineral excretion. In the morning, par-ticipants were asked to discard the first specimen and to record the time on the sheet. The next morning, partici-pants were asked to collect the last specimen at the same time as when the specimen had been discarded the pre-vious morning, and to record the time on the sheet. After the urine sample had been collected, the volume of the sample was measured. The urine samples were stored at –20˚C until analysis.
2.4. Measurement of Urinary Minerals
Urine samples were diluted with 9 or more volumes of 0.1 M HNO3 and filtrated through a 0.45-µm-membrane
filter. Filtrate thus obtained was used for the measure-ment of minerals. Sodium, potassium, calcium and mag-nesium were determined by atomic absorption spectro- meter (AA-6300; Shimadzu, Kyoto, Japan). Phosphorus, iron, zinc and copper were determined by inductively coupled plasma-atomic emission spectrometer (ULTIMA2; Horiba Ltd., Kyoto, Japan). Manganese, selenium and molybdenum were determined by inductively coupled plasma-mass spectrometer (ICPM-8500; Shimadzu) us-ing rhodium (for manganese and molybdenum) and tellu-rium (for selenium) as internal standards. In these uri-nalyses, recovery of each mineral adding urine was 97% to 101%.
2.5. Statistical Analysis
For each subject, means of daily nutrient and energy in-take were calculated from the consecutive 4-day dietary records. The mean values of the subjects were calculated based on the resulting individual mean values. Pearson correlation coefficients were calculated to determine the association between urinary and dietary measurements of minerals. These statistical tests were performed using a personal computer (eMac; Apple Computer, Cupertino, CA, USA) with the operating system Mac OS 9.2 and statistical program package StatView-J version 5.0 (Aba- cus Concept, Berkeley, CA).
3. Results and Discussion
Table 2. Daily intake of energy, major nutrients and miner-als of subjects at experimental period.
Subjects1
(n = 76)
NHNSJ-20082
(n = 418)
Energy (kcal) Protein (g) Lipid (g) Carbohydrate (g) Minerals Sodium (mg) Potassium (mg) Calcium (mg) Magnesium (mg) Phosphorus (mg) Iron (mg) Zinc (mg) Copper (mg) Manganese (mg) Selenium (µg) Molybdenum (µg)
1658 ± 302 57.3 ± 11.9 52.8 ± 15.5 232.8 ± 39.8
2923 ± 834 1873 ± 472 503 ± 142 194 ± 53 852 ± 193 6.7 ± 1.9 6.9 ± 1.5 0.90 ± 0.21 2.8 ± 0.8 189 ± 67 272 ± 77
1669 ± 475 61.0 ± 21.4 53.7 ± 22.6 227.3 ± 66.6
3617 ± 1415 3
1886 ± 710 406 ± 205 3
201 ± 70 844 ± 292 6.7 ± 2.7 7.2 ± 2.6 0.98 ± 0.34 -
- -
Values are the means ±SD. 1Daily intake was assessed from the consecutive 4-day dietary records. 2Values for general Japanese young women aged 18
to 29 years described in the National Health and Nutrition Survey of Japan in 2008. 3Significant difference was observed between subjects and general
Japanese young women at p < 0.001 by Student’s t-test.
eligible participants is presented and compared with those of general Japanese young women described in the Na-tional Health and NutriNa-tional Survey of Japan (NHNSJ) [18]. Similarity was observed between the subjects and general Japanese in the intake of energy and macronutri-ents. Among minerals, no difference was observed in po- tassium, magnesium, phosphorus, iron, zinc and copper intake. In addition, manganese and molybdenum intake in the participants was close to the reported values for general Japanese [19,20]. On the other hand, lower so-dium intake and higher calcium intake were observed in the subjects than in general young women. In Japan, be-cause excess intake of sodium and low intake of calcium have been major nutritional problems, dietetics students have received education so that sodium intake is reduced and calcium intake is increased; therefore, it is thought that the subjects made efforts to reduce their sodium in-take and increase their calcium inin-take intentionally. Se-lenium intake in the participants was quite a bit higher than the reported value for general Japanese [16,21]. This indicates that overestimation arose in selenium intake roughly calculated using averaged values of the contents for every food group because no difference was observed between the subjects and general Japanese adolescents in the intake of energy and many nutrients.
Table 3 shows 24-h urinary excretion and the apparent urinary excretion rate of minerals. As regards manganese, since almost all samples showed less than the detection limit (<10 µg/L), it is excluded from the table.
Table 3. Daily urinary mineral excretion in subjects.
Excretion amounts Apparent excretion rate
(mg/d) (%)
Sodium Potassium Calcium Magnesium Phosphorus
2616 ± 1010 1456 ± 498 100.5 ± 36.4 39.9 ± 16.4 660 ± 223
90.7 ± 30.8 79.5 ± 23.0 20.9 ± 8.2 22.4 ± 15.4 79.1 ± 23.8
(µg/d) Iron Zinc Copper Selenium Molybdenum
220 ± 138 374 ± 125 52.5 ± 37.1 84.8 ± 26.6 211 ± 93
3.6 ± 2.5 6.3 ± 2.8 6.3 ± 5.1 49.7 ± 21.3 82.2 ± 44.3
Values are the means ±SD. Apparent excretion rate was calculated as fol-lows: (daily urinary excretion amounts)/(daily intake) × 100.
A high rate of urinary excretion (>70%) was observed for sodium and potassium, which intake has been as- sessed using urine. In addition, phosphorus and molyb-denum also showed a high excretion rate, parallel to so-dium and potassium. Because most phosphorus and mo-lybdenum ingested from food are absorbed in the intes-tine and their main excretion route is urine [20,22], this high excretion rate is valid. Although dietary selenium is also mostly absorbed and its main excretion route is urine [23], the excretion rate was 50%, which was lower than several reported values [24]. This was surely caused by an overestimation of selenium intake; if the excretion rate were 70%, selenium intake would be estimated to be about 120 µg/d, which is almost coincident with the re-ported value for general Japanese [16,21].
The apparent urinary excretion rate of calcium and magnesium was about 20%, which was coincident with the reported value [22,25]. On the other hand, urinary ex- cretion of iron, zinc and copper was very low, which re- flects that urine is not the main excretion route of these minerals [26-28].
Figure 1 shows the correlation between daily intake and 24-h urinary excretion of sodium, potassium, cal-cium, magnesium and phosphorus. Significant correla-tion was observed with all of these five minerals. In par-ticular, a strong correlation (r > 0.5) was observed for sodium, potassium and phosphorus; therefore, in these three minerals, intake could be estimated from the amount of urinary excretion for every individual with high accuracy. Urinary sodium and potassium are already used as im-portant indices of their intake for individuals [10,11]. In addition, urinary phosphorus could also be used as an index of its intake.
[image:3.595.58.287.111.325.2]Figure 1. Correlation between daily intake and urinary ex- cretion of sodium, potassium, calcium, magnesium and pho- sphorus in subjects.
route is urine [22,25]; therefore, urinary excretion of these minerals reflects absorption amounts. Since intestinal ab- sorption of these minerals changes with various factors [29], it may be difficult to estimate the intake of these minerals from the urinary excretion for every individual. Nevertheless, it will be possible to estimate the intake from urinary excretion at least in a group.
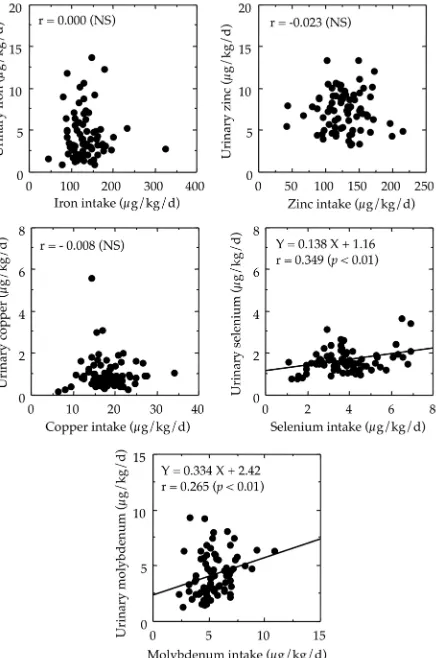
Figure 2 shows correlation between intake and urinary excretion in iron, zinc, copper, selenium and molybde-num. In iron, zinc and copper, the scale is changed be-tween the X- and Y-axis since their excretion rate to urine is very low. In these three minerals, urinary excre-tion was almost completely independent of the intake. Accordingly, intake of these minerals cannot be esti-mated from urinary excretion. In addition, because uri-nary manganese excretion was very low, similarly to iron, zinc and copper, it may be difficult to use urinary man-ganese as an index of manman-ganese intake. Probably, it is the reason that their urinary excretion is constantly low regardless of the intake, since they are bound to protein in blood. In the case of selenium and molybdenum, a significant correlation was observed; however, in spite of having said that a large part of ingested selenium and molybdenum was excreted into urine, similarly to potas
Figure 2. Correlation between intake and urinary excretion of iron, zinc, copper, selenium and molybdenum of subjects.
sium, sodium and phosphorus [20,23], the correlation co-efficients were smaller than those of calcium and magne-sium. Probably, these weak correlations were due to rough intake estimation using averaged values of the contents for every food group; therefore, it is considered that a greater correlation coefficient was obtained when intake was estimated using the content of every food, as for other minerals.
In the present study, it was confirmed that excretion amounts in 24-h urine were good indices of daily intake of phosphorus, calcium, magnesium, selenium and mo-lybdenum similarly to sodium and potassium. In minerals, estimation of the intake using 24-h urine is possible when the main excretion route is urine. To estimate the intake of these minerals from the urinary excretion, the precise regression between intake and urinary excretion needs to be established by a balance test in the future.
4. Acknowledgements
[image:4.595.313.531.86.415.2]REFERENCES
[1] W. Wilett, “Nutritional Epidemiology,” 2nd Edition, Ox- ford University Press, New York, 1998.
[2] S. A. Bingham, C. Gill, A. Welch, A. Cassidy, S. A. Runswick, S. Oakes, R. Lubin, D. I. Thurnham, T. J. Key, L. Roe, K. T. Khaw and N. E. Day, “Validation of Die-tary Assessment Methods in the UK Arm of EPIC Using Weighed Records, and 24-Hour Urinary Nitrogen and Potassium and Serum Vitamin C and Carotenoids as Bio- markers,” International Journal of Epidemiology, Vol. 26, Suppl. 1, 1997, pp. S137-S151.
doi:10.1093/ije/26.suppl_1.S137
[3] M. B. E. Libingstone and A. E. Black, “Markers of the Validity of Reported Energy Intake,” Journal of Nutrition, Vol. 133, Suppl. 3, 2003, pp. 895S-920S.
[4] S. A. Bingham, “Urine Nitrogen as a Biomarker for the Validation of Dietary Protein Intake,” Journal of Nutri-tion, Vol. 133, Suppl. 3, 2003, pp. 921S-924S.
[5] C. Luceri, G. Caderni, M. Lodovici, M. T. Spagnesi, C. Monserrat, L. Lancioni and P. Dolara, “Urinary Excretion of Sucrose and Fructose as a Predictor of Sucrose Intake in Dietary Intervention Studies,” Cancer Epidemiology, Biomarkers and Prevention, Vol. 5, No. 3, 1996, pp. 167- 171.
[6] N. Tasevska, S. A. Runswick, A. A. Welch, A. Mc- Tag-gart and S. A. Bingham, “Urinary Sugars Biomarker Re-lates Better to Extrinsic than to Intrinsic Sugars Intake in a Metabolic Study with Volunteers Consuming Their Normal Diet,” European Journal of Clinical Nutrition, Vol. 63, No. 5, 2009, pp. 653-659.
doi:10.1038/ejcn.2008.21
[7] N. Tasevska, S. A. Runswick, A. McTaggart and S. A. Bingham, “Twenty-Four-Hour Urinary Thiamine as a Biomarker for the Assessment of Thiamine Intake,” Euro- pean Journal of Clinical Nutrition, Vol. 62, No. 9, 2008, pp. 1139-1147. doi:10.1038/sj.ejcn.1602829
[8] N. Tasevska, S. A. Runswick and S. A. Bingham, “Uri-nary Potassium Is as Reliable as Uri“Uri-nary Nitrogen for Use as a Recovery Biomarker in Dietary Studies of Free Liv-ing Individuals,” Journal of Nutrition, Vol. 136, No. 5, 2006, pp. 1334-1340.
[9] D. Ristic-Medic, Z. Piskackova, L. Hooper, J. Ruprich, A. Casgrain, K. Ashton, M. Pavlovic and M. Glibetic, “Me- thods of Assessment of Iodine Status in Humans: A Sys-tematic Review,” American Journal of Clinical Nutrition, Vol. 89, No. 6, 2009, pp. 2052S-2069S.
doi:10.3945/ ajcn.2009. 27230H
[10] L. K. Dahl, “Evidence for an Increased Intake of Sodium in Hypertension Based on Urinary Excretion of Sodium,” Proceedings of Society of Experimental Biology and Me- dicine, Vol. 94, No. 1, 1957, pp. 23-26.
[11] Y. Morinaga, T. Tsuchihashi, Y. Ohta and K. Matsumura, “Salt Intake in 3-Year-Old Japanese Children,” Hyperten-sion Research, Vol. 34, No. 7, 2011, pp. 836-839. doi:10.1038/hr.2011.55
[12] K. Murakami, S. Sasaki, Y. Takahashi, K. Uenishi, T. Watanabe, T. Kohri, M. Yamasaki, R. Watanabe, K. Baba, K. Shibata, T. Takahashi, K. Hayabuchi, K. Ohki and J.
Suzuki, “Sensitivity and Specificity of Published Strate-gies Using Urinary Creatinine to Identify Incomplete 24-h Urine Collection,” Nutrition, Vol. 24, No. 1, 2008, pp. 16-22. doi:10.1016/j.nut.2007.09.001
[13] T. Imai, S. Sasaki, K. Mori, F. Ando, N. Niino and H. Shimokata, “Nutritional Assessment of 3-Day Dietary Records in National Institute for Longevity Science- Longitudinal Study of Aging (NILS-LSA),” Journal of Epidemiology, Vol. 10, Suppl. 1, 2000, pp. S70-S76. doi:10.2188/jea.10.1sup_70
[14] K. Murakami, H. Okubo and S. Sasaki, “Dietary Intake in Relation to Self-Reported Constipation among Japanese Women Aged 18 - 20 Years,” European Journal of Clin-ical Nutrition, Vol. 60, No. 5, 2006, pp. 650-657. doi:10.1038/sj.ejcn.1602365
[15] Ministry of Education, Culture, Sport, Science and Tech-nology of Japan, “Standard Tables of Food Composition in Japan 5th Revised and Enlarged Edition (in Japanese),” National Printing Bureau of Japan, Tokyo, 2007.
[16] Y. Miyazaki, H. Koyama, Y. Sasada, H. Sato, M. Nojiri and S. Suzuki, “Dietary Habits and Selenium Intake of Residents in Mountain and Coastal Communities in Ja-pan,” Journal of Nutritional Science and Vitaminology, Vol. 50, No. 5, 2004, pp. 309-319.
doi:10.3177/jnsv.50.309
[17] H. Hattori, A. Ashida, C. Itô and M. Yoshida, “Determi-nation of Molybdenum in Foods and Human Milk, and an Estimate of Average Molybdenum Intake in the Japanese population,” Journal of Nutritional Science and Vitami-nology, Vol. 50, No. 6, 2004, pp. 404-409.
doi:10.3177/jnsv.50.404
[18] Ministry of Health, Labour and Welfare of Japan, “The National Health and Nutrition Survey in Japan, 2008 (in Japanese),” Dai-Ichi Shuppan, Tokyo, 2011.
[19] S. Horiguchi, K. Teramoto, T. Kurono and K. Ninomiya, “The Arsenic, Copper, Lead, Manganese and Zinc Con-tents of Daily Foods and Beverages in Japan and the Es-timate of Their Daily Intake,” Osaka City Medical Jour-nal, Vol. 24, No. 1, 1978, pp. 131-141.
[20] M. Yoshida, H. Hattori, S. Ota, K. Yoshihara, N. Kodama, Y. Yoshitake and M. Nishimuta, “Molybdenum Balance in Healthy Young Japanese Women,” Journal of Trace Elements in Medicine and Biology, Vol. 20, No. 4, 2006, pp. 245-252. doi:10.1016/j.jtemb.2006.07.004
[21] M. Yoshida and K. Yasumoto, “Selenium Content of Rice Grown at Various Sites in Japan,” Journal of Food Com-position and Analysis, Vol. 1, No. 1, 1987, pp. 71-75. doi:10.1016/0889-1575(87)90013-5
[22] M. Nishimuta, N. Kodama, E. Morikuni, Y. H. Yoshioka, H. Takeyama, H. Yamada, H. Kitajima and K. Suzuki, “Balances of Calcium, Magnesium and Phosphorus in Ja- panese Young Adults,” Journal of Nutritional Science and Vitaminology, Vol. 50, No. 1, 2004, pp. 19-25. doi:10.3177/jnsv.50.19
1983, pp. 169-180.
[24] H. J. Robbrecht and H. A. Deelstra, “Selenium in Human Urine: Concentration Levels and Medical Implications,” Clinica Chimica Acta, Vol. 136, No. 2-3, 1984, pp. 107- 120. doi:10.1016/0009-8981(84)90282-1
[25] N. M. Lewis, M. S. Marcus, A. R. Behling and J. L. Gre-ger, “Calcium Supplements and Milk: Effects on Acid- Base Balance and on Retention of Calcium, Magnesium, and Phosphorus,” American Journal of Clinical Nutrition, Vol. 49, No. 3, 1989, pp. 527-533.
[26] Food and Nutrition Board Institute of Medicine, “Iron,” Dietary Reference Intakes for Vitamin A, Vitamin K, Ar-senic, Boron, Chromium, Copper, Iodine, Iron, Manga-nese, Molybdenum, Nickel, Silicon, Vanadium, and Zinc,
National Academy Press, Washington DC, 2001, pp. 290- 393.
[27] J. R. Turnlund, “Copper,” In: M. E. Shils, J. A. Olson, M. Shike and A. C. Ross, Eds., Modern Nutrition in Health and Disease, 9th Edition, Wikkiams & Wilkins, Balti-more, 1999, pp. 241-252.
[28] J. C. King and C. L. Keen, “Zinc,” In: M. E. Shils, J. A. Olson, M. Shike and A. C. Ross, Eds., Modern Nutrition in Health and Disease, 9th Edition, Wikkiams & Wilkins, Baltimore, 1999, pp. 223-239.