ISSN Online: 2164-5175 ISSN Print: 2164-5167
DOI: 10.4236/ajibm.2018.810139 Oct. 22, 2018 2102 American Journal of Industrial and Business Management
Does the Central Government’s Anti-Corruption
Campaign Have an Impact on Corporate Cost
Stickiness?
Shimin Wang
School of Management, Jinan University, Guangzhou, China
Abstract
This paper starts with the anti-corruption campaign of the 18th National Congress of the Communist Party of China (CPC), adopts the empirical me-thod to study whether and how the anti-corruption campaign of the central government influences the cost stickiness of enterprises. And the paper fur-ther studies whefur-ther the anti-corruption campaign has different impacts on enterprises with different property rights. The results show that the cost stickiness of listed companies decreases significantly after the anti-corruption campaign. Compared with non-state-owned enterprises, the cost stickiness of state-owned enterprises weakened less after the anti-corruption campaign started. The research results of this paper show that anti-corruption can re-strain the rent-seeking behavior of enterprises and make them apply more resources to normal production and operation activities.
Keywords
Anti-Corruption, Cost Stickiness, Property Rights
1. Introduction
China has entered the fundamental transformation stage of economic growth since 2012, bidding farewell to the high-speed growth that has lasted for more than 30 years. In the new normal of the China’s economy, enterprises are faced with the dual pressure of slowing down the growth rate and structural transfor-mation. It is of great significance for enterprises to improve efficiency, regulate the use of expenses, and improve cost efficiency, so as to save internal costs.
Existing studies have shown that political affiliation and core competence are two means for Chinese enterprises to gain competitive advantage in the context
How to cite this paper: Wang, S.M. (2018) Does the Central Government’s Anti-Corruption Campaign Have an
Im-pact on Corporate Cost Stickiness?
Ameri-can Journal of Industrial and Business Management, 8, 2102-2119.
https://doi.org/10.4236/ajibm.2018.810139
Received: September 10, 2018 Accepted: October 19, 2018 Published: October 22, 2018
Copyright © 2018 by author and Scientific Research Publishing Inc. This work is licensed under the Creative Commons Attribution International License (CC BY 4.0).
DOI: 10.4236/ajibm.2018.810139 2103 American Journal of Industrial and Business Management of transformation. Companies and executives expend a lot of energy and re-sources to build and maintain special political connections [1]. The positive ef-fect of establishing such political connection can increase enterprise value and improve enterprise performance. However, the negative effects cannot be ig-nored, which will not only increase the unnecessary costs of enterprises (Liang Laixin, Feng Yanchao, 2010), but also may lead to the positive effects of rent-seeking behaviors of enterprises to further expand political connections.
The 18th National Congress of the Communist Party of China (CPC) has paid great attention to corruption. After the 18th national congress, a new round of leaders came to power and launched a continuous crackdown on corruption, aiming to build a clean government and regulate the relationship between gov-ernment and enterprises [2]. The anti-corruption campaign has cracked down on the political ties between enterprises and the government established through rent-seeking, greatly blocking the rent-seeking channels of enterprises, thus re-ducing their resources for rent-seeking activities. Such resource input is often included in the cost of the enterprise in the form of expenses, resulting in an in-crease in the proportion of non-production costs. This kind of cost structure will show that enterprise cost stickiness is higher. Therefore, from the perspective of enterprises, this paper will take the data of China’s A-share listed companies from 1994 to 2015 as the sample to test whether and what impact the anti-graft actions of the 18th CPC national congress have on the stickiness of enterprise sales and management expenses.
2. Literature Review and Research Hypothesis
2.1. Cost Stickiness and Influencing Factors
The traditional cost accounting model divides the cost into fixed costs and vari-able costs, among which the relation between varivari-able costs and cost drivers is a simple linear relation, that is, the two change in proportion. Noreen and So-derstorm (1994) [3] identified for the first time that recurrent costs are not pro-portional to the level of business activity.
After that, Anderson M C, Banker R D, Janakiraman S. N. (2003) [4] The concept of “cost stickiness” was first proposed. Using the Compustat database developed by the center for securities price research at the University of Chicago, they found that the cost of sales, management and operating costs of listed companies in the United States were asymmetric by looking at the annual data of listed companies in the United States from 1979 to 1998. When business volume decreases 1%, the cost decreases only 0.35%. They also identified management’s willingness to be the main cause of cost stickiness.
After that, some scholars conducted further research on cost stickiness from different perspectives:
in-DOI: 10.4236/ajibm.2018.810139 2104 American Journal of Industrial and Business Management dustries and speculated that the cost stickiness of manufacturing industry was the highest. Balakrishnan and Gurca (2008) found that the cost stickiness of the company’s core business unit was the highest; Calleja et al. (2006) compared the cost stickiness between different countries.
Moreover, scholars focus on the determinants of cost stickiness: the study by Banker et al. (2012) found that cost stickiness could reflect the subjective choice of management for direct production resources (human input). Balakrishnan et al. (2010) found that fixity and diseconomies of scale are the causes of cost stickiness. In addition, a large number of studies have found that subjective de-cisions of managers, optimistic degree of management, technical restrictions, staff intensity, enterprise capital intensity, economic growth, adjustment cost, agency problems and other factors that lead to cost stickiness [5].
The economic consequences of cost stickiness are also concerned by scholars. Dierynck et al. (2012) found that companies with weak cost stickiness tend to conduct earnings management more. Banker and Chen (2006b) found that cost habits have higher information content when predicting enterprise accounting surplus; Anderson et al. (2007) believed that when the current sales volume of an enterprise declines and the manager expects the future sales volume of the en-terprise to increase, the cost stickiness conveys the positive information of the change of the enterprise’s future accounting surplus, that is, the manager expects the accounting surplus of the enterprise to increase in the future. Weiss (2010) found that when business volume declines, the existence of cost stickiness in-creases the difficulty of accurately predicting the accounting surplus of enter-prises.
Domestic studies have found similar results: Sun Zheng and Liu Hao (2004) [6] studied the “stickiness” behavior of the operating expenses and management expenses of Chinese listed companies, and concludes that the cost and expense of listed companies are not symmetrical to the change of business volume. The following studies conducted empirical tests on the cost stickiness of China’s listed companies from the aspects of company characteristics, industry differ-ences and regional differdiffer-ences (Liu Wu, 2006, Chen Canping, 2008, Liu Yanwen and Wang Yugang, 2009). Kong Yusheng et al. (2007) studied the cost stickiness and extended it to the operating cost, and found that the operating cost of Chi-na’s listed companies also had the problem of stickiness [7]. Che Ximei and ChenXuan (2013) studied the influence of management’s self-interested beha-vior on cost stickiness. Cao Xiaoxue et al. (2009) studied the impact of the inte-rim measures on the performance assessment of central enterprise executives on the cost stickiness of central enterprises in China [8].
DOI: 10.4236/ajibm.2018.810139 2105 American Journal of Industrial and Business Management Managers expected with other factors: Li Bingcheng (2016), such as Jiang Wanying (2015) combining macroeconomic volatility expectations with man-agement, research shows that enterprise cost stickiness degree are negatively re-lated with macroeconomic growth and found that managers expected in the macroeconomic fluctuations for micro enterprise expenses had conduction ef-fect in the process of viscous efef-fects [9] [10]. He Dengjiao (2017) studied the impact of overconfidence of managers on cost stickiness in enterprises in differ-ent life cycles, and found that the cost stickiness of differ-enterprises in growth period had the largest impact, while the cost stickiness in recession period had the least impact. Zhou Bing (2016) studied the impact of enterprise strategy and manager expectation on cost stickiness, and found that management expectation would adjust the relationship between enterprise strategy and cost stickiness.
Agency problem: Liu Huilong et al. (2017) studied the difference and cause of cost stickiness among different levels of companies in pyramid group, and found that the higher the number of levels from the final control, the higher the cost stickiness. Liang Shangkun (2017) found that media attention has a significant inhibiting effect on the company’s expense stickiness. The higher the media at-tention, the lower the company’s expense stickiness. A series of studies have found that upward earnings management has a positive impact on the stickiness of corporate expenses, while downward earnings management reduces the stickiness of corporate expenses (Zhang Zhiping, Liu Miao, 2017; Jiang Wei et al., 2015). In addition, on corporate governance (Xie Huobo, Hui Lili, 2104; Wan Shouyi, Wang Hongjun, 2011) and management characteristics (Wu Xiaoru, Han Jing, Liu Zihan, 2015; Jiang Wei and Yao Wentao, 2015) on the degree of cost stickiness are also abundant [11] [12].
Studies on the “adjustment cost theory” to explain the influence factors of cost viscosity mostly focus on the impact of corporate financing constraints on cost viscosity. The study found that the stronger corporate financing constraints are, the weaker cost viscosity is (Zhang Danwei, 2017; Liang Shangkun, Zhang Mengting, 2015; Jiang Wei, Hu Yuming, Zeng Yeqin, 2015). In addition, Jiang Wei et al. (2016) studied the implementation of the minimum wage regulations and cost stickiness, and found that the implementation of the minimum wage regulations reduced the cost stickiness of the company [13].
DOI: 10.4236/ajibm.2018.810139 2106 American Journal of Industrial and Business Management executive compensation is negatively correlated with the level of enterprise cost stickiness, that is, higher executive compensation will reduce the level of enter-prise cost stickiness. Mao Hongtao, Li Ziyang and Cheng Jun (2015) studied the impact of the non-economic driver of social cost on the cost stickiness of enter-prises. They found that the non-economic driver can indeed lead to the cost be-havior of enterprises with more social costs, and the degree of cost stickiness is significantly higher.
Research on the economic consequences of cost stickiness: Xie Huobao and Hui Lili (2017) examined the impact of cost stickiness on the sensitivity of ex-ecutive compensation performance, and the study found that cost stickiness sig-nificantly reduced the sensitivity of executive compensation performance. Hu Huaxia et al. (2017) tested the relationship between cost stickiness and R & D innovation input by taking R & D innovation input as the entry point, and found that cost stickiness has a positive impact on enterprise R & D innovation input. Xiao Zhengrong, Zhang Chutang (2017) and Ge Yao (2017) all showed that cost stickiness can improve enterprise performance to some extent [14].
2.2. Corruption and Political Connection
The widely accepted definition of corruption is “government officials sell gov-ernment property for personal benefit” (Shleifer and Vishny, 1993), and a simi-lar is” abuse of public power for private interests” (Svensson, 2005) [15] [16]. In 2013, Banerjee et al. proposed the definition of “an official breaks the rules for private interests” to avoid the influence of subjective moral judgment on the de-finition of corruption. Specifically, corruption involves officials soliciting bribes from enterprises, and enterprises actively or passively offer bribes to officials [17].
The existing literature on the impact of corruption on economic efficiency is mainly divided into two categories. One is that corruption promotes economic efficiency, the “helping hand”. Another is that corruption impedes economic ef-ficiency, the “predatory hand”. However, the literature in recent years has found that corruption has different effects under different institutional backgrounds, different ownership backgrounds of enterprises and its own degree.
DOI: 10.4236/ajibm.2018.810139 2107 American Journal of Industrial and Business Management Nie Huihua, 2017) explained the causes of corruption. From the analysis of agency theory, it can be seen that to solve the agency problem, a more perfect supervision mechanism and incentive mechanism should be established to im-prove information transparency (Yang Deming, Zhao Can, 2014) [19] [20] [21]. From the perspective of rent-seeking theory, reducing government’s interven-tion in the economy and enterprises and increasing market competiinterven-tion will al-leviate the harm of corruption.
In fact, the corruption of most government officials involves enterprises (Klitgaard, 1998). On the one hand, some scholars believe that moderate corrup-tion is the lubricant of economy (Jiang & Nie, 2014) [22] [23]. The positive im-pact of corruption is mainly reflected in the significant positive correlation be-tween bribery and enterprise growth (Li Liyu, Huang Yufeng, 2010; Wang & You, 2012; Ayaydin, 2014; Mironov, 2015) and corruption can increase enter-prise r & d costs (Li Houjian and Zhang Zongyi, 2014) and enable enterenter-prises to obtain more orders and start up opportunities (Huang Jiuli and Li Kunwang, 2013; Wei Xihai, 2015) [24] [25] and conducive to the play of entrepreneurship (Yan Weimin, 2015) [26]. On the other hand, most scholars believe that corrup-tion has a negative effect on economic growth and enterprise efficiency (Leff, 1964; Jiang and Nie, 2014). According to research conducted by Nguyen et al.
(2012), bribery has different impacts on enterprises with different property rights. It will hinder the development of private enterprises, but has little impact on state-owned enterprises. Corruption also reduces enterprise value, profitabil-ity and asset utilization (Garmaise et al., 2005; Xu Xixiong et al., 2017) [20] [27]. Liu Jin and Wang Xuejun (2015) found that corruption reduced the export of enterprises. The reason is that corruption is also one of the manifestations of so-cial and economic distortion, which cannot fundamentally solve the problem of resource allocation distortion and improve efficiency. At the same time, the effi-ciency of corruption cannot be guaranteed and may not be optimized. Finally, corruption will reduce the efficiency of the government, aggravate the burden of enterprise operation, and finally hinder economic development (Zhou Li’an and Tao Jing, 2009) [18].
ex-DOI: 10.4236/ajibm.2018.810139 2108 American Journal of Industrial and Business Management tensive and serious, but at the same time in an objective perspective to promote economic development. However, as Wei Xiahai (2015) pointed out, although the research results show that rent-seeking enterprises do get more opportunities to start work and their development status is better, the conclusion that “tion promotes economic development” cannot be drawn. If there is no corrup-tion, enterprises can put the rent-seeking resources into production and opera-tion, and they will achieve better development. Relying on rent-seeking in ex-change for resources or orders is simply a choice companies are forced to make in the face of a distorted external environment.
2.3. Anti-Corruption and Cost Stickiness
Existing studies have suggested that in the current period of China’s social and economic transformation, enterprises can gain competitive advantages by building their core competence, or achieve the same goal by establishing political connections. If the latter is chosen, the enterprise is bound to need to use its li-mited resources to establish and maintain political and business relations. Such expenditure is often reflected in various entertainment expenses, which are in-cluded in sales expenses and administrative expenses.
As the anti-corruption campaign continues, it reduces the rent-seeking and collusive space for political connections, makes it more difficult for enterprises to establish and maintain the relationship between government and enterprises, thus inhibits the motivation of enterprises to conduct political rent-seeking, and reduces the unreasonable expenses of enterprises due to relying on administra-tive resource allocation and administraadministra-tive monopoly. Therefore, the impact of the anti-corruption campaign on enterprises may be reflected in the changes in enterprises’ costs and expenses.
In the background of this study, the anti-corruption activities will reduce the unreasonable entertainment costs of enterprises, and there is no direct propor-tion between these costs and the business volume of enterprises. This kind of entertainment expense even exists in the company’s sales expense or manage-ment expense for a long time as a large fixed item, which increases the stickiness of the company’s sales expense and management expense. So the stickiness of sales and administrative expenses should be weakened after the anti-corruption campaign.
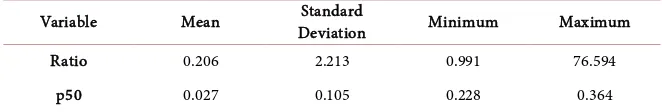
DOI: 10.4236/ajibm.2018.810139 2109 American Journal of Industrial and Business Management Table 1. Rate of change of entertainment expenses before and after anti-corruption for listed companies.
Variable Mean Deviation Standard Minimum Maximum
Ratio 0.206 2.213 0.991 76.594
p50 0.027 0.105 0.228 0.364
Data source: CSMAR database. The values in the table are the author’s own calculation results.
is 0.0266, that is, the entertainment expense before the 18th national congress of the CPC (2012) is 2.66% higher than that after the 18th national congress of the CPC (2013), while the maximum value of p50 (mining) is as high as 36.35%, and the minimum value (scientific research and technical service industry) is −22.79%. The apparent difference between the two shows the extent to which different industries are affected by the anti-corruption campaign.
Due to the reduction of some of the fixed entertainment expenses in the orig-inal sales and management costs, the relationship between sales and manage-ment costs and the company’s normal production and operation activities will be clearer. As a result, the change could make the stickiness of sales and admin-istrative expenses less likely after the start of the anti-graft campaign at the 18th national congress of the communist party of China. Therefore, the first hypothe-sis of this paper is proposed:
H1: After the 18th national congress, the stickiness of sales and administrative expenses of listed companies weakened due to anti-corruption measures.
As mentioned above, there is a certain link between corruption and enterprise ownership in China. Although anti-corruption action can make it more difficult to establish and maintain the relationship between government and enterprises, it cannot eliminate the natural relationship between state-owned enterprises and the government. Therefore, we can speculate that the anti-corruption action has different impacts on state-owned enterprises and private enterprises [29]. Therefore, the second hypothesis of this paper is proposed:
H2: after the anti-corruption campaign, the stickiness of the sales and manage-ment expenses of state-owned enterprises is greater than that of non-state-owned enterprises.
3. Research Design
3.1. Data Sources
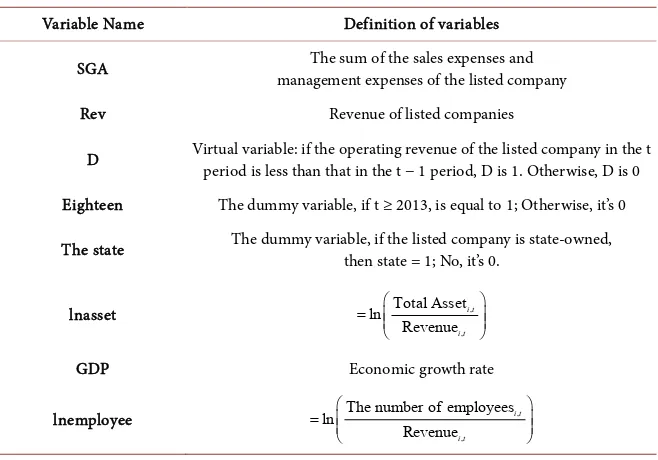
DOI: 10.4236/ajibm.2018.810139 2110 American Journal of Industrial and Business Management Table 2. Variable definition.
Variable Name Definition of variables
SGA management expenses of the listed company The sum of the sales expenses and
Rev Revenue of listed companies
D Virtual variable: if the operating revenue of the listed company in the t period is less than that in the t − 1 period, D is 1. Otherwise, D is 0
Eighteen The dummy variable, if t ≥ 2013, is equal to 1; Otherwise, it’s 0
The state The dummy variable, if the listed company is state-owned, then state = 1; No, it’s 0.
lnasset ,
,
Total Asset ln
Revenue
i t
i t
=
GDP Economic growth rate
lnemployee ,
,
The number of employees ln
Revenue
i t
i t
=
This paper mainly studies the anti-corruption whether and how to influence the cost of enterprise viscosity, be explained variables for the sales and customers management fees (SGA), the change of explanatory variables for operating in-come (Rev), anti-corruption efforts (anticorrupt), the nature of the property rights of listed companies (state). Based on the relevant research results of ABJ (2003), Kama, Weiss, et al. (2010) [8], the following control variables are intro-duced in this paper: (2) Employee intensity (lnemployee), expressed as the ratio of the number of employees to the operating income. (3) Economic growth rate (GDP), expressed in terms of China’s GDP growth rate in each year. (4) Industry and year. According to the industry classification standard of China securities regulatory commission in 2012, all the observed values are divided into 16 in-dustries (excluding the financial industry), and the manufacturing industry is divided into 29 categories according to the secondary industry code, a total of 43 industry virtual variables. Sales and management expenses (SGA), business come (Rev), enterprise total assets (state), number of employees (employee), in-dustry and year all come from csmar database, and economic growth rate (GDP) comes from national bureau of statistics website.
Through the analysis and calculation of the selected and sorted data of oper-ating income and sales and management expenses, the following statistical table of its volatility is obtained.
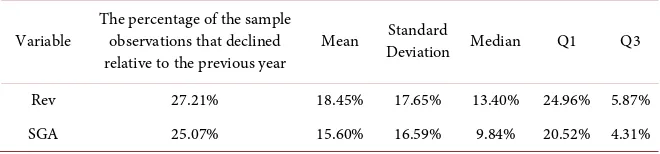
DOI: 10.4236/ajibm.2018.810139 2111 American Journal of Industrial and Business Management Table 3. Descriptive statistics of operating income and fluctuations in sales and management expenses.
Variable The percentage of the sample observations that declined
relative to the previous year Mean
Standard
Deviation Median Q1 Q3
Rev 27.21% 18.45% 17.65% 13.40% 24.96% 5.87%
SGA 25.07% 15.60% 16.59% 9.84% 20.52% 4.31%
Data source: CSMAR database. The results in the table are calculated by the author.
between the operating income fluctuation range of each sample observation. In terms of sales and management expenses, 25.07% of the sample observation val-ues showed a decline, which was 2.14% lower than the decline of operating in-come. The mean decline in sales and management expenses was also 2.85 per cent lower than the mean decline in operating income. This phenomenon in-itially shows that the decline of sales and management expenses is not in sync with the decline of operating revenue, and the decline of sales and management expenses is even less, indicating that cost stickiness does exist.
3.2. Models and Variables
This paper mainly studies whether and how the anti-graft actions of the 18th na-tional congress of the communist party of China (CPC) affect the cost stickiness of enterprises, explained by changes in sales and management expenses (SGA), explained by changes in operating income (Rev), whether the 18th national con-gress of the communist party of China has been held, and the nature of property rights of listed companies. According to ABJ (2003), Kama and Weiss et al.
DOI: 10.4236/ajibm.2018.810139 2112 American Journal of Industrial and Business Management This paper adopts the methods adopted by previous studies (ABJ, 2003; Jiang Wei and Yao Wentao, 2015; Jiang Wei , Yao Wentao and Hu Yuming 2016) and adopts the following logarithmic model (1) and model (2) to test the change of cost viscosity of China’s listed companies before and after the 18th CPC national congress [4] [11] [12].
Model (1):
, , ,
1 2
, 1 , 1 , 1
, 3 , 1 , 4 , , 1 6 1 , 5 7 Re Re ln ln Re Re Re eighteen ln Re Re
eighteen+ ln lnasset
Re Re n n l l Re
i t i t i t
i t i t i t
i t i t i t i t i t i t
SGA v v
D
SGA v v
v D D v v v v D v D
α β β
β
β β β
β − − − − − − + + ∗ + ∗ ∗ + ∗ = + ∗ + ∗ 21 65 ,
8 8 22 ,
, 1
lnemployee
Re
ln industry year
Re i t i t i t v D gdp v
β β β ε
− ∗ + ∗ ∗ + + +
∑
∑
Among them:i—the company i;
t—in the year of t.
α + β1: when the sales revenue of t period is higher than that of t − 1 period,
the sales revenue changes 1%, and the change range of the sum of sales expenses and management expenses.
α + β1 + β2: when the sales revenue of t period is lower than that of t − 1
pe-riod, and t belongs to the range before the 18th CPC national congress, the sales revenue changes 1%, and the sum of sales expenses and management expenses changes. β2 means the degree of cost stickiness in this case.
α + β1 + β2 + β3: when the sales revenue of t period is lower than that of t − 1
period, and t belongs to the change range after the 18th CPC national congress, the sales revenue changes 1%, and the sum of sales expenses and management expenses changes. β2 + β3 means the degree of cost stickiness in this case.
If H1 is true, expect the β3 > 0.
Model (2):
, , ,
1 2
, 1 , 1 , 1
, 3 , 1 , 4 , 1
4 5 6 7
Re Re ln ln Re Re Re eighteen ln Re Re
eighteen state ln
Re
Re
eighteen state ln
ln i t i t i t
i t i t i t
i t
i t
i t
i t
i
SGA v v
D
SGA v v
v D v v D v v D D
α β β
β
β
β β β β
DOI: 10.4236/ajibm.2018.810139 2113 American Journal of Industrial and Business Management
, ,
8 9
, 1 , 1
23 67
,
10 24
Re Re
ln lnemployee ln
Re Re
industry year
i t i t
i t i t
i t
v v
D D
v v
gdp
β
β
β
β
ε
− −
+ ∗ ∗ + ∗
× +
∑
+∑
+where, i, t, α + β1, α + β1 + β2, α + β1 + β2 + β3 are all consistent with the
defini-tion in model (1). α + β1 + β2 + β3 + β4 refers to the change range of the sum of
sales expenses and management expenses of state-owned enterprises after the sales revenue of t period declines compared with that of t − 1 period and t be-longs to the 18th CPC national congress. If H2 is true, expect the β4 < 0.
4. Empirical Results and Discussion
4.1. Descriptive Statistics
It can be seen from Table 4 that the average ratio of sales expenses and man-agement expenses to operating income of the sample companies is 16.13%. The difference between the upper and lower quartile is very obvious, indicating that there is a large gap between the sales expenses and management expenses of dif-ferent companies. Large differences in the ratio of sales and management ex-penses to operating income between different samples are likely due to the dif-ferent industries of difdif-ferent companies, the business activities they engage in, the capital intensity of the company, the degree of labor intensity and the nature of property rights. Based on these differences, the management of the company will have different ideas and methods of cost management and control, which will lead to different degrees of cost stickiness between companies.
The descriptive statistics of the principal variables are shown in Table 5, from which it can be seen that about 29.1% of the observed values belong to the situa-tion experiencing a decline in operating income. About 33% of the observasitua-tions were in the year after the 18th national congress. About 47 percent of those ob-servations were in state-owned enterprises. The mean value of the explained va-riable (lnSGA) is 0.140, the minimum value is −3.695 and the maximum value is 4.229. The mean value of explanatory variable (lnRev) is 0.123, the minimum value is −12.041, and the maximum value is 11.810. This is consistent with the large differences between the sample observations shown in the descriptive sta-tistics of operating income and fluctuations in sales and management expenses in the preceding table.
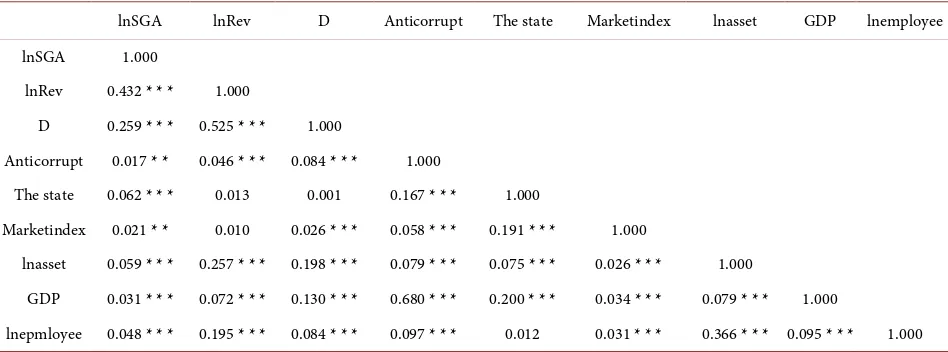
The results of the correlation analysis of the main variables are listed in Table 5. It can be seen from Table 6 that each explanatory variable has a significant correlation with the explained variable lnSGA. However, as the explained varia-ble lnSGA reflects the variation range of sales and management expenses, it does not directly represent cost stickiness, so it needs to be analyzed according to the specific setting of the model.
4.2. OLS Regression Analysis
DOI: 10.4236/ajibm.2018.810139 2114 American Journal of Industrial and Business Management model (1) in the first column shows that the estimated parameter of variable
lnRev is 0.414, and the cross-multiplication term D times , , 1
Re ln
Re
i t
i t v
v −
the
[image:13.595.209.540.209.298.2]estimated parameter value of is −0.288, and both are greater than 0 at the signi-ficance level of 1%, indicating that when the operating income of the enterprise increases by 1%, the sales expenses and management expenses increase by 0.414%. However, when the operating revenue drops 1%, the sales expenses and
Table 4. Distribution of major variables.
Variable Mean Deviation Standard Median Q1 Q3
Rev (million) 4140 10700 1360 14.1 176000
SGA (millions) 381 804 171 4.89 16700
Re
SGA
[image:13.595.212.539.330.504.2]v 16.13% 12.19% 12.95% 0.03% 93.39%
Table 5. Descriptive statistics.
Variable Mean Deviation Standard Minimum Maximum
lnSGA 0.140 0.347 3.695 4.229
lnRev 0.123 0.458 12.041 11.810
D 0.291 0.454 0 1
Anticorrupt 0.331 0.471 0 1
The state 0.471 0.499 0 1
Marketindex 7.878 1.842 0.62 9.78
lnasset 0.631 0.745 2.435 13.577
GDP 9.254 2.020 6.900 14.200
lnemployee 13.525 1.070 19.013 0.435
Table 6. Pearson correlation analysis of research variables.
lnSGA lnRev D Anticorrupt The state Marketindex lnasset GDP lnemployee
lnSGA 1.000
lnRev 0.432 * * * 1.000
D 0.259 * * * 0.525 * * * 1.000
Anticorrupt 0.017 * * 0.046 * * * 0.084 * * * 1.000
The state 0.062 * * * 0.013 0.001 0.167 * * * 1.000
Marketindex 0.021 * * 0.010 0.026 * * * 0.058 * * * 0.191 * * * 1.000
lnasset 0.059 * * * 0.257 * * * 0.198 * * * 0.079 * * * 0.075 * * * 0.026 * * * 1.000
GDP 0.031 * * * 0.072 * * * 0.130 * * * 0.680 * * * 0.200 * * * 0.034 * * * 0.079 * * * 1.000
lnepmloyee 0.048 * * * 0.195 * * * 0.084 * * * 0.097 * * * 0.012 0.031 * * * 0.366 * * * 0.095 * * * 1.000
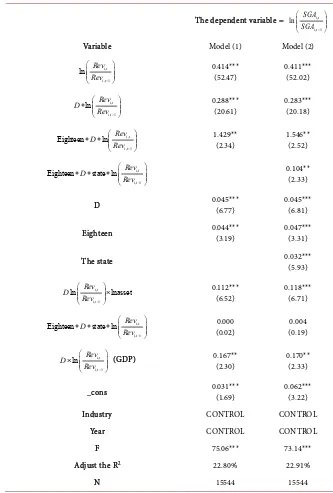
[image:13.595.61.535.535.711.2]DOI: 10.4236/ajibm.2018.810139 2115 American Journal of Industrial and Business Management Table 7. Analysis of anti-corruption action on cost stickiness based on Model (1) and Model (2).
The dependent variable = ,
, 1
ln i t i t SGA SGA−
Variable Model (1) Model (2)
, , 1
ln i t i t Rev Rev− 0.414***
(52.47) 0.411*** (52.02)
, , 1
ln i t i t D Rev Rev− ∗ 0.288***
(20.61) 0.283*** (20.18)
, , 1
Eighteen ln i t i t Rev Rev D − ∗
∗ 1.429**
(2.34) 1.546** (2.52)
, , 1
Eighteen state ln i t i t Re D v Rev− ∗ ∗
∗ 0.104**
(2.33)
D 0.045*** (6.77) 0.045*** (6.81)
Eighteen 0.044*** (3.19) 0.047*** (3.31)
The state 0.032*** (5.93)
, , 1
ln i t lnasset
i t D Rev Rev− × 0.112***
(6.52) 0.118*** (6.71)
, , 1
Eighteen state ln i t i t Re D v Rev− ∗ ∗
∗ 0.000
(0.02) (0.19) 0.004
, , 1
ln i t i t
D Rev
Rev−
×
(GDP)
0.167**
(2.30) 0.170** (2.33)
_cons 0.031*** (1.69) 0.062*** (3.22)
Industry CONTROL CONTROL
Year CONTROL CONTROL
F 75.06*** 73.14***
Adjust the R2 22.80% 22.91%
N 15544 15544
Note: ***, ** and * indicate the significance level of 1%, 5% and 10% respectively.
management expenses only drop 0.126%, which proves that the sales expenses and management expenses of China’s listed companies do have stickiness, which is related to ABJ (2003), Chen Lei, Sun Zheng (2004) and Kong Yusheng (2007) [15]. The existing research results are consistent.
Pay by item ,
, 1 Re eighteen ln Re i t i t v D v − ∗
∗ is estimated to be 1.429 and is greater
[image:14.595.204.537.98.591.2]DOI: 10.4236/ajibm.2018.810139 2116 American Journal of Industrial and Business Management and management expenses of listed companies has weakened since 2013 (the second year of the 18th national congress of the communist party of China), and there is anti-stickiness. After the 18th national congress of the communist party of China, the enterprise increased the extent of the decrease of sales and man-agement expenses when operating revenue declined. This result can prove that the anti-corruption campaign carried out after the 18th national congress has significantly promoted the decline of the stickiness of the sales management expenses of listed companies, which supports the H1 proposed in this paper. In addition, the phenomenon of anti-stickiness of enterprise costs may also indicate the huge amount of non-productive costs and expenses which are in-cluded in sales and management expenses. Because normal productive costs will not change significantly as a result of the anti-corruption campaign, the larger changes should be the part of the costs used to establish and maintain the rela-tionship with officials. However, the degree of intimacy between enterprises and government officials varies, so does the difficulty and cost of establishing and maintaining a relationship between enterprises and government officials. The amount of non-production expenses used by enterprises with different property rights and the proportion of the total sales and management expenses of enter-prises are different, which should be reflected in the difference of cost stickiness between enterprises in the end. This is also the question to be explored by the second hypothesis proposed in this paper.
The results of model (1) in the second column show that the estimated values and significance level of other parameters are basically consistent with the results
of model (1) ,
, 1
ln i t
i t Rev
Rev −
is estimated to be −0.104 and significant at the 5%
level. That is, under other conditions consistent, the change range of sales and management expenses of state-owned enterprises is 0.104 percent smaller than that of non-state-owned enterprises. The results show that after the an-ti-corruption campaign, the stickiness of the sales and management expenses of state-owned enterprises is greater than that of non-state-owned enterprises, and the state-owned enterprises are less affected by the anti-corruption campaign of the 18th CPC national congress, which is consistent with the H2. This result can prove that state-owned enterprises have a natural and close relationship with the government, which is less difficult and costly to establish and maintain the rela-tionship with officials than non-state-owned enterprises. Non-state-owned en-terprises, on the other hand, need to spend more costs to establish and maintain relationships with officials, resulting in increased cost stickiness of enterprises.
4.3. Robustness
DOI: 10.4236/ajibm.2018.810139 2117 American Journal of Industrial and Business Management After the mixed regression and panel data regression, the results obtained ac-cording to the model established in this paper are consistent, indicating that the conclusions obtained in this paper are highly reliable. Anti-corruption activities can indeed reduce the cost stickiness of enterprises; for enterprises with different property rights, anti-corruption has different weakening effects on the cost stickiness of enterprises, and the cost stickiness of non-state-owned enterprises is weakened more significantly due to anti-corruption activities.
5. Conclusions
Through to the listed companies in conducting anti-corruption action before and after the change of the viscosity of the cost of research, the paper found that: 1) after anti-corruption action, the viscosity of sales and management fees of listed companies has declined significantly. It shows that the anti-corruption ac-tion indeed regulates and restricts part of the sales expenses and management expenses of listed companies, so as to make the relation between expenses and income clearer and more corresponding; 2) compared with non-state-owned enterprises, the cost stickiness of state-owned enterprises weakened less after the anti-corruption campaign started, indicating that state-owned enterprises can be in a relatively loose regulatory environment by virtue of their countless ties with the government.
According to the results of this article, the current anti-corruption campaign has not only severely cracked down on and punished corrupt officials, but also has obvious specification on the listed company of our country and the man-agement role, suppresses the political rent-seeking motive of enterprise, to our country’s economic development and further reform.
While recognizing the effectiveness of the anti-corruption campaign, we should also note some problems in the supervision of listed companies. There are still some deficiencies in relevant regulations on information disclosure. These defi-ciencies make it easy for listed companies to disguise the entertainment expenses as production costs or other subjects. Listed companies can choose whether or not to disclose these and to what extent. When there are changes in the external environment that are not conducive to the company, the company will undoub-tedly take immediate measures to hide the problems, so that the external stake-holders do not know the real situation of the company. Therefore, the informa-tion disclosure system needs to be further improved in the future development, so that external stakeholders can obtain more accurate and comprehensive in-formation about the enterprise, and at the same time play a stronger constraint role on the enterprise.
DOI: 10.4236/ajibm.2018.810139 2118 American Journal of Industrial and Business Management rent-seeking, curb the motivation of political rent-seeking, and guide enterprises to devote more resources to improving their competitiveness and management level.
Conflicts of Interest
The author declares no conflicts of interest regarding the publication of this paper.
References
[1] Yang, Q.J. (2011) Enterprise Growth: Political Connection or Capacity Building? Economic Research, 10, 54-66.
[2] Xu, X.X., Chen, K. and Gan, W.Y. (2016) Does Anti-Corruption Promote Enter-prise Innovation? Empirical Test of EnterEnter-prise R & D Decision. Scientific and Technological progress and Countermeasures, 33, 107-112.
[3] Noreen, E. and Soderstrom, N. (1997) The Accuracy of Governance Cost Models: Evidence from Hospital Service Departments. Review of Accounting Studies, 2, 89-114. https://doi.org/10.1023/A:1018325711417
[4] Anderson, M.C., Banker, R.D. and Janakiraman, S.N. (2003) Are Selling, General, and Administrative Costs “Sticky”? Journal of Accounting Research, 41, 47-63.
https://doi.org/10.1111/1475-679X.00095
[5] Malik, M. (2012) A Review and Synthesis of “Cost Stickiness” Literature. SSRN Electronic Journal.
[6] Sun, Z. and Liu, H. (2004) Study on “Stickiness” of Expenses of Chinese Listed Companies. Economic Research, 12, 26-34.
[7] Kong, Y.S., Zhu, N.P. and Kong, Q.G. (2007) Study on Cost Viscosity: Empirical Evidence from Chinese Listed Companies. Accounting Research, 11, 58-65.
[8] Jiang, W. and Hu, Y.M. (2011) Enterprise Cost Stickiness: Literature Review and Prospect. Accounting Research, 9, 74-79.
[9] Li, J.Y. and Huang, Y.F. (2010) Bribery and Enterprise Growth in the Transitional Economy. Economics, 9, 1467-1484.
[10] Jiang, W.Y. (2015) Research on the Impact of Macro-Economy on Cost Stickiness. Finance and Economics (Academic Edition), 8, 28-30.
[11] Jiang, W., Yao, W.T. and Hu, Y.M. (2016) Implementation of the Minimum Wage Regulations and Enterprise Cost Stickiness. Accounting Research, 10, 56-62. [12] Jiang, W. and Yao, W.T. (2015) Ownership Nature, Executive Tenure and Cost
Stickiness. Journal of Shanxi University of Finance and Economics, 37, 45-56. [13] Ge, Y. (2017) Study on the Impact of Cost Stickiness on Enterprise Performance:
Empirical Evidence from China’s Listed Companies. Price Theory and Practice, 6, 105-109.
[14] Shleifer, A. and Vishny, R.W. (1993) Corruption. NBER Working Papers, Vol. 108, 599-617.
[15] Svensson, J. (2005) Eight Questions about Corruption. Journal of Economic Pers-pectives, 19, 19-42. https://doi.org/10.1257/089533005774357860
[16] Nie, H. (2014) Influence of Corruption on Efficiency: A Literature Review. Financial Review, 1, 13-23.
DOI: 10.4236/ajibm.2018.810139 2119 American Journal of Industrial and Business Management
https://doi.org/10.1016/S0304-3878(99)00056-5
[18] Zhou, L. and Tao, J. (2009) Government Size, Marketization and Regional Corrup-tion. Chinese Economics Frontier, 3, 57-69.
[19] Yang, D. and Zhao, C. (2014) Why Do Executives of State-Owned Enterprises Breed Hidden Corruption? Economic Management, 10, 64-74.
[20] Xu, X. and Guo, X. (2017) Regional Official Corruption and Corporate Agency Costs—An Empirical Study Based on Listed Companies in China. Journal of Chongqing University (Social Science Edition), 23, 1-10.
[21] Klitgaard, R. (1998) Strategies against Corruption. Agencia Espa1ola de Coopera-ción Internacional Foro Iberoamericanosobre el Combate a la CorrupCoopera-ción. Santa Cruz de la Sierra, 17, 15-16.
[22] Jiang, T. and Nie, H. (2014) The Stained China Miracle: Corruption, Regulation, and Firm Performance. Economics Letters, 123, 366-369.
https://doi.org/10.1016/j.econlet.2014.03.026
[23] Huang, J. and Li, K. (2013) Eat and Drink, Corruption and Enterprise Orders. Eco-nomic Research, 48, 71-84.
[24] Wang, Y. and You, J. (2012) Corruption and Firm Growth: Evidence from China. China Economic Review, 23, 415-433.https://doi.org/10.1016/j.chieco.2012.03.003
[25] Wei, X., Dong, Z. and Jin, Z. (2015) Corruption and Enterprise Vitality: Empirical Research on the Influence of Rent-Seeking and Rent-Withdrawing on the Operating Rate. World Economy, 38, 105-125.
[26] Yan, W., Shao, C. and Pei, Z. (2015) Regional Corruption, Financial Marketization and Entrepreneurship—Empirical Evidence Based on China’s Provincial Level. Contemporary Economic Management, 37, 91-97.
[27] Dang, L., Liu, C. and Yang, S. (2017) Does Anti-Corruption Affect Corporate Do-nations?—A Micro-Interpretation Based on the Perspective of Political Relevance. Journal of Central University of Finance and Economics, 1, 115-128.
[28] Zhong, Q., Lu, Z. and Yuan, C. (2016) Anti-Corruption, Enterprise Performance and Its Channel Effect—A Study Based on Anti-Corruption Construction at the 18th CPC National Congress. Financial Research, 9.
[29] Kama, I. and Dan, W. (2010) Do Managers’ Deliberate Decisions Induce Sticky Costs? SSRN Electronic Journal, 112, 39-47.
[30] Jiang, W., Hu, Y. and Lu, Z. (2015) Should Accrued Earnings Management Affect the Cost Stickiness of an Enterprise. Nankai Management Review, 18, 83-91. [31] Che, X. and Chen, H. (2013) Research on the Influence of Self-Benefiting Behavior