A PRAGMATIC ANALYSIS OF NON
1*
Dhanabalan, T.,
1
Adjunct Faculty, Department of Logistics Management,
2
Adjunct Faculty, Department of Business Administration, Alagappa University College of Arts and Science,
ARTICLE INFO ABSTRACT
Indian banking sector is facing
Years before, Indian banking sector was in booming condition, but due to various social and economical issues, financial strength of the banks got worse and leads to the problem of NPAs. Though, Indian banks have concentrated more on controlling NPAs, miserably they have failed to do it. Hence, this study analyses the growth rate of NPAs of different banks of Indian banking sector. For analysing the data, non parametric methods of Mann Whitney
been used. The research data were collected from the annual reports of Reserve Bank of India (RBI). The results of the analysis showed that growth rate of NPAs of over the previous year, differences between and among t
Copyright © 2018, Dhanabalan et al. This is an open access distribution, and reproduction in any medium, provided
INTRODUCTION
Non-Performing Assets (NPAs) of banks are considered as a major issue in Indian banking sector for last few decades. The abrupt result of large amount of NPAs in the banking system leads to bank failure (Nkusu 2011). Numbers of researches have been done on problem of NPAs and the study found that asset quality is a significant factor for the insolvency of banks and the majority of the failed banks have high level of NPAs prior to failure (Barr and Siems, 1994). The foremost reason for the increment of NPAs is concentrating more on the quantitative stretch and less on qualitative stretch of issuing loans (Rupa Rathee and Deepthi Kuhar 2015).
sum of total loans and leases past due for 90 days or more and non-accrual loans (Amit Ghosh 2017). A high
shows high probability of credit defaults that affect the profitability and net-worth of banks thereby reduce the value of the asset. NPAs affect the liquidity and profitability, in addition to posing threat on quality of asset and survival banks (Rajan and Dhal 2003). Growth of NPAs has a direct impact on profitability of banks and it involves in the creation of compulsory provisions, which reduces the overall profits and shareholders’ value. The problem of NPAs is not only affected the banks but also the whole economy.
*Corresponding author: Dhanabalan, T.,
Adjunct Faculty, Department of Logistics Management, Alagappa University, Karaikudi, Tamilnadu.
ISSN: 0975-833X
Vol.
Article History:
Received 21st November, 2017
Received in revised form
19th December, 2017
Accepted 16th January, 2018
Published online 28th February, 2018
Citation: Dhanabalan, T., Shanthi, R. and John Peter, A.
Journal of Current Research, 10, (02), 65884-65888.
Key words:
Non- Performing Assets,
NPAs, Public Sector Banks, Foreign Banks, Private Sector Banks
RESEARCH ARTICLE
A PRAGMATIC ANALYSIS OF NON-PERFORMING ASSETS OF INDIAN BANKING SECTOR
Dhanabalan, T.,
2Shanthi, R. and
2John Peter, A.
Adjunct Faculty, Department of Logistics Management, Alagappa University, Karaikudi, Tamilnadu
Adjunct Faculty, Department of Business Administration, Alagappa University College of Arts and Science,
Paramakudi, Tamilnadu
ABSTRACT
Indian banking sector is facing the problem of Non Performing Assets (NPAs) in the recent years. Years before, Indian banking sector was in booming condition, but due to various social and economical issues, financial strength of the banks got worse and leads to the problem of NPAs. gh, Indian banks have concentrated more on controlling NPAs, miserably they have failed to do it. Hence, this study analyses the growth rate of NPAs of different banks of Indian banking sector. For analysing the data, non parametric methods of Mann Whitney U test and Kruskal Wallis test have been used. The research data were collected from the annual reports of Reserve Bank of India (RBI). The results of the analysis showed that growth rate of NPAs of over the previous year, differences between and among the growth rate of NPAs of different banks of Indian banking sector.
access article distributed under the Creative Commons Attribution License, the original work is properly cited.
Performing Assets (NPAs) of banks are considered as a major issue in Indian banking sector for last few decades. The abrupt result of large amount of NPAs in the banking system leads to bank failure (Nkusu 2011). Numbers of researches problem of NPAs and the study found that asset quality is a significant factor for the insolvency of banks and the majority of the failed banks have high level of NPAs Siems, 1994). The foremost reason is concentrating more on the quantitative stretch and less on qualitative stretch of issuing
Deepthi Kuhar 2015). NPAs are the
sum of total loans and leases past due for 90 days or more and accrual loans (Amit Ghosh 2017). A high level of NPAs shows high probability of credit defaults that affect the worth of banks thereby reduce the value of the asset. NPAs affect the liquidity and profitability, in addition to posing threat on quality of asset and survival of banks (Rajan and Dhal 2003). Growth of NPAs has a direct impact on profitability of banks and it involves in the creation of compulsory provisions, which reduces the overall profits and shareholders’ value. The problem of NPAs is not only
anks but also the whole economy.
Adjunct Faculty, Department of Logistics Management, Alagappa
Hence, the NPAs called as financial pollution (Barseghyan
2010). In the recent years Indian banking sector is under
financial pressure due to the problem of NPAs. Years before, Indian banking sector was in booming condition, but after sometimes strength of the banks got worsened because of NPAs. Some of the Indian bank
controlling the NPAs, but some banks miserably they have failed to control it (Laveena and Meenakshi Malhotra 2014). Indian banking sector has comprised with 26 public Sector Banks (6 State Bank of India (SBI) and Associated b
Nationalized Banks (NBs) and one Public Sector Bank (PSB), 25 Private Sector Banks (14 Old Private Sector Banks (OPSBs) and 11 New Private Sector Banks (NPSBs), 43 Foreign Banks (FBs), 56 Regional Rural Banks (RRBs), 1589 Urban Co-operative banks (UCBs) and 93550 Rural Co operative banks (RCBs) (RBI Guidelines 2017).
of banking size and structure all the banks are facing the problem of NPAs. Though, highest volume of NPAs is root cause of bank failure, it can be considered as a symbo
crisis (Klein 2013). Hence, reduction of NPAs is an important one to reinstate a strong banking setup and endorse the financial stability (Reinhart and Rogoff 2010).
loans and advances due in bank records, some amount of loan accounts have to write as NPAs for various reasons. Though, NPAs cannot be fully avoid, they can be reduced as much as possible by monitoring the accounts regularly and following certain protective measures at the time of new loan
International Journal of Current Research
Vol. 10, Issue, 02, pp.65884-65888, February, 2018
Dhanabalan, T., Shanthi, R. and John Peter, A., 2018. “A pragmatic analysis of non-performing assets of indian banking sector
Available online at http://www.journalcra.com
PERFORMING ASSETS OF INDIAN BANKING SECTOR
Alagappa University, Karaikudi, Tamilnadu
Adjunct Faculty, Department of Business Administration, Alagappa University College of Arts and Science,
the problem of Non Performing Assets (NPAs) in the recent years. Years before, Indian banking sector was in booming condition, but due to various social and economical issues, financial strength of the banks got worse and leads to the problem of NPAs. gh, Indian banks have concentrated more on controlling NPAs, miserably they have failed to do it. Hence, this study analyses the growth rate of NPAs of different banks of Indian banking sector. For U test and Kruskal Wallis test have been used. The research data were collected from the annual reports of Reserve Bank of India (RBI). The results of the analysis showed that growth rate of NPAs of over the previous year, differences
he growth rate of NPAs of different banks of Indian banking sector.
License, which permits unrestricted use,
Hence, the NPAs called as financial pollution (Barseghyan In the recent years Indian banking sector is under financial pressure due to the problem of NPAs. Years before, Indian banking sector was in booming condition, but after sometimes strength of the banks got worsened because of NPAs. Some of the Indian banks have concentrated more on controlling the NPAs, but some banks miserably they have
failed to control it (Laveena and Meenakshi Malhotra 2014).
Indian banking sector has comprised with 26 public Sector Banks (6 State Bank of India (SBI) and Associated banks, 19 Nationalized Banks (NBs) and one Public Sector Bank (PSB), 25 Private Sector Banks (14 Old Private Sector Banks (OPSBs) and 11 New Private Sector Banks (NPSBs), 43 Foreign Banks (FBs), 56 Regional Rural Banks (RRBs), 1589 (UCBs) and 93550 Rural
Co-operative banks (RCBs) (RBI Guidelines 2017). Irrespective
of banking size and structure all the banks are facing the problem of NPAs. Though, highest volume of NPAs is root cause of bank failure, it can be considered as a symbol of bank crisis (Klein 2013). Hence, reduction of NPAs is an important one to reinstate a strong banking setup and endorse the
financial stability (Reinhart and Rogoff 2010). As long as
loans and advances due in bank records, some amount of an accounts have to write as NPAs for various reasons. Though, NPAs cannot be fully avoid, they can be reduced as much as possible by monitoring the accounts regularly and following certain protective measures at the time of new loan
INTERNATIONAL JOURNAL OF CURRENT RESEARCH
sanction, annual review of existing loan accounts performance, loan renewal and enhancements of existing limits (Espinoza and Prasad 2010). The rehabilitation of viable units, re-phasing loan installments wherever necessary, applying for settlement of the due from Credit Guarantee Fund Trust for Micro and Small Enterprises (CGTMSE) and Export Credit Guarantee Corporation (ECGC), Compromise settlements like One Time Settlement (OTS), Out of Court Settlement (OCS) and writing off non-recoverable assets are parts of the process involved in
reducing NPAs (Surendra Naik 2017). Pre and post sanction
credit monitoring has a foremost role in the minimization of NPAs. Qualitative assessment of financial declarations help to identify the unhealthy progress in accounts and working position of the company, proper assessment of the viability of the project before sanctioning the financial assistance to a borrowing unit are the indispensable aspects in reducing NPAs (Beck and Jakubik 2015). With this background the study analyse and compare the NPAs of the different banks of the
Indian banking sector.
Through this article we have examined the trend of NPAs over the past 16 years from 2001-02 to 2016-17 and analysed the difference between the median growth rate of the NPAs of different banks. Followed by the introduction section the trends in NPAs of Indian banking sector presented. Methodology section provides the detail of data set, hypotheses of the study, statistical methods and measuring methods has followed. Results of the analysis have been presented in the results and discussion section. Final section concludes the study.
Trends of npas in Indian banking sector
[image:2.595.42.285.490.625.2]As mentioned earlier NPAs are the sum of total loans and leases due for past 90 days or more and non-accrual loans, divided by total loans. It can be seen the trend of NPAs of Indian banking sector from the below mention figure.
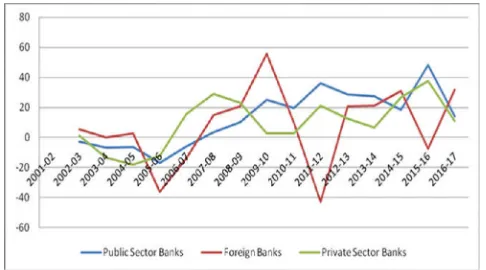
Figure 1. Growth of NPAs of Indian Banking Sector (Growth rate in percent)
Figure one provides ocular view of total NPAs of the different banks of Indian banking sector such as PSBs, FBs and Private
sector banks for the period 1st April 2001-02 to 31st March
2016-17. It was found that there was a negative growth rate of public sector banks from 2001-02 to 2006-07 and it showed that the banks have controlled the NPAs certain level over the previous years and in the rest of the years there was ups and downs have been seen. A highest growth rate of 45 percent of NPAs has been found in PSBs during 2015-16. As far as the FBs concerned in the 16 years of period in all the year there was a upward trend in the growth of NPAs over the previous
Private sector banks growth rate is concerned, there was negative growth has been found from 2001-02 to 2005-06 and it showed that the banks managed the NPAs in a manner. In the reaming period there were ups and downs have been seen.
METHODOLOGY
Data Set
The present work is purely based on the second hand data that have been derived from RBI annual records. The collected data have covered the period of 16 years from 2001-02 to 2016-17. The aim of the collected data is to compare the NPAs of the NBs, SBI and its group, PSBs, OPSBs, NPSBs and FBs.
Hypotheses of the Study
The following hypotheses have framed for the study.
H1:There is a significance difference in the growth of NPAs
of NBs and SBI and its group in India.
H2:There is a significance difference in the growth of NPAs
of PSBs and FBs in India.
H2: There is a significance difference in the growth of NPAs
of OPSBs and NPSBs in India.
H4: There is a significance difference among the growth of
NPAs of the NBs, SBI and its group, FBs, OPSB and NPSB.
Methods for Data Analysis
Non-parametric tests called Maan-Whitney U test and Kruskal Wallis test have been used to analyse the collected data. The Maan-Whitney U test has been used to compare the NPAs of one bank group with other bank group. The Mann-Whitney procedure is one in which the exact permutation null distribution is compiled for the actual data. This test enjoys great popularity among scientists comparing two groups of observations, especially when measurements made on a continuous scale are non-normally distributed (Reinhard Bergmaan, John Ludbrook and Will P.J.M.Spooren 2012). Formula for the test is:
[ Eqn 1 ]
Where, NM denotes sum of ranks of sample 1 and sample 2.
Rank (xi) shows sum of ranks of sample 1. With the help of
level. The samples are selected independently. The samples must come from populations with identical shape (Shlomo Sawilowsky and Gail Fahoome 2014).
Formula for the Kruskal-Wallis test is:
[Eqn 2]
Where N is the total sample sizes (the sum of the sample
sizes), Ri is the sum of ranks for sample
i, from a total of k samples.
Measuring Methods
The collected data have been related to six banks that have mentioned earlier. With a view to compare the differences in of NPAs of each bank, growth rate has been calculated over the previous year with the help of the following formula:
[ Eqn 3]
where CY is current year and PY is previous year
After calculated the growth rate has been observed. All the observations were arranged in ascending order with a view to assign ranks from smaller value to larger value. Thus the numeric ranks have been assigned to all the observations from both groups in one set, beginning with 1 for the smallest value. Finally, add up all the ranks for the observations which came from sample 1 and 2.
RESULTS AND DISCUSSION
It is understand from the table one that the position NPAs of NBs and SBI and its group banks. In which NBs scoring the sum of ranks of 240.5 and SBI and its group banks securing total ranks of 224.5 and thus the test statistics value of U = 104.5 is derived. The value reveals that, since the U-value 104.5 is greater than 64 the result is not significant at p < .05. On the other hand the Z score also adding values to the U test result by its score of 0.31109.
[image:3.595.59.534.360.549.2]The p-value is .75656 and hence the result is not significant at p < .05. Thus it is concluded that the null hypothesis has been accepted and it is proved that there is a difference in the growth of the NPAs of NBs and SBI and its group.
Table 1: Growth rate of NPAs of NBs and SBI and its group banks
Year NPAs of NBs
(Amount in Crores)
Growth Rate over the previous year in
%
Array of values
Ranks NPAs of SBI and its
Group (Amount in Crores)
Growth Rate over the previous year in
%
Array of values
Ranks
2001-02 37453 --- --- --- 19115 --- --- ---
2002-03 37128 -0.87 -13.83 3 17861 -7.02 -18.05 1
2003-04 36378 -2.06 -10.1 4 15159 -17.82 -17.82 2
2004-05 33591 -2.39 -8.49 6 14809 -2.36 -8.58 5
2005-06 32804 -8.49 -4.79 8 14818 0.06 -7.02 7
2006-07 28817 -13.83 -2.39 9 12552 -18.05 -2.36 10
2007-08 26172 -10.1 -2.06 11 12683 1.03 0.06 13
2008-09 24974 -4.79 -0.87 12 15428 17.79 1.03 14
2009-10 26543 5.91 5.91 15 18483 16.52 16.52 16
2010-11 36395 27.06 17.79 17.5 23609 21.71 17.79 17.5
2011-12 44272 17.79 27.06 23 30393 22.32 21.34 19
2012-13 69048 35.88 28.05 24 48215 36.96 21.71 20
2013-14 101679 32.09 31.04 25 62779 23.19 22.32 21
2014-15 147448 31.04 32.09 26 79817 21.34 23.19 22
2015-16 204959 28.05 35.88 27 73508 -8.58 36.96 28
2016-17 419788 51.17 51.17 30 121986 39.74 39.74 29
Sum of Ranks 240.5 Sum of Ranks 224.5
U – value 104.5 U - value 120.5
Source: Annual Reports of the RBI, NBs- Nationalised Banks, SBI- State Bank of India
Table 2. Growth rate of NPAs of Public sector banks and FBs
Year NPAs of PSBs
(Amount in Crores)
Growth Rate over the previous year in %
Array of values
Ranks NPAs of FBs
(Amount in Crores)
Growth Rate over the previous year in %
Array of values
Ranks
2001-02 56568 --- --- --- 2726 --- --- ---
2002-03 54989 -2.87 -17.02 3 2889 5.64 -42.66 1
2003-04 51537 -6.69 -6.69 6 2894 0.17 -35.85 2
2004-05 48399 -6.48 -6.48 7 2978 2.82 -13.69 4
2005-06 41358 -17.02 -6.13 8 2192 -35.85 -7.47 5
2006-07 38968 -6.13 -2.87 9 1928 -13.69 0.17 10
2007-08 40452 3.66 3.66 12 2263 14.82 2.82 11
2008-09 44957 10.02 10.02 15 2859 20.84 5.64 13
2009-10 59926 24.97 14.08 16 6444 55.63 9.65 14
2010-11 74600 19.67 18.38 18 7133 9.65 14.82 17
2011-12 117262 36.38 19.67 19 5000 -42.66 20.59 20
2012-13 164461 28.69 24.97 23 6297 20.59 20.84 21
2013-14 227264 27.63 27.63 24 7977 21.06 21.06 22
2014-15 278468 18.38 28.69 25 11565 31.02 31.02 26
2015-16 539956 48.42 36.38 28 10761 -7.47 31.91 27
2016-17 628471 14.08 48.42 29 15805 31.91 55.63 30
Sum of Ranks 242 Sum of Ranks 223
U – value 103 U – value 122
[image:3.595.51.543.588.769.2]The ‘U’ value and ‘Z’ score of the PSBs and FBs have been presented in Table two. Sum of ranks of PSBs and FBs is 242 and 223 respectively and the ‘U’ value is 103 and 122 respectively. The critical value of the test at p < .05 is 64 but the calculated value of ‘U’ is 103. Therefore, the result is not significant at p < .05. On the other hand, the Z-Score is 0.3733 and the p-value is .71138. Therefore result is not significant at p < .05, and it concludes that there is a significant difference in the growth rate of the NPAs of the public sector and FBs. Table three shows that the results of ‘U’ and ‘Z’ score of OPSBs and NPSBs. The result is not significant since ‘U’ value 80 is more than the critical value of 64 at p < .05. Therefore, the result is not significant at p < .05. It is
concluded that the H0 cannot be rejected because 80 > 64 and
it is proved that there is a significant difference in the median growth rate of the NPAs of the old private sector and NPSBs. Table four provides the detail of the growth rate of the NPAs of nationlised banks, SBI and its group banks, FBs, old and NPSBs over the previous year. Based on the information provided, the significance level is α = 0.05, and the number of degrees of freedom is 5-1 = 4. Therefore, the rejection region
for this Chi-Square test is R ( χ2: χ2 >1.2 E + 308 ). Since it is
observed that χ2 = 3.393 ≤ χ2U = 1.2 E + 308 and it is
concluded that the null hypothesis not rejected. By using the P-value approach it is said that since the p = 0.4943 ≥ 0.05 and it
Therefore, there is no evidence to claim that some of the population medians are unequal, at α = 0.05 significance level. Hence it is concluded that there is a significance difference exist in the median value of the NPAs of the NBs, SBI and its group, PSBs, FBs, OPSBs and NPSBs.
Conclusion
[image:4.595.60.531.70.262.2]Out of the 16 years data it is observed that the public sector banks have managed the NPAs in a manner over the previous year from 201-02 to 2006-07. Foreign bank is concerned, it has faced the swift ups and downs during the mentioned period and it faced a highest NPAs growth rate of 55.63 percent in the year 2009-10. Private sector banks are concerned, its growth rate over the previous year having gradual ups and downs and the highest growth rate of NPAs has been recorded in the year 2015-16 as 37.58 percent. From the Mann Whitney U test it is understand that, there is a difference in the growth rate of the NPAs of NBs and SBI and its group, public sector and FBs and old private sector and NPSBs. Through the Kruskal Wallis test it is understand that the significance difference exist in the growth of NPAs of the NBs, SBI and its group, PSBs, FBs, OPSBs and NPSBs. With the help of both statistical tools, it is proved that all the banks have the problem of NPAs irrespective of their size and operation. NPAs mean allocation of funds in terms of bad asset, which arises due to the selection
Table 3. Growth rate of NPAs of OPSBs and NPSBs
Year NPAs of
OPSBs
Growth Rate over the previous year in %
Array of values
Ranks NPAs of
NPSBs
Growth Rate over the previous year in %
Array of values
Ranks
2001-02 4851 --- --- --- 6811 --- --- ---
2002-03 4550 -6.61 -43.76 1 7232 5.82 -30.57 2
2003-04 4398 -3.47 -26.6 3 5983 -20.87 -20.87 4
2004-05 4200 -4.71 -16.11 5 4582 -30.57 -13.07 6
2005-06 3759 -11.73 -11.73 7 4052 -13.07 1.16 12
2006-07 2969 -26.6 -6.61 8 6287 35.54 3.33 13
2007-08 2557 -16.11 -4.71 9 10440 39.77 5.82 14
2008-09 3072 16.76 -3.47 10 13854 24.64 10.01 15
2009-10 3622 15.18 -0.61 11 14017 1.16 10.92 16
2010-11 3600 -0.61 14.04 17 14500 3.33 14.14 18
2011-12 4200 14.28 14.28 19 18768 22.74 22.74 25
2012-13 5210 19.38 15.18 20 21071 10.92 24.64 26
2013-14 3624 -43.76 16.76 21 24542 14.14 28.04 27
2014-15 4216 14.04 17.33 22 34106 28.04 35.54 28
2015-16 5208 19.04 19.04 23 56186 39.29 39.29 29
2016-17 6300 17.33 19.38 24 62437 10.01 39.77 30
Sum of the Ranks 200 Sum of the Ranks 265
U – value 145 U - value 80
[image:4.595.120.470.308.482.2]Source: Annual Reports of the RBI, OPSBs – Old Private Sector Banks, NPSBs – New Private Sector Banks
Table 4. Growth Rate of the NPAs of NBs, SBI and its Groups, FBs, OPSB and NPSBs
Year NBS Ranks SBI Ranks FBS Ranks OPSB Ranks NPSB Ranks
2001-02 --- --- --- --- --- --- --- --- --- ---
2002-03 -18.33 10 -18.05 7 -42.66 2 -43.76 1 -30.57 4
2003-04 -10.10 14 -17.82 8 -35.85 3 -26.60 5 -20.87 6
2004-05 -8.49 16 -8.58 15 -13.69 11 -16.11 9 -13.07 12
2005-06 -4.79 20 -7.02 18 -7.47 17 -11.73 13 1.16 31
2006-07 -2.39 23 -2.36 24 0.17 29 -6.61 19 3.33 33
2007-08 -2.06 25 0.06 28 2.82 32 -4.71 21 5.82 35
2008-09 -0.87 26 1.03 30 5.64 34 -3.47 22 10.01 38
2009-10 5.91 36 16.52 45 9.65 37 -0.61 27 10.92 39
2010-11 17.79 48.5 17.79 48.5 14.82 43 14.04 40 14.14 41
2011-12 27.06 61 21.34 55 20.59 52 14.28 42 22.74 58
2012-13 28.05 63 21.71 56 20.84 53 15.18 44 24.64 60
2013-14 31.04 65 22.32 57 21.06 54 16.76 46 28.04 62
2014-15 32.09 67 23.19 59 31.02 64 17.33 47 35.54 68
2015-16 35.88 69 36.96 70 31.91 66 19.04 50 39.29 71
2016-17 51.17 74 39.74 72 55.63 75 19.38 51 39.77 73
Sum of Ranks 617.5 592.5 572 437 631
Hence banks should pay attention on the process of lending money and recovery of the loans. If it is possible, it will help to eradicate the financial pollution called NPAs.
REFERENCES
Amit Gosh. 2017. ‘Sector-specific analysis of Non-Performing loans in the US Banking system and their Macroeconomic
Impact’, Journal of Economics and Business, Vol. 93,
No.3, pp. 29-45.
Barr, R.S. and Siems, T.F. 1994. ‘Forecasting Bank Failure: A
Non-Parametric Frontier Estimation Approach’,
Recherches Economiques de Louvain Economic Review,
Vol. 60, No.4, pp. 417-429.
Barseghyan, L. 2010. ‘Non - Performing Loans, Prospective
Bailouts and Japan’s Slowdown’, Journal of Monetary
Economics, Vol.57, No.7, pp. 873-890.
Espinoza, R., and Prasad, A. (2010) ‘Non Performing Loans in the GCC Banking System and Their Macroeconomic
Effects’, International Monetary Fund Working Paper
10/224. http://www.imf.org/ external/pubs/cat/lon
gres_gsause.aspx?sk=24258andgsa=true.
Klein, N. 2013. ‘Non-performing loans in CESEE:
Determinants and Impact on Macroeconomic
Performance’, International Monetary Fund Working
Paper 13/72. Pp. 1-26.
Laveena and Meenakshi Malhotra. 2014. ‘Empirical Analysis of Non Performing Assets Related to Private Banks of
India’, International Journal of Excellence, Vol. 3, No.1,
pp.386-391.
Nkusu, M. 2011. ‘Nonperforming Loans and Macro Financial
Vulnerabilities in Advanced Economies’, IMF Working
Papers 11/161.
Rajan, R., Dhal, S.C. 2003. ‘Non - Performing Loans and Terms of Credit of Public Sector Banks in India: An
Empirical Assessment’, Reserve Bank of India Occasional
Papers 24.
Reinhard Bergmaan., John Ludbrook., Will, P.J.M., and Spooren. 2012. ‘Different Outcomes of the Wilcoxon Mann Whitney Test from Different Statistics Packages’,
The American Statistician, Vol. 54, No. 1, pp. 72-77.
Reinhart, C.M., Rogoff, K.S. 2010. From Financial Crash to
Debt Crisis. National Bureau of Economic Research
working paper 15795.
Reserve Bank of India, 2017. Annual Report of Indian Banking
Sector 2016/2017. https://www.rbi.org.in.
Roland Beck., Peter Jakubík and Anamaria Piloiu. 2013. ‘Non-Performing Loans: What Matters in Addition to the
Economic Cycle?’, Working Paper Series 1515, European
Central Bank. https://www.ecb.europa.eu/ pub/pdf/scpwps/ ecbwp1515.pdf.
Rupa Rathee, Deepti Kuhar, and Parveen Siwach. 2015. ‘Non
Performing Assets in SBI (State Bank of India)’, Global
Journal of Enterprise Information System, Vol. 7, No.1,
pp.56-58.
Shlomo Sawilowsky and Gail Fahoome. (2014)
‘Kruskal-Wallis Test: Basic’, Wiley Stats Ref: Statistics Reference
Online. https://doi:10.1002/9781118445112.stat06567.
Surendra Naik. 2017. ‘What are the strategies used for
reducing NPA?’. Banking News and Information Portal.
https://www.bankingschool.co.in/loans-and advances/strategies-for-reducing-npa