http://www.scirp.org/journal/jbise J. Biomedical Science and Engineering, 2019, Vol. 12, (No. 2), pp: 151-182
https://doi.org/10.4236/jbise.2019.122011 151 J. Biomedical Science and Engineering
Wearable Wireless Body Area Nodes for Remote
Physiological Signal Monitoring System
M. G. Srinivasa1 , P. S. Pandian2*
1Department of Electronics & Communication Engineering, Thandavapura, Nanjangud Taluk, Mysore, India; 2Defence Research & Development Organization (DRDO), LRDE Campus, C V Raman Nagar, Bangalore, India Correspondence to: P. S. Pandian,
Keywords: WPMS, WBAN, Textile Electrode, Sensor Node, Physiological Signals, ZigBee
Received: January 18, 2019 Accepted: February 25, 2019 Published: February 28, 2019 Copyright © 2019 by authors and Scientific Research Publishing Inc.
This work is licensed under the Creative Commons Attribution-NonCommercial International License (CC BY-NC 4.0).
http://creativecommons.org/licenses/by-nc/4.0/
ABSTRACT
Wearable remote health monitoring systems have gained significant prominence in the re-cent years due to their growth in technological advances. One form of the Wearable Physi-ological Monitoring System (WPMS) is the Wearable Body Area Networks (WBAN) used to monitor the health status of the wearer for long durations. The paper discusses a prototype WBAN based wearable physiological monitoring system to monitor physiological parame-ters such as Electrocardiogram (ECG) and Electroencephalogram (EEG) acquired using a textile electrode, Photoplethysmogram (PPG), Galvanic Skin Response (GSR), Blood Pres-sure derived from analysis of Pulse Transmit Time (PTT) and body temperature. The WBAN consists of three sensor nodes that are placed strategically to acquire the physiolog-ical signals and the sensor nodes communicate to a chest/wrist worn sink node also known as wearable data acquisition hardware. The sink node receives physiological data from the sensor nodes and is transmitted to a remote monitoring station. The remote monitoring station receives the raw data and it is processed to remove noises, such as power line inter-ference, baseline wander and tremor in the signals and the information is extracted and displayed. The WBANs are designed using the ZigBee wireless communication modules to transmit and receive the data. At the remote monitoring station the physiological parame-ters such as heart rate, pulse rate, systolic, diastolic blood pressure, GSR and body temper-ature are continuously monitored from the wearer. The data acquired from the wearable monitoring system is statically validated using a qualified medical device on 34 subjects.
1. INTRODUCTION
This Ischemic heart disease and stroke are considered as the major cause of death in the global
https://doi.org/10.4236/jbise.2019.122011 152 J. Biomedical Science and Engineering
lation. The reasons for occurrence of these diseases are stress, change in life style, bad food habits, smok-ing, alcohol consumption, lack of exercise, etc. Proper management of health is vital for maintaining a healthy lifestyle, which requires visit to hospital and a regular health checkup, which was lacking. There is a need to monitor the health status of the individuals non-invasively and at early stage of the disease. Non-invasive devices are commonly available in the market for measurement of various physiological pa-rameters for use in hospitals, clinics and at home. But there is a need for monitoring the health status of the individuals while they perform their routine activities, which is possible by use of wearable devices known as Wearable Physiological Monitoring System (WPMS).
WPMS integrates smart sensors into wearable shirt or a smart wearable device such as a watch to continuously acquire and monitor the health status of the wearer. There has been a tremendous growth in the WPMS in the recent past due to the advancements in smart sensors, microelectronics, digital signal processing techniques and miniaturized wireless communication technologies. The wearable technologies are beneficial in healthcare for early diagnosis and detection of problems, less invasive treatment options, reduction in hospital stay and reduction in rehabilitation time.
The conventional medical devices that are used for health monitoring are not suitable for wearable monitoring due to the following reasons: [1, 2]
• The existing systems make use of gel electrodes to acquire bio potential signals from the body surface.
But these gel electrodes cannot be used for long duration because the gel present in these electrodes gets dried up over a period of time. This increases the skin contact resistance and degrades the quality of the bio potential signals acquired.
• The physiological signals acquired from the gel electrodes are prone to noises such as baseline wander
and motion artifacts. These noises arise due to the respiration and physical movement of the subject. Hence the ionic exchange from the skin surface to the electrode gets disturbed.
• Conventional systems are bulky not portable and cannot be used for long duration monitoring. • The existing systems use wired data acquisition hardware for acquiring bio potential signals. As such
the sensors from the body surface are routed with bunch of wires and these wires cause discomfort to the wearer.
• Conventional systems are meant for short duration monitoring and measurements. • The conventional systems require trained personnel to operate the equipment.
• The conventional systems are too costly and cannot be exploited for wearable health monitoring
sys-tems.
Due to the above drawbacks there is a need to develop customized wearable physiological monitoring systems based on the intended use or applications.
There has been tremendous growth in the materials, sensors, microelectronics, wireless communica-tions, high-speed processor & signal processing technologies. The technological advancements have seen an impact in the health care industry. One such development is the wearable physiological monitoring system. In these systems the sensors and data acquisition systems are integrated into the fabric of the wearer that enables monitoring of the physiological signals in continuous time without need for the inter-vention of the wearer. The wearable monitoring systems are available in various form factors and can be integrated in shirt, wrist watch, anklets, shoes, socks, chest worn belt, hats, etc. The wearable systems for physiological monitoring are being exploited in a number of health care applications, as follows.
• Monitoring the health conditions of elderly persons at home, individuals with chronic health
condi-tions for timely intervention by doctors.
• Fitness monitoring of individuals using wearable devices to check their day-to-day health status. • Detection of fall, onset of epileptic seizers, heart attacks, strokes in persons. In these emergency
con-ditions, an alarm is sent to the family members and healthcare providers.
• To know the efficiency and progress of treatments given and monitor physiological changes from
chronic conditions.
• Health monitoring of subjects during their routine activity for early detection of symptoms
https://doi.org/10.4236/jbise.2019.122011 153 J. Biomedical Science and Engineering
monitoring, Heart rate monitoring etc.
• The wearable systems, can be used to monitor the health conditions of some important personnel like
soldiers in the battlefield fighting the enemy, fire fighters, miners, deep sea divers and astronauts in space. These persons always risk their lives to protect and complete the assigned task. Hence moni-toring their health conditions becomes vital.
The wearable systems for monitoring the physiological signals developed so far targets a number of applications such as home healthcare monitoring [3], physiological status monitoring of soldier’s health conditions in a battle field [4, 5], monitoring the health status of astronauts in space [6], coal mine workers [7-9], fire fighters fighting fire [10-12], Sudden Infant Death Syndrome (SIDS) [13]. A wearable belt to monitor body temperature, heart and breathing rates and body position of babies has connectivity using ZigBee to monitor SIDS in infants [14]. A wearable system named Health Gear to monitor the users blood oxygen level and pulse while sleeping and algorithms for automatically detecting sleep apnea events and having connectivity to a mobile phone using Bluetooth and the system performance evaluated on 20 vo-lunteers [15]. Sannino et al. have proposed a wearable system that monitors ECG using a mobile phone connectivity and by studying the Heart Rate Variability (HRV) automatically detect sleep apnea [16].
A wearable health monitoring system named WEALTHY integrates sensors, electrodes and the con-nectivity in fabric form and use advanced signal processing techniques to process. The data is transmitted wireless to a remote monitoring station [17]. A wearable physiological monitoring system named ‘Smart Vest’ is developed to monitor the ECG acquired from dry electrodes made of Silver filled conducting Sili-con rubber electrodes, blood pressure derived from Pulse Transit Time (PTT), body temperature and Gal-vanic Skin Response (GSR) remotely monitored using wireless communication along with the GPS loca-tion of the wearer [18]. An eyeglass based wearable device to monitor Photoplethysmogram (PPG) and ECG is developed to monitor the heart rate and blood pressure derived from PTT [19]. A wrist worn wearable device named “AMON” to monitor and alert high risk cardiac/respiratory patients using cellular communication is developed and validated on 33 subjects [20]. A low cost ZigBee based smart wearable physiological monitoring system to monitor temperature, heart rate and fall detection is developed that can be adapted to monitor athletes, infants and patients recovering from illness at home [21]. A wearable multi-parameter physiological monitoring system termed as LifeGaurd for space and terrestrial applica-tions monitors ECG, respiration rate, heart rate, oxygen saturation in blood, body temperature, blood pressure and three axes acceleration with wireless transmission capability [22]. Vivometrics developed a wearable physiological monitoring known as ‘Life Shirt’ to monitor various cardio respiratory parameters using conventional sensors [23]. A wearable health monitoring system code named BIOTEX was devel-oped using textile sensors to measure physiological parameters and the chemical composition of the body fluids such as sodium, conductivity, pH and additionally sweat rate, ECG, respiration and blood oxygena-tion were also developed [24].
A prototype WBAN using ZigBee communication was developed to monitor physiological, kinetic and environmental sensors. The system provides real-time feedback to the user and generates warnings based on the user’s state, level of activity and environmental conditions and the data is transferred to medical servers through the internet for storage and archival [25]. A WBAN to monitor body temperature, heart beat rate and oxygen saturation in blood is developed through ZigBee communication and stored in a centralized server [26]. A network of medical sensors to collect physiological data from patients and transmit it to a PDA using ZigBee to medical server using 3G communications is developed [27]. A WBAN to monitor heart rate and body temperature of multiple patients at home is developed to provide cheaper, easier and quick response if patient has any abnormality [28].
https://doi.org/10.4236/jbise.2019.122011 154 J. Biomedical Science and Engineering
2. MATERIALS AND METHODS
2.1. Wearable Body Area Network (WBAN) Architecture
The proposed wireless wearable physiological monitoring system consists of three sensors nodes placed strategically at specific locations on the human body to acquire the physiological parameters. Fig-ure 1 illustrates the schematic of the WBAN consisting of three sensor nodes.
The sensor node 1 is to acquire ECG in Lead-I configuration from the upper thorax region and the body temperature of the subject. The sensor node 2 is to acquire one channel of bipolar EEG signal from the frontal pole region. The sensor node 3 is to acquire PPG and GSR signals, the PPG signals are picked from the index finger and the GSR is picked from the medial positions of the index finger and middle fin-ger. The sensor nodes acquire the physiological signals and are transmitted to the sink node or the weara-ble data acquisition hardware using ZigBee wireless communication. At the sink node the data is received and transmitted wireless to the remote monitoring station for further analysis and interpretation.
2.2. Physiological Parameters & Sensors
The important physiological signals monitored are Electrocardiogram (ECG), Electroencephalogram (EEG), body temperature, PPG, GSR, Blood Pressure and Heart Rate. Table 1 illustrates the specifications of the above parameters monitored and the sensors used.
[image:4.595.195.408.368.705.2]The ECG and EEG signals are acquired using commercially available conductive textile material. Two types of electrodes were fabricated using MedTexTM 130 and MedTexTM 180. The textile material Med-Tex130TM is plated with high ionic Silver on Nylon elastic knit material on the both the surfaces, whereas
https://doi.org/10.4236/jbise.2019.122011 155 J. Biomedical Science and Engineering
MedTexTM 180 is coated with Silver on one surface only. The specifications of the textile material used for fabricating the ECG electrode are given in Table 2.
[image:5.595.58.538.237.395.2]The ECG and EEG electrodes were fabricated with the conductive textiles of length 30 mm and width 25 mm and the connector was made at one edge of the electrode using a stainless steel connector. The electrodes were fabricated for the acquisition of ECG Lead-I and EEG signal from the frontal pole region. The GSR electrodes were also fabricated with conductive textile material of length 15 mm and width 10 mm and the connectors were made using stainless steel. Figure 2(a) illustrates the schematic of the sensor node integrated into a chest belt with ECG electrodes, temperature sensor and the wearable data acquisi-tion hardware and Figure 2(b) illustrates the schematic of the sensor node, integrated with EEG electrodes to acquire from the frontal pole region.
Table 1. Physiological parameters monitored and their specifications.
SL. No Parameter Specifications
Type 1 MedTexTM 130 Type 2 MedTexTM 180
1 Surface Resistance <5 Ω <5 Ω
2. Plating 99.9% pure Silver 99.0% pure Silver 3 Abrasion Resistance 100,000 Cycles 100,000 Cycles
4. Total Thickness 0.45 mm 0.554 mm
5. Weight 140 g/m2 224 g/m2
6 Material 78% Nylon + 18% Elastomer 78% Nylon + 22% Elastomer
Table 2. Electrode Specifications.
SL. No Physiological Parameter Physiological Signal Specifications & Sensor Sensor
1 Electrocardiogram (ECG) Frequency: 0.5 - 100 Hz Amplitude 0.25 - 1 mV (30 mm Textile Electrode × 25 mm)
2. Heart Rate 40 - 220 Beats per minute Measured from ECG Signal Measured from ECG Signal
3. Electroencephalogram (EEG) Amplitude: 10 μV to 100 μV Frequency 0.5 - 35 Hz (15 mm Textile Electrode × 10 mm)
4. Body Temperature 0˚C - 40˚C Resolution ± 0.01˚C Thermistor YSI 409B
5. Blood Pressure (Systolic and Diastolic) Transmit Time (PTT) Systolic: 50 - 300 Derived from analysis of Pulse mmHg; diastolic: 40 - 140 mmHg
PTT measured from PPG and ECG signals
6. Galvanic Skin Response (GSR) Skin Resistance 0 to 100 KΩ (10 mm Textile Electrode × 15 mm)
https://doi.org/10.4236/jbise.2019.122011 156 J. Biomedical Science and Engineering
Figure 2. Textile Electrode integrated to belt with sensor node to acquire (a) ECG (b) EEG signals.
[image:6.595.167.439.282.421.2]Figure 3. Schematic of gloves with integrated GSR Electrodes, PPG Sensors & Sensor Node 3 (a) Palm side (b) Back side.
Figure 3 illustrates the schematic of the sensor node, which is worn in the form of a gloves with inte-grated with textile electrodes for GSR measurement and PPG acquisition with source and photo detector integrated into the gloves.
2.3. Textile Electrode Characterization
Electrodes are the key components for recording the bio-potential signals in wearable monitoring systems, their characteristics will decide the quality of bio-potential signals recorded. The electrodes con-tact impedance of electrode-skin interface for wet Ag-AgCl, dry Ag-AgCl, textile electrodes type 1 and type 2 are calculated. The contact impedance measurement setup is shown in Figure 4(a) & Figure 4(b)
that uses four electrodes E1 - E4 of the same types, which are placed on forearm with 50 mm spacing for the electrodes. An arbitrary waveform generator (Model No BK Precision 4055B) was used to feed a sinu-soidal wave with frequency from DC to 10 KHz and voltage 1 mV. The potential across the electrodes are measured using a digital multimeter (Key Sight Technologies Model No. 34470A).
From Figure 4(a), The [RA||C1], [RB||C2], [RC||C3], [RD||C4] represents the resistance & capacitance combination of the Electrodes. Rskin & Rbody representing the skin and the body resistance.
From Figure 4(a), the total impedance is given by,
Total Contact SkinBody
Z =Z +Z
(1)
https://doi.org/10.4236/jbise.2019.122011 157 J. Biomedical Science and Engineering
Figure 4. Experimental setup to measure (a) equivalent impedance of skin and body between the electrodes (b) for measuring the contact impedance.
[
]
2 2
|| || ||
B C
Total Body B Skin Skin
B C
R X
Z R C R C
R X
×
= +
+ (2)
BC Total V
Z
I
=
(3)
and I VR. R
=
From Figure 4(b) the impedance of skin and body between the two electrodes EB and EC is given by,
[
]
|| || ||
SkinBody Body B Skin Skin
Z = R C R C
(4)
BC SkinBody V Z I ′ =
′
(5)
and I VR. R
′ ′ =
The contact impedance is given by,
Contact Total SkinBody
Z =Z −Z
(6)
2 2 B C Contact B C R X Z R X × =
+
(7)
where, XC2 represents the reactance
BC BC
Contact V V
Z
I I
′
= −
′
(8)
The contact impedances for the four types of electrodes considered for wearable monitoring were measured and analyzed.
2.4. Sensor Nodes and Wearable Data Acquisition Hardware
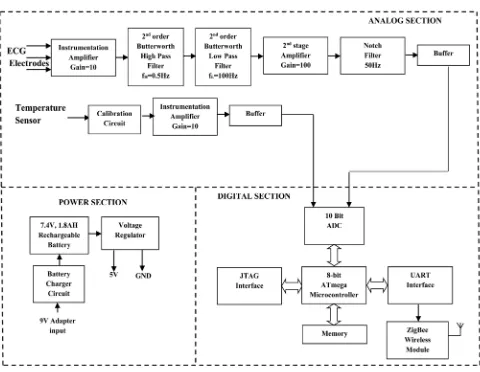
https://doi.org/10.4236/jbise.2019.122011 158 J. Biomedical Science and Engineering 2.4.1. Sensor Node 1
[image:8.595.59.539.335.707.2]The Sensor Node 1 is used to acquire ECG signal in the Lead-I configuration and body temperature from the arm pit of the subject. Figure 5 illustrates the block diagram of sensor node 1. It consists of in-strumentation amplifier for signal conditioning the weak ECG signal and the temperature inputs. Further it consists of microcontroller used for digitizing the raw inputs, wireless communication module for transmitting the sensor node 1 data to the remote station along with the power supply circuitry. The in-strumentation amplifier is built using the INA128 OP-AMP which has high Slew rate and high CMRR of the order of 130 dB. The first stage of the ECG amplifier has a gain of 10 followed by 2nd order Butterworth Bandpass filter circuit with the frequency range of 0.5 - 100 Hz. The 2nd stage amplifier has a gain of 100 followed by a notch Filter stage used to remove the 50 Hz power line frequency. The notch filter makes uses of active Twin-Tee network in the filtering stage. The other circuit consists of temperature signal conditioning circuitry with a gain of 10. The input to this amplifier is from the temperature sensor YSI409B.The conditioned signals are fed to the digital section with suitable buffers. The digital section is based 8-bit ATmega Microcontroller from Arduino. The Analog signals are digitized using a built-in 10-bit ADC. The ZigBee wireless communication module is interfaced to the UART of microcontroller. The sampling rate for the signal acquisition is at 250 samples per second. The acquired data are framed into packets and transmitted wireless to the remote monitoring station. The power supply section consists of a 7.4 V Lithium-Polymer battery at 1.8 AH rating. Regulator LM7805 is used to get 5 V and power the wearable data acquisition hardware and LD1117 3.3 V regulator is used to power the microcontroller and the wireless communication module.
https://doi.org/10.4236/jbise.2019.122011 159 J. Biomedical Science and Engineering 2.4.2. Sensor Node 2
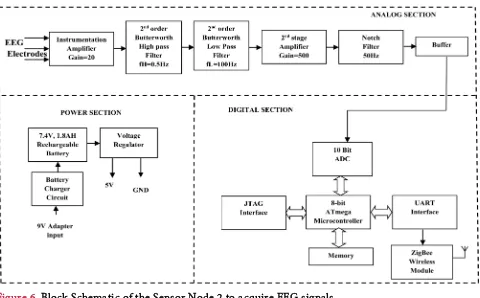
The sensor node 2 is used to acquire the EEG Signal. Figure 6 illustrates the block diagram of the sensor node 2.
It consists of signal conditioning circuit for the EEG, digital section and power supply. The overall gain of EEG amplifier is 5000 and the band pass filters used are 2nd order Butterworth filter which has the frequency range 0.5 - 35 Hz. The digital sections, power and wireless communications sections are similar to that of the sensor node 1.
2.4.3. Sensor Node 3
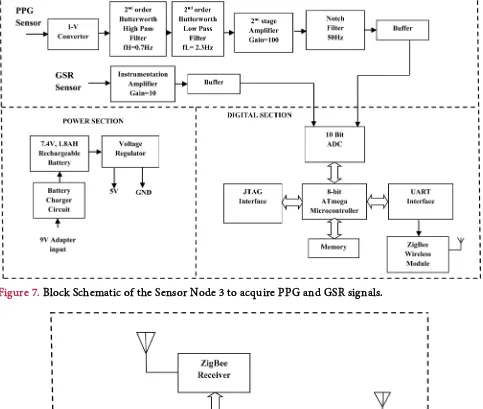
Sensor node 3 is used to acquire PPG and GSR signals. Figure 7 illustrates the block diagram of the sensor node 3.
It consists of Instrumentation and Conditioning circuit for the PPG and GSR signals. The PPG sensor uses a red light source operating at a wavelength of 670 nm with 3 mw power. The output of the photode-tector is fed to an I-V converter and signals are band limited to 0.5 - 20 Hz using a 2nd order Butterworth filter. The signals are further amplified using a amplifier (INA128) with a gain of 20.
2.4.4. Sink Node
The Sink node to acquire the data’s from the sensor nodes is as shown in Figure 8.
The physiological data acquired from the sensor nodes are received at the sink node. The sink nodes coordinate the data acquisition from the sensor nodes. The data acquired is transmitted to the remote monitoring station using Bluetooth wireless communication module. At the remote monitoring station the data is received, processed and displayed. The sink node architecture is star network and the data is read from the sensor nodes in a round robin fashion at a programmed predetermined intervals.
2.5. Blood Pressure Measurement from PTT
[image:9.595.61.541.419.717.2]The noninvasive blood pressure measurement techniques are indirect methods and are based on
https://doi.org/10.4236/jbise.2019.122011 160 J. Biomedical Science and Engineering
Figure 7. Block Schematic of the Sensor Node 3 to acquire PPG and GSR signals.
Figure 8. Block Schematic of the Sink Node.
measurement of counter pressure. The conventional cuff-based methods for blood pressure measurements are not viable in wearable physiological monitoring applications. Altenate indirect methods are being used to derive blood pressure, Pulse Transmit Time (PTT) is one of the commonly used physiological parame-ter to estimate the Systolic (SBP) and Diastolic (DBP) Blood Pressures. The PTT is measured as the inparame-ter- inter-val between the peak of R-wave of ECG and fingertip PPG signal, as illustrated in Figure 9.
https://doi.org/10.4236/jbise.2019.122011 161 J. Biomedical Science and Engineering
Figure 9. PTT measurement from ECG and PPG signal.
calibration to be carried for every individual before the measurements are being carried, which is time consuming and not feasible for wearable monitoring applications [29, 30]. The factors other than PTT that influence the correct estimation of blood pressure are heart rate, arterial stiffness, blood viscosity, age, height, weight, external temperature, location where the PPG signal is measured. A PTT based method of BP estimation considering various factors such as heart rate, age, height, weight is analyzed and by the li-near regression model with dynamic pulse transmit time analysis the following SBP and DBP equations are derived. Also the need for calibration before the measurement is not required. The systolic blood pressure (SBP) and diastolic blood pressure (DBP) for a particular pulse related to instantaneous heart rate are given by the following equations.
(
) (
) (
)
(
) (
)
SBP 0.1989 Age 0.318 HR 0.1946 WT
0.2395 HT 330.5 PTT 146.917
= × + × + ×
− × − × +
(
) (
) (
)
(
) (
)
DBP 0.0772 Age 0.1122 HR 0.0893 Wt
0.1135 HT 19.778 PTT 91.595
= × + × + ×
− × − × +
2.6. Signal Processing
The ECG signal is corrupted with different types of noises and the common noises are the baseline wander and motion artifacts, which are added due to the breathing and movement of the subjects.. The baseline noise is a low frequency noise added to the ECG signal which can be removed by use of a High Pass Filter (HPF). The motion artifacts are caused due to the relative motion of electrodes with the move-ment of the subject. These motion artifacts are high frequency noise that can be removed by use of a Low Pass Filters (LPF). These noises are filtered using digital filtering techniques using the Finite Impulse Re-sponse (FIR) as they have several advantages [31, 32]. The Kaiser window is chosen for the implementa-tion of the FIR filter to remove the presence of large oscillaimplementa-tions in both pass band and stop band, Kaiser Window function is chosen. The Kaiser window is defined by
[ ]
[ ]
2 0 0 2 1 1 0 1 0 otherwise n I Nw n n N
I β β − − = ≤ ≤ −
https://doi.org/10.4236/jbise.2019.122011 162 J. Biomedical Science and Engineering
[ ]
20 1 2 1 ! L k x I x k = = +
∑
and the ripple control parameter β is defined by
(
)
(
)
(
)
0.4
0 21dB
0.5842 21 0.07886 21 21dB 50 dB
0.1101 8.7 50 dB
A
A A A
A A β β β = ≤ = − + − ≤ ≤ = − ≥ 7.95 14.36 A N f − ≥ ∆
The filter coefficients of a digital filter is given by
[ ]
d[ ] [ ]
h n h n w n= ∗
where hd[n] is time-domain impulse response of the filter and w[n] is the window function. In the pro-posed work both LPF and HPF functions are used with Kaiser Window.
Hence, hd[n] for LPF used to remove the tremor in the bio-potential signals is given by
[ ]
1 sin 2 1 π 2 c c d c Nw n w
h n N n w − − = − −
2π c
c s f w f =
The hd[n] for HPF used to remove the tremor in the bio-potential signals is given by
[ ]
1 sin( )
π sin( )
π
d c
h n n w n
n
= −
where fc is the cut off frequency and fsis the sampling frequency. 2.7. Data Validation
The wearable physiological monitoring system was tested on 35 healthy subjects male subjects to study the consistency and reliability of the data recordings as compared to that of the standard devices. The study was carried out on 35 healthy male subjects in the age group of 25 - 87 years and their prior consent was obtained. Out of the 35 subject, one subject could not complete the task, the validation of the data was carried out with 34 subjects. The validation was carried out for 30 min on each subject during resting, walking and mild exercise conditions and the physiological parameters were acquired simulta-neously from both the devices. The systolic, diastolic blood pressure and heart rate data were analyzed sta-tistically by Bland-Altman method [33, 34] and were plotted as the difference in measurements against mean of the two measurements. The bias was calculated from the average of the differences between the two methods and precision was calculated from the standard deviation of the differences between the me-thods. The bias and precision determined were analyzed to estimate the performance of the device.
2.8. Heart Rate Variability (HRV)
trans-https://doi.org/10.4236/jbise.2019.122011 163 J. Biomedical Science and Engineering
formed to Power spectral density (PSD) by using Discrete Fourier Transform (DFT). Most commonly used HRV spectrum for analysis in frequency domain are very low frequency (VLF: <0.04 Hz), low fre-quency (LF: 0.04 - 0.12 Hz) and high frefre-quency (HF: 0.12 - 0.4 Hz). HRV is relevant to many cardiovascu-lar and non-cardiovascucardiovascu-lar diseases such as high BP, diabetic neuropathy, sudden cardiac death, myocar-dial infarction, etc. In the proposed work the time domain and frequency domain analysis of R-R and hear rate variations over the extended period of time are done and mean HR variations were computed for the subject.
2.8.1. Time Domain Analysis
HRV time domain analysis method is being considered for the study due its simplicity compared to other assessment techniques as it is directly calculated from RR interval time series [35]. In the HRV time domain analysis, RR intervals are commonly mentioned as NN (normal-to-normal) intervals. This is due to the fact that only intervals between successive QRS complexes generated by normal sinus depolarization are examined for this study [36]. The time-domain features are commonly computed using mean and the standard deviation of the RR interval series. Following are the time domain parameters computed in this study for stress classification.
• Average Heart Rate
It is the number of heart beats per minute and it is defined as
( )
Number of RR IntervalsHeart Rate HR
Duration in Minute
=
• SDNN
The standard deviation of NN intervals (SDNN) for the given segment of data, is described as the square root of the variance of the NN intervals. Since the variance in the time domain is equal to the total power in the frequency domain, SDNN describes the cyclic components accountable for variability [37]. Mathematically, SDNN is defined as:
(
)
21 SDNN
1 n
i mean
i RR RR
N = − = −
∑
where 1 n i i mean RR RR N = =∑
• SDSDThe standard deviation of the successive differences of the NN intervals describes the short-term var-iation in RR interval series. It can be described as:
(
)
21 1
SDSD
1 n
i i diff
i RR RR RR
N + = − − = −
∑
where 1 1 1 n i i i diff RR RR RR N + = − = −∑
• RMSSDhttps://doi.org/10.4236/jbise.2019.122011 164 J. Biomedical Science and Engineering
Mathematically RMSSD can defined as
(
)
2 1
1
RMSSD .
1 n
i i
i RR RR
N
+
= −
=
−
∑
• NN50 and pNN50
NN50 is the number of consecutive RR intervals that differ more than 50 msec and pNN50 is the fraction obtained by dividing NN50 by the total number of RR intervals in the given segment [39] pNN50 is utilized for the estimation of the high-frequency variation in RR interval series. Unlike RMSSD, pNN50 is much less susceptible to the presence of noise and artifact in the recording [40]. Mathematically, it is defined as:
{
1}
1
NN50 n i i 50 ms
i= RR+ RR
=
∑
− >NN50
pNN50 100%
N
= ×
2.8.2. Frequency Domain Analysis
The frequency domain parameters give the accurate and effective feature evaluation of HRV com-pared to time domain [41]. In this analysis the power spectral density (PSD) of HRV is calculated. The output gives the information about power distribution of spectral components obtained from RR intervals. The high frequency (HF) is characterised by the parasympathetic activity of the autonomous nervous sys-tem whereas the low frequency (LF) is a good indicator of both parasympathetic and sympathetic activity. The LF, HF components and also the LF/HF ratio are used to indicate the stress or fatigue level of the sub-ject under test. There is approximate correlation between time and frequency domain evaluation parame-ters [42]. The spectral features of HRV were calculated from RR interval data by power spectral density (PSD) using periodogram. The RR interval is sampled [43] at a frequency of 8 Hz. The RR interval samples were divided into overlapping segments with 50% overlap. Figure 10 shows the PSD of the RR interval data over the frequency range of 0 - 0.4 Hz.
The steps for calculating the power spectral density [44] is a) Applying FFT to RR interval data b) Applying Hanning window function with 50% overlap c) Plotting the PSD.
2.8.3. Non Linear Methods
[image:14.595.166.436.500.704.2]The nonlinear method of estimating HRV is by using Poincare plot as shown in Figure 11.
https://doi.org/10.4236/jbise.2019.122011 165 J. Biomedical Science and Engineering
Figure 11. Poincare Plot showing the correlation between Successive RR intervals.
It represents the correlation [45] between successive RR intervals. It also gives information about heart behavior based on beat to beat RR interval repetitions. The Poincare plot is typically described by two descriptors SD1 and SD2 where SD1 represents the standard deviation of the points across the line of identity and SD2 represents the standard deviation of the points along the line of identity.SD1 describes the short term variability and the parasympathetic activity of the autonomous nervous system and SD2 describes the long term variability [46] and the sympathetic activity of the autonomous nervous system. The SD1 and SD2 are calculated using the following equations.
( )
1 1
SD = Variance S
( )
2 2
SD = Variance S
where S1=
(
RR RRi− i+1)
2 RRi =(
RR RR1, 2, , RRN−1)
(
)
2 i i 1 2
S = RR RR+ +
(
)
1 2, 3, ,
i N
RR+ = RR RR RR
3. RESULTS
Figure 12 illustrates the contact impedances measured for all the four types of electrodes, from the plot of the frequency versus impedance it is observed that the variations of contact impedance of all the four types of electrodes follow the same tendency as a function of frequency.
The results were found to be in agreement with the published literature [47, 48]. The electrodes were electrically modeled as a resistance and capacitance connected in parallel, where at low frequencies the value of the impedance is by the resistance and with the increasing frequency, the contribution from capa-citance is more dominant. The electrode impedance exponentially decreases with increase in frequency. The experiment was repeated on multiple subjects and with different electrode spacing of 25mm and 30mm. The results were found to be repeatable. The type-I textile electrode was chosen for recording the bio-potential signals of ECG and EEG as its performance nearly matches with that of the wet and dry Ag-AgCl electrodes.
Figure 13 shows the photograph of the wearable system worn by an healthy individual showing the sensor nodes to acquire ECG, EEG, PPG, GSR and body temperature and sink node to transmit the ac-quired data to a remote monitoring station.
https://doi.org/10.4236/jbise.2019.122011 166 J. Biomedical Science and Engineering
Figure 12. The skin-electrode contact impedance of different types of electrodes Ag-AgCl Wet Elec-trodes, Ag-AgCl dry elecElec-trodes, Type-I textile electrode and Type-II textile electrode.
1—ECG Sensor Node, 2—EEG Sensor Node, 3—Sink Node and 4—PPG & GSR Sensor Node.
[image:16.595.221.377.365.651.2]https://doi.org/10.4236/jbise.2019.122011 167 J. Biomedical Science and Engineering
interpretation and analysis, the subjects did not have any discomfort and difficulty wearing it for longer durations while performing their routine activity. Figure 14 shows the photograph of the textile electrode integrated in the belt to acquire bio-potential signal.
Figure 15(a) illustrates the raw ECG signal acquired corrupted with 50 Hz power line interference and Figure 15(b) illustrates the power line interference filtered ECG signal. The amplitude spectrum of the processed ECG signals shows that there is no power line interference present in the ECG signal.
[image:17.595.182.420.216.374.2]The 50 Hz power line interference in ECG signal is removed [49, 50] by passing the signal through IIR-Notch, LMS filter & DWT Filter. Different performance parameters like Magnitude coherence (MSC), signal to Noise Ratio (SNR), Power Spectral Density (PSD), Percentage root mean square difference (%PRD), Mean Square Error (MSE) and Error standard Deviation (ESD) are calculated using the three
Figure 14. Textile electrode fabricated.
[image:17.595.127.470.406.687.2]https://doi.org/10.4236/jbise.2019.122011 168 J. Biomedical Science and Engineering
filtering techniques. From the evaluation of the above performance parameters we conclude that DWT filter is best for removing the 50 Hz power line interference noise compared to the other two types of fil-tering techniques.
The results evaluated for five subjects are as shown in Table 3.
[image:18.595.76.539.184.737.2]Figure 16(a) illustrates the raw PPG signal and Figure 16(b) the power line interference removed PPG signal.
Table 3. Performance parameters Estimation from the original ECG signal.
Performance Parameter ECG Signal Notch Filter IIR LMS Filter Adaptive Discrete wavelet transform
%PRD
Real Time Data
Sub-1 0.0414 0.0593 0.5945 Sub-2 0.0384 0.2637 0.513 Sub-3 0.0198 0.0203 0.2557 Sub-4 0.0201 0.0423 0.3465 Sub-5 0.0188 0.2382 0.3679 Average value 0.0277 0.12476 0.41552
MSE
Real Time Data
Sub-1 0.0004 0.0006 0.0059 Sub-2 0.0004 0.0026 0.0051 Sub-3 0.0002 0.0002 0.0026 Sub-4 0.0002 0.0004 0.0035 Sub-5 0.0002 0.0024 0.0037 Average value 0.00028 0.0012 0.00416
ESD
Real Time Data
Sub-1 0.0076 0.006 0.5945 Sub-2 0.0086 0.0098 0.513 Sub-3 0.0032 0.0034 0.2257 Sub-4 0.001 0.0041 0.3465 Sub-5 0.0015 0.0092 0.3679 Average value 0.004962 0.006712 0.41552
MSC Sub-1 0.5073 0.5204 0.9118
https://doi.org/10.4236/jbise.2019.122011 169 J. Biomedical Science and Engineering
[image:19.595.127.471.188.400.2]The amplitude spectrum of the PPG signal has confirmed the absence of power line interference in the PPG signals. Figure 17 illustrates the ECG signal acquired from ECG sensor node while the subject was performing routine activity, the raw signal Figure 17(a) is corrupted with noises such as baseline wander and tremor noises, the baseline wander is removed by Kaiser high pass filter as shown in Figure 17(b) and the tremors removed by Kaiser low pass filter as shown in Figure 17(c). The processed ECG signal is noise free and is of diagnostic quality.
[image:19.595.112.493.451.683.2]Figure 18 illustrates the EEG signal acquired from sensor node-2 to acquire EEG signal from the frontal pole regions fp1-fp2, while the subject performed routine activity. The EEG acquired from conventional
Figure 16. PPG Signal acquired from Node-3 (a) raw PPG signal (b) processed PPG signal after re-moval of power line interference.
https://doi.org/10.4236/jbise.2019.122011 170 J. Biomedical Science and Engineering
Figure 18. EEG Signal acquired from fp1-fp2 during the normal activity of the subject acquired from sensor Node-2 (a) from conventional Ag-AgCl electrode (b) dry textile electrode (c) Power Spectral Density (PSD) of Ag-AgCl electrode (d) Power Spectral density (PSD) of textile electrode.
Ag-AgCl electrodes Figure 18(a) and the textile electrodes Figure 18(b) are comparable as it is evident from the power spectral density of the EEG signal acquired from Ag-AgCl electrode Figure 18(c) and tex-tile electrode Figure 18(d).
The GSR recordings from five subjects while performing predetermined tasks such as relaxing, deep breathing, reading and performing mathematical operations are shown in Figure 19.
From the GSR recordings it is evident the GSR is low when the subjects are relaxed and the conduc-tance increases while they performed mathematical operations. The skin temperature recordings from five subjects while performing predetermined tasks such as resting, walking, exercise and recovery are shown in Figure 20.
From the body temperature, recordings it is evident that it is low when the subjects are resting and the skin temperature increases when they performed mild exercise and decreases during recovery stages.
https://doi.org/10.4236/jbise.2019.122011 171 J. Biomedical Science and Engineering
Figure 19. GSR signal acquired from Node-3 for five subjects during relaxed, reading, deep breathing and while performing Mathematical operations.
Figure 20. Skin temperature recording from Node-1 for 5 subjects during resting, walking, Exercise & Recovery stages.
The statistical analysis of the vital parameters of heart rate and blood pressure recorded from the de-veloped prototype were compared with that acquired using a standard measurement device. In the pro-posed work we have tested our system with 34 subjects with 10 average readings i.e. 340 readings have been taken from the subjects for each condition. All the above subjects were subjected to different condi-tions. First the HR, SBP, DBP were merured with the standard instruments with the help of doctor, then we tested the above readings with our system using the equations developed for SBP, DBP. Table 4 shows the readings of comparison.
The bias and precision for heart rate recorded from the developed wearable systems and standard measurement method while the subjects were performing the routine activity of resting, walking and mild exercise are measured. The bias for heart rate measured during resting, walking and mild exercise was 0.0028, 0.00035 & −0.000056 respectively. The precision for heart rate measured during resting, walking and mild exercise was 0.8231, 0.9325 & 0.9272 bpm respectively. The Bland-Altman plots for heart rate while resting, walking and mild exercise are illustrated in Figure 21(a), Figure 21(b) and Figure 21(c)
respectively.
[image:21.595.60.540.297.475.2]https://doi.org/10.4236/jbise.2019.122011 172 J. Biomedical Science and Engineering
Table 4. Heart Rate (HR), SBP, DBP of 34 subjects measured during resting, walking and exercise conditions.
Subject (Yrs) Age HR Std (bpm) RR Interval from ECG (msec) HR from ECG (bpm) Wt
(Kgs) (Cms) Ht
SBP Measured (mmHg) DBP Measured (mmHg) PTT (msec) SBP Derived (mmHg) DBP Derived (mmHg)
https://doi.org/10.4236/jbise.2019.122011 173 J. Biomedical Science and Engineering
Figure 21. Bland-Altman plots for Heart Rate comparison from 34 subjects during (a) resting (b) walking (c) exercise conditions. The limits of agreement defined by 2SD above and below the bias are shown by dotted lines.
standard measurement method while the subjects were performing the routine activity of resting, walking and mild exercise are measured. The bias for systolic blood pressure measured during resting, walking and mild exercise was −0.00045, 0.00024 & 0.00024 respectively. The precision for systolic blood pressure measured during resting, walking and mild exercise was 5.8123, 5.1233 & 6.8934 respectively.
The Bland-Altman plots for systolic blood pressure while resting, walking and mild exercise are illu-strated in Figure 22(a), Figure 22(b) and Figure 22(c) respectively.
https://doi.org/10.4236/jbise.2019.122011 174 J. Biomedical Science and Engineering
Figure 22. Bland-Altman plot for Systolic Blood Pressure comparison from 34 subjects during (a) resting (b) walking (c) exercise conditions. The limits of agreement defined by 2S.D above and below the bias are shown by dotted lines.
and standard measurement method while the subjects were performing the routine activity of resting, walking and mild exercise are measured. The bias for diastolic blood pressure measured during resting, walking and mild exercise was 0.00012, 0.00341 & 0.00014 respectively. The precision for diastolic blood pressure measured during resting, walking and mild exercise was 4.9756, 4.8745 & 4.9945 respectively. The accuracy of the system is within the limits of IEEE Standard of (5 ± 8 mmHg).
The Bland-Altman plots for diastolic blood pressure while resting, walking and mild exercise are illu-strated in Figure 23(a), Figure 23(b) and Figure 23(c) respectively.
https://doi.org/10.4236/jbise.2019.122011 175 J. Biomedical Science and Engineering
Figure 23. Bland-Altman plot for Diastolic Blood Pressure comparison from 34 subjects during (a) resting (b) walking (c) exercise conditions. The limits of agreement defined by 2SD above and below the bias are shown by dotted lines.
measured from a healthy individual while the subject was performing normal routine activities and Figure 24(b) the RR interval distribution for the same subject recorded.
The time domain parameters calculated for a normal subject during resting, walking and mild exer-cise and the results are shown in Table 5. The mean RR was measured to be 796.59 msec, minimum and maximum heart rate was 64.69 and 86.44 bpm. The SDNN is 54.02 msec, RMSSD is 61.15 msec and SDSD is 52.01 msec.
https://doi.org/10.4236/jbise.2019.122011 176 J. Biomedical Science and Engineering
(a)
[image:26.595.157.439.72.486.2](b)
Figure 24. (a) Time domain plot of RR-Intervals for 1 hour Duration; (b) RR Interval distribution.
Table 5. HRV Time Domain parameters.
SL. No Parameters Units Results
1 Mean RR msec 796.59
2 Mean HR bpm 75.32
3 Min HR bpm 64.69
4 Max HR bpm 86.44
5 SDNN msec 54.02
6 RMSSD msec 61.15
7 NN50 beats 484
8 pNN50 % 10.68
[image:26.595.55.538.541.730.2]https://doi.org/10.4236/jbise.2019.122011 177 J. Biomedical Science and Engineering
The LF, HF components and also the LF/HF ratio are used to indicate the stress or fatigue level of the subject under test and the approximate correlation between time and frequency domain evaluation pa-rameters are illustrated in Table 7.
[image:27.595.53.540.170.270.2]The power of all the four spectral power components is as shown in Table 8. The nonlinear HRV values of SD1 and SD2 are represented in Table 9.
Table 6. Frequency Domain parameters of HRV.
[image:27.595.56.538.303.421.2]SL. No Parameters Description Frequency range 1 ULF Power in ultra-low frequency (ms2) 0.003 Hz 2 VLF Power in very-low frequency (ms2) 0.003 - 0.04 Hz 3 LF Power in low frequency (ms2) 0.04 - 0.15 Hz 4 HF Power in high frequency (ms2) 0.15 - 0.4 Hz
Table 7. Correlation between Time Domain and Frequency Domain parameters of HRV. SL. No Time domain Parameters Frequency domain Parameters
1 SDNN Total Power
2 RMSSD HF
3 SDSD HF
4 NN50 Count HF
5 pNN50 HF
Table 8. Power of frequency Domain Components.
SL. No Parameters Units VLF LF HF
1 Frequency band Hz 0 - 0.04 0.04 - 0.15 0.15 - 0.40
2 Peak Frequency Hz 0.040 0.140 0.167
3 Power (ms2) 57 490 1535
4 Power (log) 4.042 6.194 7.336
5 Total Power (ms2) 2086 6 Total Power (log) 7.643
7 LF/HF ratio - 0.319
Table 9. Nonlinear results of HRV using SD1 and SD2.
SL. No Parameters Unit Value
1 SD1 (msec) 43.1
2 SD2 (msec) 50.9
[image:27.595.54.550.454.612.2] [image:27.595.56.540.647.731.2]https://doi.org/10.4236/jbise.2019.122011 178 J. Biomedical Science and Engineering
4. CONCLUSIONS
A prototype wireless sensor network based physiological monitoring system developed is aimed to give a proof of concept of a wearable system. In this development four types of electrodes were characte-rized and studied for its suitability to be used for wearable monitoring. From the bio-potential signal, re-cording it was found that the type-2 textile electrode is having good conductivity and can be easily inte-grated into the fabric and is comfortable for long duration monitoring. For the development of the above prototype system including the design and development of the data acquisition hardware the authors have spent around 2000 USD.
The subjects have reported that the chest belt fabricated using MedTex 180 is very soft and it is very comfort to wear for longer durations also. The conductivity of the material will be still good even when the subjects start sweating during the exercise conditions.
The physiological signals like ECG, EEG, GSR, body temperature, heart rate and blood pressure rec-orded from the wearable system are compared with those acquired from the Standard devices. The re-cording of heart rate, body temperature, GSR and blood pressure was found to be reliable and repeatable and the errors were in the acceptable limits.
The beat-to-beat non-invasive blood pressure measurement by the PTT based method does agree well with the simultaneously measured systolic and diastolic blood pressure while the subject is performing routine activities, during static and dynamic conditions. The better accuracy obtained even during dy-namic conditions due to acquisition of good quality ECG & PPG signals and pre-processing to remove the baseline wander and motion artifacts in the signals, calibrations carried out considering various factors such as age, arm length, height, weight of the subject. The American Association for Medical Instrumenta-tion (AAMI) recommends that the bias and precision have to be within 5 mmHg and 8 mmHg respective-ly. From the data recorded it found that for both systolic and diastolic blood pressures, the bias and preci-sion as required by the AAMI standards are achieved under static and dynamic conditions of the subject. The few recordings were outside the upper and lower limits of agreement, which are due to errors while recording as other data points are not seen clustered nearby.
The wearable physiological monitoring systems are intended to be used during the mobile conditions of the subjects, the physiological signals recorded are corrupted with unwanted noises such as powerline interference, baseline wander and motion artifacts. They are removed by signal processing techniques.
The HRV derived from ECG, which is directly controlled by the autonomic nervous system is a promising indicator for real-time fatigue estimation that can be used in various applications for soldiers in a battlefield, drivers, pilots, etc. The classification system uses time domain, frequency domain and nonli-near HRV features in this study.
Innovations in science and technology have contributed to a tremendous growth in medical care. New technological advancements in MEMS and Nanotechnology will play a major role in the future healthcare device development. In future, wearable devices will become affordable and available to use with minimal training.
There is a need to design wearable and smart sensors that are reliable and can give repeatable results without adding noise or errors. In addition, the wearable systems should provide privacy and security of the data being acquired and monitored. Further studies and more clinical evaluations are required to be carried out to evaluate the accuracy of the system for use in day-to-day use of subjects.
ACKNOWLEDGEMENTS
The authors would like to thank Dr. Karthik Udupa of Vatsalya Hospital Mysore, India for helping to collect the healthy subject’s ECG & PPG data. This study was supported by Maharaja Education Trust, Mysore, India.
AUTHOR CONTRIBUTIONS
https://doi.org/10.4236/jbise.2019.122011 179 J. Biomedical Science and Engineering
of dry electrodes for the physiological data acquisition and also helped in the critical revision of the work. M. G. Srinivasa contributed towards the data collection, testing of the hardware, data analysis and writing of the paper.
CONFLICTS OF INTEREST
The authors declare no conflict of interest.
REFERENCES
1. Raskovic, D., Martin, T. and Jovanov, E. (2004) Medical Monitoring Applications for Wearable Computing. The
Computer Journal, 47, 495-504. https://doi.org/10.1093/comjnl/47.4.495
2. Martin, T., Jovanov, E. and Raskovic, D. (2000) Issues in Wearable Computing for Medical Monitoring Appli-cations: A Case Study of a Wearable ECG Monitoring Device. Proceedings. of the 4th International Symposium
on Wearable Computers, Atlanta, GA, 16-17 October 2000, 43-49. https://doi.org/10.1109/ISWC.2000.888463
3. Kim, Y., Lee, S.S. and Lee, S.K. (2015) Coexistence of Zig Bee-Based WBAN and WiFi for Health Telemonitor-ing Systems. IEEE Journal of Biomedical and Health Informatics,20, 222-230.
https://doi.org/10.1109/JBHI.2014.2387867
4. Egbogah, E.E. and Fapojuwo, A.O. (2013) Achieving Energ Efficient Transmission in Wireless Body Area Net-works for the Physiological Monitoring of Military Soldiers. 2013 IEEE Military Communications Conference
(MILCOM 2013), San Diego, CA, 18-20 November 2013. https://doi.org/10.1109/MILCOM.2013.233
5. Moulik, S., Misra, S. and Chakraborty, C. (2015) CAPCoS: Context-Aware PAN Coordinator Selection for Health Monitoring of Soldiers in Battlefield. 2015 IEEE International Conference on Advanced Networks and
Telecommunications Systems (ANTS), Kolkata, India, 15-18 December 2015.
https://doi.org/10.1109/ANTS.2015.7413650
6. Mundt, C.W., Montgomery, K.N., Udoh, U.E., Barker, V.N., Thonier, G.C., Tellier, A.M., et al. (2005) A Multi Parameter Wearable Physiologic Monitoring System for Space and Terrestrial Applications. IEEE Transactions
on Information Technology in Biomedicine, 9, 382-391. https://doi.org/10.1109/TITB.2005.854509
7. Aqueveque, P., Gutierrez, C., Saavedra, F., Pino, E.J., Morales, A.S. and Wiechmann, E. (2017) Monitoring Phy-siological Variables of Mining Workers at High Altitude. IEEE Transactions on Industry Applications,53. 8. Hazarika, P. (2016) Implementation of Smart Safety Helmet for Coal Mine Workers. 2016 IEEE 1st International
Conference on Power Electronics, Intelligent Control and Energy Systems (ICPEICES), Delhi, India, 4-6 July
2016. https://doi.org/10.1109/ICPEICES.2016.7853311
9. Maity, T., Das, P.S. and Mukherjee, M. (2012) A Wireless Surveillance and Safety System for Mine Workers Based on Zigbee. 2012 1st International Conference on Recent Advances in Information Technology (RAIT), Dhanbad, India, 15-17 March 2012. https://doi.org/10.1109/RAIT.2012.6194496
10. Potirakis, S., Mitilineos, S., Chatzistamatis, P., Vassiliadis, S., Primentas, A., Kogias, D., Michailidis, E.T., Rang-oussi, M., Bahadır, S.K., Atalay, O., Kalaoglu, F. and Saglam, Y. (2016) Physiological Parameters Monitoring of Fire-Fighters by Means of a Wearable Wireless Sensor System. 2016 IOP Science Conference Series: Material
Science Engineering 108012011,March 2016.
11. Coca, A., Roberge, R.J., Williams, W.J., Landsittel, D.P., Powell, J.B. and Palmiero, A. (2009) Physiological Mon-itoring in Firefighter Ensembles: Wearable Plethysmographic Sensor Vest versus Standard Equipment. Journal
of Occupational and Environmental Hygiene,7, 109-114. https://doi.org/10.1080/15459620903455722
12. Bu, Y., Wu, W., Zeng, X.Y., Koehl, L. and Tartare, G. (2015) A Wearable Intelligent System for Real Time Mon-itoring Fire Fighter’s Physiological State and Predicting Dangers. 2015 IEEE 16th International Conference on
https://doi.org/10.4236/jbise.2019.122011 180 J. Biomedical Science and Engineering
13. Hiware, A. and Tet, A.D. Sudden Infant Death Monitoring Using Smart Wearable System. International Journal
of Science, Engineering and Technology Research (IJSETR), 6.
14. Fernandes, D., Ferreira, A.G., Branco, S., Abrishambaf, R., Carvalho, H., Mendes, J., Cabral, J. and Rocha, A. (2016) Energy Saving Mechanism for a Smart Wearable System: Monitoring Infants during the Sleep. 2016 IEEE
International Conference onIndustrial Technology (ICIT), Taipei, 14-17 March 2016.
https://doi.org/10.1109/ICIT.2016.7475062
15. Oliver, N. and Flores-Mangas, F. (2007) HealthGear: Automatic Sleep Apnea Detection and Monitoring with a Mobile Phone. Journal of Communications, 2, 1-9.
16. Sannino, G., De Falco, I. and De Pietro, G. (2014) Monitoring Obstructive Sleep Apnea by Means of a Real Time Mobile System Based on the Automatic Extraction of Sets of Rules through Differential Evolution. Journal of
Biomedical Informatics, 49, 84-100.https://doi.org/10.1016/j.jbi.2014.02.015
17. Paradiso, R., Loriga, G. and Taccini, N. (2005) A Wearable Health Care System Based on Knitted Integrated Sensors. IEEE Transactions on Information Technology in Biomedicine, 9, 337-344.
https://doi.org/10.1109/TITB.2005.854512
18. Pandian, P.S., Mohanavelu, K., Safeer, K.P., Kotresh, T.M., Shakunthala, D.T., Gopal, P. and Padaki, V.C. (2008) Smart Vest: Wearable Multi-Parameter Remote Physiological Monitoring System. Medical Engineering & Phys-ics, 466-477.https://doi.org/10.1016/j.medengphy.2007.05.014
19. Zheng, Y., Leung, B., Sy, S., Zhang, Y. and Poon, C.C. (2012) A Clip-Free Eyeglasses-Based Wearable Monitor-ing Device for MeasurMonitor-ing Photoplethysmograhic Signals. Conference Proceedings in IEEE Engineering
Medi-cine and Biology Society, San Diego, 28 August-1 September 2012, 5022-5025.
20. Anliker, U., Ward, J.A., Lukowicz, P., Tröster, G., Dolveck, F., Baer, M., Keita, F., Schenker, E.B., Catarsi, F., Coluccini, L., Belardinelli, A., Shklarski, D., Alon, M., Hirt, E., Schmid, R. and Vuskovic, M. (2004) AMON: A Wearable Multiparameter Medical Monitoring and Alert System. IEEE Transactions on Information in
Biome-dicine, 8, 415-427.https://doi.org/10.1109/TITB.2004.837888
21. Malhi, K., Chandra, S., Schnepper, J., Haefke, M. and Ewald, H. (2012) A Zigbee Based Wearable Physiological Parameters Monitoring System. IEEE Sensors Journal,12, 423-430.https://doi.org/10.1109/JSEN.2010.2091719 22. Mundt, C.W., Montgomery, K.N., Udoh, U.E., Barker, V.N., Thonier, G.C., Tellier, A.M., Ricks, R.D., Darling,
R.B., Cagle, Y.D., Cabrol, N.A., Ruoss, S.J., Swain, J.L., Hines, J.W. and Kovacs, G.T.A. (2005) A Multiparameter Wearable Physiologic Monitoring System for Space and Terrestrial Applications. IEEE Transactions on
Infor-mation Technology in Biomedicine, 9, 382-391.https://doi.org/10.1109/TITB.2005.854509
23. Halin, N., Junnila, M., Loula, P. and Aarnio, P. (2005) The LifeShirt System for Wireless Patient Monitoring in the Operating Room. Journal of Telemedicine and Telecare, 11, 41-43.
https://doi.org/10.1258/135763305775124623
24. Coyle, S., Lau, K.-T., Moyna, N., O’Gorman, D., Diamond, D., Di Francesco, F., Costanzo, D., Salvo, P., Trivella, M.G., De Rossi, D.E., Taccini, N., Paradiso, R., Porchet, J.-A., Ridolfi, A., Luprano, J., Chuzel, C., Lanier, T., Revol-Cavalier, F., Schoumacker, S., Mourier, V., Chartier, I., Convert, R., De-Moncuit, H. and Bini, C. (2010) BIOTEX—Biosensing Textiles for Personalised Healthcare Management. IEEE Transactions on Information
Technology in Biomedicine, 14, 364-370.https://doi.org/10.1109/TITB.2009.2038484
25. Jovanov, E., Milenkovic, A., Otto, C. and de Groen, P.C. (2005) A Wireless Body Area Network of Intelligent Motion Sensors for Computer Assisted Physical Rehabilitation. Journal of Neuro Engineering and Rehabilita-tion, 2, 6.
26. Al Rasyid, M.U.H., Lee, B.-H. and Sudarsono, A. (2015) Wireless Body Area Network for Monitoring Body Temperature, Heart Beat and Oxygen in Blood. International Seminar on Intelligent Technology and Its
https://doi.org/10.4236/jbise.2019.122011 181 J. Biomedical Science and Engineering
27. Abidoye, A.P., Azeez, N.A., Adesina, A.O., Agbele, K.K. and Nyongesa, H.O. (2011) Using Wearable Sensors for Remote Healthcare Monitoring System. Journal of Sensor Technology, 1, 22-28.
https://doi.org/10.4236/jst.2011.12004
28. Thwe, H.M. and Tun, H.M. (2015) Patient Health Monitoring Using Wireless Body Area Network.
Internation-al JournInternation-al of Scientific & Technology Research, 4, 364-368.
29. Kachuee, M., Kiani, M.M., Mohammadzade, H. and Shabany, M. (2017) Cuffless Blood Pressure Estimation Algorithms for Continuous Health-Care Monitoring. IEEE Transactions on Biomedical Engineering, 64, 859-869.https://doi.org/10.1109/TBME.2016.2580904
30. Tang, Z., Tamura, T., Sekine, M., Huang, M., Chen, W., Yoshida, M., Sakatani, K., Kobayashi, H. and Kanaya, S. (2017) A Chair for Cuffless Real-Time Estimation of Systolic Blood Pressure Based on Pulse Arrival Time. IEEE
Journal of Biomedical and Health Informatics, 21, 1194-1205.https://doi.org/10.1109/JBHI.2016.2614962
31. Mbachu, C.B. and Offor, K.J. (2013) Reduction of Power Line Noise in ECG Signal Using FIR Digital Filter Im-plemented with Hamming Window. International Journal of Science, Environment and Technology, 2, 1380-1387.
32. Arya, R. and Jaiswal, S. (2015) Design of Low Pass FIR Filters Using Kaiser Window Function with Variable Beta(β). International Journal of Multi-Disciplinary and Current Research, 3, 220-224.
33. Bland, J.M. and Altman, D.G. (2010) Statistical Methods for Assessing Agreement between Two Methods of Clinical Measurement. International Journal of Nursing studies,47, 931-936.
https://doi.org/10.1016/j.ijnurstu.2009.10.001
34. Griffiths, P. and Murrells, T. (2010) Reliability Assessment and Approaches to Determining Agreement between Measurements: Classic Paper. International Journal of Nursing Studies, 47, 937-938.
https://doi.org/10.1016/j.ijnurstu.2010.03.004
35. Oweis, R.J., Basim, O. and Al-Tabbaa, B.O. (2014) QRS Detection and Heart Rate Variability Analysis: A Sur-vey. Biomedical Science and Engineering, 2, 13-34.
36. Milagro, F.J. (2016) Poincare Plot Analysis and Graphical User Interface Development for the Study of Heart Rate Variability in Asthmatic Children. Master of Science Thesis, Tampere University of Technology.
37. Shaffer, F. and Ginsberg, J.P. (2017) An Overview of Heart Rate Variability Metrics and Norms. Frontiers in
Public Health, 5, 1-17.https://doi.org/10.3389/fpubh.2017.00258
38. Tjolleng, A., Jung, K., Hong, W., Lee, W., Lee, B., You, H., Son, J. and Park, S. (2017) Classification of a Driver’s Cognitive Workload Levels Using Artificial Neural Network on ECG Signals. Applied Ergonomics, 59, 326-332.
https://doi.org/10.1016/j.apergo.2016.09.013
39. Task Force of The European Society of Cardiology (1996) Guidelines Heart Rate Variability. European Heart
Journal, 17, 354-381.
40. Task Force of the European Society of Cardiology the North American Society of Pacing Electrophysiology (1997) Heart Rate Variability: Standards of Measurement, Physiological Interpretation, and Clinical Use.
Circu-lation, 93, 1043-1065.
41. Billman, G., Huikuri, H., Sacha, J. and Trimmel, K. (2015) An Introduction to Heart Rate Variability: Methodo-logical Considerations and Clinical Applications. Frontiers in Physiology, 6, 1-3.
https://doi.org/10.3389/fphys.2015.00055
42. Kleiger, R.E., Stein, P.K. and Bigger, J.T. (2005) Heart Rate Variability: Measurement and Clinical Utility.
An-nals of Noninvasiv Electrocardiology, 10, 88-101.https://doi.org/10.1111/j.1542-474X.2005.10101.x
https://doi.org/10.4236/jbise.2019.122011 182 J. Biomedical Science and Engineering
https://doi.org/10.1080/03091900410001662350
44. Patel, M., Lal, S.K., Kavanagh, D. and Rossiter, P. (2011) Applying Neural Network Analysis on Heart Rate Variability Data to Assess Driver Fatigue. Expert Systems with Applications, 38, 7235-7242.
https://doi.org/10.1016/j.eswa.2010.12.028
45. Brennan, M., Palaniswami, M. and Kamen, P.W. (2001) Do Existing Measures of Poincare Plot Geometry Reflect Nonlinear Features of Heart Rate Variability? IEEE Transactions on Biomedical Engineering, 48, 1342-1347.
https://doi.org/10.1109/10.959330
46. Niskanen, J.P., Tarvainen, M.P., Ranta-Aho, P.O. and Karjalainen, P.A. (2004) Software for Advanced HRV Analysis. Computer Methods and Programs in Biomedicine, 76, 73-81.
https://doi.org/10.1016/j.cmpb.2004.03.004
47. Ribeiro, D., Fu, L., Carlos, L.D. and Cunha, J.P. (2011) A Novel Dry Active Biosignal Electrode Based on an Hy-brid Organic-Inorganic Interface Material. IEEE Sensors Journal, 11, 2241-2245.
https://doi.org/10.1109/JSEN.2011.2114649
48. Xie, L., Yang, G., Mäntysalo, M., Xu, L.L., Jonsson, F. and Zheng, L.R. (2012) Heterogeneous Integration of Bio-Sensing System On-Chip and Printed Electronics. IEEE Journal on Emerging and Selected Topics in
Cir-cuits and Systems, 2, 672-682.
49. Chandrakar, C. and Kowar, M.K. (2012) Denoising ECG Signals Using Adaptive Filter Algorithm. International
Journal of Soft Computing and Engineering, 2, 120-123.