Economics has been viewed by many as the im-perial social science that will always remain valid for analyzing and predicting the course of human behaviour and social organization (Sarewitz and Daniel 2000).
in the current corporate practice, standard predic-tion methods are used to predict the revenues (either the quantitative application of extrapolation methods or qualitative expert estimations) (Macak 2006). A certain disadvantage is in the view of a new company or that penetrating a new branch, that does not have a sufficiently long history in the given production area (Wolberg 1997; Macak 2006). This fact limits the firm in its possibility to use the conventional prediction methods based on the extrapolation principle. The conventional methods need to have a sufficiently long retrospective period for a trustworthy estimation of future revenues which a newly established company does not have.
This conflict results in the demand for a revenue planning model:
– it is not necessary to know a long retrospective period data for input quantities to compile the input data, but it is only necessary to know their values in the given point in time (the point in time is rep-resented by a time unit, such as a year quarter).
OBJECTIVES AMD METHODOLOGY
Figure 1 represents the operating principle of the revenue (planning) model. The organization meets its targets by offering its goods and services, represent-ing the output from a certain transformation process (hron and Macák 2006). The revenues are achieved by appraisal of the value of the output. The output from the system is a reaction to the influence of an input stimulus – time, which is the only independent variable of the model. The transformation process itself is implemented by the mutual leverage of four influences, the amount of which is dependent on the input (time). These influences are as follows: firm
Forecast of demand through the differential description
of their effects
Předpověď poptávky s využitím diferenciálního popisu jejich vlivů
Jan HRON, Tomáš MACÁK
Department of Management, �aculty of �conomics and Management, ��ech
�aculty of �conomics and Management, ��ech
University of Life Sciences, Prague, ��ech Republic
Abstract: This demand planning method is based on the Porter’s competitive influences of the brand. concretely, it is based on the deterministic formulation of some particular factors which are influencing the demand in time. it is not necessary to know the retrospective demand to predict the future demand. That is the highest advantage of this method.
Key words: demand prediction, firm dynamics, competitors influence, customers influence, substitutes influence and para-meters of influence, utility.
Abstrakt: Tato metoda plánování poptávky po produktu (službě) vychází z Porterových konkurenčních sil odvětví. Je založena na deterministickém popisu jednotlivých faktorů, které ovlivňují poptávku v čase. Její největší předností je, že k predikci poptávky není nutné znát chování predikované veličiny v retrospektivním období.
Klíčová slova: predikce poptávky, hybnost firmy, vliv konkurentů, odběratelů a substitutů, parametry vlivů, užitek
dynamics influence (H), substitution products influ-ence (S), customers influence (O), and competitors influence (K) (Porter 1994). Each of these influences is changed by the means of its parameter with the environment – so the revenue model represents an open system (Kozesnik 1983). For example, the firm dynamics H is influenced after time by its P- param-eter (market price of a product), which is modified by its interaction with the environment. Similarly, the other parameters of the relevant influences are guided by the interaction with the environment. These parameters (time limited constants) are as follows:
a – constant of proportionality i, indicating the sen-sitivity of competitors to drop of their market share,
b – constant of proportionality ii, indicating the ratio of conversion between the cash flow from customers and their bargaining influence, µ – parameter, indicat-ing the proportion of substitutability of the product with a substitute. (The detailed characteristics and the method of determination of the parameters are given in Table 3).
The concordance of the revenue model with the reality is achieved by the openness of the transforma-tion process to the variatransforma-tions of the environment. The principle of equifinality of the output is disturbed here by the openness of the system, i.e. a different level of output (revenues) is achieved in the same period of time (i.e. by the same level of input) (hron and Macak 2006). This openness is also the cause of the casual instability of input-output behaviour of the revenue
system because the transformation process itself is affected not only by its influences, but also by vari-ations of parameters of these influences which are developed by the interaction with the environment. Furthermore, the instability of the system is induced by environmental disorders (e.g. by an unexpected entry of a new firm into the branch).
Explanation of variable inputs to the model (qualitative part of the model)
Let us assume a situation in which we are going to deviate apparently from the issue to be solved, but which illustrates the terms of variable inputs into the model. So in this illustrating case, two brothers will be served pizza for dinner, one part of which contains tuna fish and the other salami. Both brothers are very hungry and that is why each brother requests the entire pizza for himself. however, it is not pos-sible to satisfy only one brother due to the justifiable protest of the other brother. Then, four hypothetical results may occur and so they will bargain between each other: The brothers will be arguing about the size of their share until their pizza stiffens and be-comes inedible.
1. The elder brother exerts his physical supremacy and gains a larger portion of the pizza for himself. 2. The younger brother takes advantage of his
bargain-ing trick (he breaks the bargainbargain-ing rules deliber-Disturbances
INTERACTION
K: Competitors
Input: TIME
H: Firm dynamics
O: Customers S: Substitutes
P P
b a TRANSFORMATION
PROCESS
[image:2.595.126.476.67.338.2]Output: REVENUES Environment
ately). he splits the pizza into seven equal portions and eats one of the portions during the elder’s brother momentary distraction. The brothers will share the remaining six portions fifty-fifty. 3. The brothers make a settlement that the pizza will
be split into equal halves whereas the younger brother takes the half containing tuna fish as he enjoys it more. The salami part of the pizza will be left to the elder brother as he also enjoys it more. This is because he prefers the salami pizza much more to the tuna fish pizza.
As it will be explained in the following text, this illustrative situation is able to present plausibly the principle of the firm’s relation to the other factors of the sectors that decide on the amount of the firm’s market share and thus on the speed at which the revenues flow to the firm.
Let us identify cV as incomes (revenues) that can be achieved according to the research on the demand function under the given conditions during the exist-ence of the product in the market. So cVs represent the market potential of the product. in the analogous situation of the two brothers, who want to eat the pizza, cVs are the same as the utility for the other in relation to the pizza of the competing brother. The larger the pizza is (e.g. measured by weight in grams), the more advantageous it is for the compet-ing brother to get all of it for himself. he satisfies his hunger with the larger pizza. With the size of the the pizza (if it is not inedible), and providing that his competing brother feels hungry, his anxiety to get the entire pizza for himself is growing, so he selects an individual coping strategy, which is the option 2 or 3 according to his predisposition. in the characteristic of the situation of the brothers, psychosocial factors, such as loyalty towards the other brother’s hunger, are abandoned, since there is nothing like that among firms (on the contrary, the principle of insatiability without upper limits holds good among firms). So we can take for granted that the other brother’s ef-forts are proportional to the amount of the utility (the pizza weight):
endeavour = a ×utility (1) a = the sensitivity coefficient of endeavour per the ben- efit (utility) value acquired
The influence of competing firms induced by their endeavours will be apparently intensified with the growth of utility (here, not with the pizza weight) but with the amount of the market potential of the product identified as total attainable revenues cVs during the service (product) sale period. The influence of the competitors K is then formulated as follows:
CV a
K u ቈଶ
ଶ (2)
�V = total market potential of the product (i.e. revenues attained during the total sale period of service), [czK]
ʹ൨ = constant of proportionality i, indicating the sensitivity of competitors to the changes in their market shares for the given product. The influence of the competitors is also in com-pliance with the knowledge in marketing branch. The abundantly used tool to evaluate and plan the marketing production portfolio, the so-called Boston matrix, makes use of the inherent laws of equation (2) in a different form. The vertical is of the Boston matrix defines the market growth rate in respect of the previous period (last year in principle). in the matrix, it is generally recommended to enter the market that provides the product with a starting position in the so-called “Question marks” quadrant (hron et al. 2007). So these are the markets with relatively high growth rates which can absorb also the production of a new firm and vice versa, where the new firm will have an opportunity to attain a greater utility as a result of a bigger volume of sales. in the event of successful sales, the imaginary position of the firm is moved along the horizontal axis of the relative market share towards the “Stars” quadrant. These represent the most advantageous position in terms of the attained sales, but it is not usually so in terms of profits (hron et al. 2007). They must take great financial “pains” to maintain the position of the most successful firm in terms of sales, moreover, on the exacting market. The exacting market is here because the high growth rate will make a large market after some time (similarly to the amount of pizza) and it will attract a great number of new competitors. Therefore, in terms of profits, a more favourable quadrant is the one with a low market growth rate identified as “cash cow”. Much like the small pizza, it is not good for the competing brother to struggle and get it for himself (he may go to his fridge to get some other food), a lot of firms are not interested in struggling for a small market and they focus their attention on other branches.
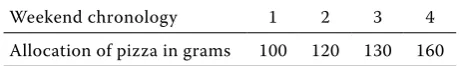
elder brother, thanks to his physical dispositions, will always get the entire pizza for himself. The younger brother does not want to make it up with his week-end fasting and that is why he asks the parents for a bigger portion of pizza and he hopes that due to the bigger weight, his elder brother will eat only part of the whole pizza. in the following four weekends, the brothers will always have bigger portions of pizza, but the situation that the elder brother would not be able to eat the whole pizza will never occur. The situation during four weeks is indicated in Table 1.
Table 1 shows 3 types of quantity in terms of the qualitative aspect. At first, Table 2 makes it possible to obtain the information on the total allocation of pizza in four weekends, i.e.
Total weight of pi��a allocated in four weekends m:
m = 100 + 120 + 130 + 160 = 510 g (3) Furthermore, it is evident from the above mentioned text that the elder brother has always obtained the whole pizza (maximum individual utility), but not for nothing. he has always obtained it due to his physical supremacy. We can expect that the younger brother will not manage to change his vigour in terms of his physical development during the four weeks and the play of forces remains unchanged. it can be deemed that the elder brother will make the same efforts each weekend to win in the competition for pizza. The effort can be characterized as a physical activity pursued by the elder brother for a certain period of time. Let us say that the physical activity was represented by the maximum assignment (the brother struggled “fully” so as not to risk a defeat) and the length of the assignment has always lasted the same period of time, e.g. one minute (the differ-ence in vigour has not changed).
After some time, the elder brother realizes that, in terms of his immediate utility, it is not only important what he has achieved but also at what price, so in our case, what period of time it took. We can then find out how quickly the elder brother attained a certain utility. he will say to himself: “in four weekends, i have attained the utility of 510 grams of pizza. in comparison with my brother, i can be satisfied. But can i be satisfied also with the development of my own situation when i am comparing how i was in the past to how i am now?” To answer this question, the elder brother does not make do with the state
quantity of total weight of attained pizza, but he must get an idea of efficiency in getting the utility each weekend. So:
Weekend 1:
he got pizza, weight m1 =100 g per 1 minute effort Weekend 2:
he got pizza, weight m2 =120 g per 1 minute effort Weekend 3:
he got pizza, weight m3 =130 g per 1 minute effort Weekend 4:
he got pizza, weight m4 =160 g per 1 minute effort. Formally, we can put down the fruitfulness of the elder brother in the individual weekends as a unit of utility (one gram of pizza, for example) versus the period of time in which he got it. Let us select one minute as the basic unit of time. Then the utility U (in the form of pizza weight) in the individual periods is given by the following equations:
»¼ º «¬ ª
min 1
100 1
1
1 mt g
U , «¬ª »¼º
min 1
120 2
2
2 mt g
U
»¼ º «¬ ª
min 1
130 3
3
3 mt g
U , «¬ª »¼º
min 1
160 4
4
4 mt g
U (4)
it is evident for the elder brother that the develop-ment of his situation is favourable to him. he can see that each following weekend he got a little bigger piece of the pizza after making the same efforts (the time of their duel always took one minute). Since the brother is consistent, he wants to know in which weekend he achieved the greatest difference in the attained util-ity in comparison with the previous weekend. This means that he will find out the difference in attaining the relative utility (grams of pizza) per period of time (time of struggle for pizza).
The difference in the relative utility ΔU1 between weekend 1 and weekend 2:
»¼ º «¬ ª
'
min 20 100 120 1 2
1 U U g
U (5)
The difference in relative utility ΔU2 between week-end 2 and weekweek-end 3:
»¼ º «¬ ª
'
min 10 120 130 2 3
2 U U g
U (6)
The difference in relative utility ΔU3 between week-end 3 and weekweek-end 4:
»¼ º «¬ ª
'
min 30 130 160 3 4
3 U U g
U (7)
[image:4.595.62.292.732.765.2]The elder brother is not only able-bodied, which enables him to get the pizza for himself on a reg-ular basis, but he is also educated in economics. Therefore, he ponders in this way: “in my situation, during the last four weekends, i can be satisfied with Table 1. Allocation of pizza during four week period
Weekend chronology 1 2 3 4
both my younger brother and myself. The fact that each following weekend i was always able to obtain a heavier pizza portion for myself enabled me to raise my body weight. i would like to know what impact all of that had on my financial situation.” The fact that the elder brother was able to eat his fill four consecutive weekends always free of charge resulted in financial savings because he did not have to spend his own money on getting food. The questions are: how much did the brother save each weekend and what is the relative change in savings between the individual weekends?
For the conversion of the utility from the weight of the attained pizza into a financial utility (profit), it is necessary to convert the weight of unit (gram) into a monetary unit (czK). it is necessary to find out the price of one gram of the pizza for this conversion. Let us suppose that the price of one gram of pizza every weekend, p, equals to 0.1 czK.
Then we can find out the monetary utility PU in the individual weekends according to the equation (8):
»¼ º «¬ ª u
min Kþ
t m p
PU ൨ (8)
where p = price of one gram of pizza (czK)
And then we can find out the difference in the monetary utility between the individual weekends:
i i i
i i
i
i PU PU p mt p mt
PU u u
'
1 1
1 (9)
where i = a notation for individual weekends: i ∈ 〈1, n〉
Let us mark: p × mi = cvi – this is the financial value of one gram of pizza, (monetary savings of the brother).
After filling the variable cvi in the previous equa-tion (9), the following is obtained:
1 1
1
1 PU cvt cvt tcv PU
PU i
i i
i i i i i
'
'
(10)
And here, it is hold true that the time to get pizza is the same each weekend:
t1 = t2 = ... = tn, n = 4
it is then possible to write the difference in monetary utility between individual weekends in the form:
i i i tcv PU '
' (11)
The equation (11) predestines the brother’s behav-iour in the situation in the week five. Let us assume that the brother keeps in mind that he always got a piece of pizza that was bigger than the previous one in each of the previous four weekends. Furthermore, let us assume that he has not yet surfeited on the pizza.
how will he behave when he sees a little bigger piece of pizza than the previous four ones for the fifth time? owing to the positive and even growing difference in monetary utilities
i i i tcv PU '
' , he will be strongly
motivated to struggle for the fifth piece of pizza. now we can proceed from the situation of the brothers to that of a firm which offers its product in the given market (service or product). Unlike the elder brother, the firm does not struggle for the pizza weight but for the revenues from sales of its product. Let us say that the revenues of the firm from sales of the given product in past four quarters are given by the following Table 2:
As it was already mentioned, the firm in its entre-preneurial efforts does not struggle for getting the pizza weights but for getting as large market share as possible to ensure it the biggest possible revenues. it is necessary to ensure in this part of the text how the firm decides on its production portfolio. At first, it is interested in a relative change in the saleability rate of the given product (see e.g. the horizontal axis of the Boston matrix). This means that the change in the speed at which the product achieved the revenues in the past period against the following one is moni-tored. in the case that the size of the total market remains approximately at the same level and the time in which the firm attains its sale amounting to e.g. 100 monetary units goes down, then it evidently had to increase the relative market share for its product. This is a positive information and without knowing other pieces of information (from the production costs area for instance), every analyst would recom-mend to launch the product into the market and it is likely that a certain investment into the product innovation would be recommended.
[image:5.595.305.530.285.337.2]The firm, influenced by profits as the limiting factor, is forced to monitor, in addition to the revenues from the product sales, also the expenditures caused by the product. on this account, the firm is interested in the selling price of each single product in addi-tion to the variaaddi-tion of the speed at which it attains a certain amount of revenues. A higher selling price of the product, which the market is able to absorb, gives the firm a higher profit margin and the firm is more encouraged to keep the given product in its portfolio. Table 2. revenues of the firm from sales of the given prod-uct
Previous quarters of year (ti) 1 2 3 4 revenues from sales of
product �Vi (in millions
conversely, the decreasing market price of the product indicates the law which the macroeconomists freely formulate as “Prices clean markets”. The decreasing market price of the product will result in a decrease in the profit margin of the product and this starts acting as a demotivating factor for continuation in the production (namely when other branches show a growing trend of the average profit).
it is evident that the product’s utility value, meas-ured by the profit quantity in practice, determines whether to retain the product in the market or to remove it from the market. Upon rational acting, the firm considers in the same manner as the elder brother assessed his own situation as to the relative changes in monetary utilities ΔPUi. So the firm makes a decision according to its variations of the speed of attained revenues �V/t and according to the price of the service p, which is accepted by the market. if we introduce an artificial variable, which represents the motivation to keep the given product in its portfolio and if we call it Dynamic effect of product H, then we can express its value in an analogy of the elder brother’s change in monetary utility as:
2 2
dt CV d P
H u (12)
Where:
P = is the product’s market price in period of time t �V = are revenues attained in the unit of time t
2 2
dt CV
d = an instantaneous variation of speed at which
the revenues from the given product are at- tained.
The term 2 2
dt CV d
is in the analogy
i i i tcv PU '
' that
characterized the difference in the monetary utility of the brother between the individual weekends. The same way as the elder brother determined to get the pizza for himself in the following weekend ΔPUi ≥ 0, and on the top of it, the change in utility showed an increasing trend, the firm is also motivated to keep the product which does not decrease its relative market share (i.e. 2 2 t0
dt CV
d ) in the portfolio. And this is
not a loss-making one (i.e. P > total costs per one product). in other words, the prerequisite for the validity of (12) is the fact that the product price P is higher than the total unit costs of the product.
We will now pay attention to the characteristics of the relation between the customer and the supplier. Thanks to these characteristics, we can set up a di-mensional term, which indicates the impact of the bargaining influence of the suppliers. in the situation of the two brothers, their parents are the suppliers of the utility who provide the brothers with certain grams
of pizza every weekend (although without any key for its division). By the fact that the parents enable (as a result of the previous situation regarding the elder of the brothers) to satisfy hunger – an essential need for life, they create a certain degree of dependence of the brothers on the declaration of their own will, though. of course, in the case of scarcity either brother might manage to get food in different ways but this is not sure and it is far less comfortable. The parents gain their influence on their sons by the utility provided by them. This influence enables the parents to impact the development of their sons according to their ideas and owing to the fact that the satisfaction from a suc-cessful upbringing of their sons comes into existence (a certain type of utility). Even though the utility is of a different type for each party, the temporal percep-tion of this utility value by both parties, by both the brothers and the parents, is the same. neither the parents nor the brothers do evaluate their situation towards themselves (as it is in the case of the relative change in utility of the elder brother)
i i i tcv PU '
' ,
demonstrating the dynamic influence of the product
H),but towards the other party. Let us say that the parents will provide both of their sons with one pizza in the weekend one. considering the previous text, the elder brother is the only one to have the utility from it. The younger brother then complains about his hunger to his parents. They behave sensibly and they provide the brothers with two equal pizzas for the following weekend. By the fact that they provided the value, they can make use of their influence on making a decision that one pizza belongs to either of them. Both parties are rejoicing at the resulting situation because it is intuitively apparent that there has been some progress compared to the previous weekend. The younger brother is satisfied – he has had something to eat this time. The elder brother is also satisfied – he has taken some food without the necessity to battle. The parents (utility providers) are also satisfied – they do not have to solve the younger’s brother complaint and moreover, they confirmed their influence when both brothers honoured their method of the pizza division. Therefore, the brothers evalu-ate the utility provided by their parents after time as the utility attained in a certain interval, which is virtually the speed of the utility.
“consumer”is affected. The question is how it is pos-sible to express the influence of the parents (utility suppliers)? Let us look at it through the eyes of the younger brother. it is apparent that in the situation of at least partial dependence on parents (the son is not of age), his willingness to respect the rules of his parents in the given period in relation to the total satisfaction (utility) which his parents gave him in this period. The weekend 1 took time t1 and the brother had nothing of the pizza, so the weight of the pizza he got m1 = 0 g.
if we isolated the situation from other benefits from the parents’ son status, the influence of the parents
o in the period of weekend 1:
¸¸ ¹ · ¨¨ © § |
1 1 1 f mt
o (13)
As the restriction of the son (influence of par-ents) and the utility is not the same for the son, it is necessary to find out a “conversion factor” between these categories. Let us suppose for illustration that the son is willing to accept an additional restriction (a new rule of the parents) for 1 000 g of pizza dur-ing the period t1. Then the conversion parameter between the influence and utility b equals to the term: Acceptation of one rule during one weekend for 1 000 g of pizza:
» ¼ º «
¬ ª u u
pizza g 000 1
weekend rule
m t o
b (14)
We could call this coefficient as the “gratitude” coefficient.
The parents had the following influence on the younger son during weekend 1:
0 1 0 001 . 0 1
1
1 bumt u
o (15)
As shown by equation (15), the younger brother could hardly be willing to accept any restriction from his parents after the weekend has expired. There were, let us suppose, two 100 g pizzas available.
The influence of the parents on their younger son during weekend 2 was as follows:
1 . 0 1 100 001 . 0 2
2
2 bumt u
o (16)
The son ate his fill, but due to his daintiness (low value of the gratitude coefficient b), he is not willing to respect the new rule given by his parents. For the rule to be respected, it would be necessary to increase ten times the utility delivered by the parents during the weekend.
now we can convert the utility in the form of the pizza weight to the financial utility cv much like when setting up the dynamic influence of product H
to convert the utility in the form of the pizza weight into the financial utility cv.
Again, let us specify p × mi = cvi – which is the financial value of one gram of pizza. Then the gen-eral form of terms (15) and (16) is altered to the equation:
i i i b cvt
o u (17)
This is the parental influence in the period of time ti versus the financial utility. in the case we would expect that the o-value is a continuous variable, we could find out the influence not only within the t -interval, but also the instantaneous value of influence after time (in a zero interval, though).
The term (17) for the value of the instantaneous in-fluence after time will be turned into the following:
dt cv d b
o u ( ) (18)
in the terms of revenues, a minor customer rep-resents a relatively small utility for a firm, therefore, he/she cannot give enough motivation for the firm to provide the customer with an extra benefit (e.g. in the form of a quantity discount). The influence of a minor customer on a firm’s behaviour can be regarded as negligible. So we can suppose that the influence of the customer Oon the firm, in relation to the utility provided by the customer in the form of revenues �V per the period of time t,isthe sameas in the situation of the parental influence on the son. it is then:
t CV b
O u (19)
where: b …(czK/year) is the constant of proportionality ii, indicating the conversion ratio between the cash flow from customers after time and their bargaining influence (this influence will be shown for example, by a decrease in the unit price of the product for the given customer).
The term (20) for the value of instant influence after time t is turned into the form:
consumer’s instantaneous bargaining influence – O:
dt CV d b
O u ( )
» » ¼ º « « ¬ ª
2 2
Year CZK
ቈଶଶ (20)
in a small danger of entering a new competitor or when failing to reach a sufficient amount of the free potential of the branch in the sphere of revenues �Vv, at least up to the level of UL threshold value, the influence of a newly entering firm can be neglected. After this prerequisite, the resulting equation of competing forces is simplified to:
S O K
By putting the terms versus time for individual influ-ences, the following equations come into existence:
direction x: H = – K – O – Sx (22)
After representation of individual terms as func-tions of time:
y S dt
CV d b CV a dt
CV d
Pu 2 2 u u Pu (23)
now it is necessary to modify the equation (23) in such a manner that it can explicitly express the magnitude of the revenues (yields) of the firm after time as well as the speed of the generation of firm’s revenues versus the running time:
y S CV
P a dt CV d P b dt
CV
d u u Pu
2 2
(24)
This form of equation corresponds to the diagram for the second-order linear differential equation with constant coefficients.
Typical equation to solve the equation (24) is in the form:
For hoMogEnEoUS PArT oF SoLUTion
0
2 uO
O
P a P
b (25)
And the homogeneous part of the total solution is then sought in the form:
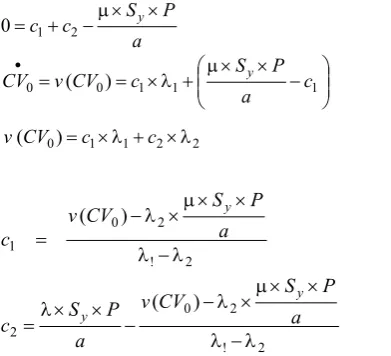
ܥܸுൌ ܿଵൈ ݁ఒభൈ௧భ ܿଶൈ ݁ఒమൈ௧మ (26)
where c1 and c2 are constants of integration, the values of which result from the predefined initial conditions of the model, which means that it must be found out at what time, with what current cash flow and with what accumulation of revenues in the initial period the firm disposes of. The homogeneous part of solution to the amount of the firm’s revenues versus time is acquired by the determination of the roots of the quadratic equation (25) and by putting the values of these roots into the equation (26):
ߣଵǡଶൌെ ܾܲ േ ටቀ ܾ ܲቁ
ଶ െ Ͷ ൈ ܽܲ ʹ ൌ െ
ܾ
ʹ ൈ ܲ േඨ൬ ܾʹ ൈ ܲ൰ ଶ
െܽܲ (27)
For non-hoMogEnEoUS PArT oF SoLUTion The non-homogeneous part of the solution to de-termine the amount of revenues versus time, or the amount of cash flows to the firm in its branch, is carried out by the estimation of the particular solu-tion �Vp. This particular solution is acquired after putting the initial conditions of the model into
equa-tion (24). Let us suppose that the firm has constant total revenues for a certain narrow time range, i.e. equal to a constant.
�V = const. ⇒�Vp
Then the equation (24) is simplified to the form:
y
P S
CV P a m
b u Pu
u 0
0 (28)
The particular solution for the total revenues is then equal to:
a P S CVP y
u u P
(29)
The amount of the total revenues versus time (�V(t)) is given by the sum of the homogeneous and par-ticular solutions:
�V(t) = �VH + �VP (30)
a P S e
c e c
CVt u O1t1 u O2t Pu yu
2 1
)
( (31)
Determination of the constants of integration
The constants of integration c1, c2, are determined in such a way that the values corresponding to the situation in which the firm was found at the begin-ning of its acting in the branch, i.e. the values valid for the initial conditions of the model, are put into the equation for the total revenues versus time (31). These values sought or the dependencies of integra-tion constants stem from the introducintegra-tion of the initial conditions. in the case that the revenues from the monitored branch and from our firm come out from the beginning of branch birth (the firm is a technological leader), it is possible to measure time in the accruals. The time at the moment of firm’s entry is t = 0, the firm has not managed to generate the revenues yet within the sales in the branch (�V = 0). And the initial amount of demand for firm’s prod-ucts is estimated according to the price elasticity of demand for products in the branch and on the price differentiation against competitors with which the firm enters the markets.
Then the amount of demand predetermines the initial speed at which the firm will attain its sales
x : 0
CV : d(dtCV) CV0 v(CV0) x
(32)
�V = 0; t = 0
the other by putting the initial conditions into the differentiated equation (31) with respect to time.
The differentiated equation (31) with respect to time:
t
t c e
e c
dt CV
d 1 2
2 2 1
1 )
( u O u O u O u O
(33)
After getting the initial conditions (32) into equa-tions (31) and (33), a system of two linear equaequa-tions with two unknown quantities c1 and c2 comes into existence
a P S c
c1 2Pu yu
0
¸¸ ¹ · ¨¨
© §
u u P O u
x
1 1
1 0
0 ( ) a c
P S c
CV v
CV y
2 2 1 1 0)
(CV c uO c uO
v (34)
2 !
2 0 1
) (
O O
u u P u O
a P S CV
v c
y
2 !
2 0 2
) (
O O
u u P u O
u u
O v CV Sa P
a P S c
y
y (35)
The parameters sought for one year period are given in Table 3.
RESuLTS AnD DISCuSSIOn
After checking the objectivity of the outputs from the revenue model, it is possible to indicate its con-tribution:
(a) it is possible to use the revenue model where we cannot make use of predictions based on extrapo-lation. That is in the situation when we do not know the retrospective period and despite this, we must estimate if the production and product offer are profitable. in the situation when we are launching a new product into the market and owing to this, we do not have previous data that can be used for prediction of the planned values, we can make use of the revenue model principle that does not need to know the past for its application.
[image:9.595.64.260.206.384.2](b) The revenue model does not try to compete with or to replace the conventional predicting procedures (stochastic, extrapolation, fuzzy decision making in indeterminateness). But it strives for being a possible alternative to them with the specializa-tion in situaspecializa-tions with a minimum knowledge of the previous behaviour of the output (predicted) quantity and with a chance to identify and describe the important factors in terms of the relation that will affect the output quantity.
Table 3. characteristic of the revenue model parameters and the method of parameter value determination* Parameter characteristic and method of value determination
a
ʹ൨ is the constant of proportionality i, indicating the sensitivity of competitors to the varia- tions in their market share for the given product. in case that no specific value of a measure is known (we do not know the component of investment of the competitors), we use the price sensi-tivity in setting up the price of competing products at the decline of price of our product.
b ൨ is the constant of proportionality ii, indicating the conversion ratio between the cash flow after time from consumers and their bargaining influence (this influence shows itself by e.g. the reduction of the unit price of the product for the given customer).
The value of b parameter is determined by the ratio between revenues falling to a firm from the ADSL branch and total revenues from all branches in which the firm operates.
P [czK] is a market price of a product in period of time t
The firm’s motive power is indicated as an average annual yield (in this case, from one ADSL connec-tion realized). A higher value represents a greater “stimulaconnec-tion” to continue in the service offered. µ coefficient showing the product’s substitutability rate by a substitute. it is determined by a mutual
ratio between the sums of all user-relevant properties of the product against the one from the substi-tute branch.
Sy Vertical component of the substitute risk causing the deflection from loyalty of our prospective cus-tomers by the fact that the substitute product provides a greater utility.
*in fact, the coefficients P, b, and a have the properties of a constant only for a certain period of time. The coefficients
(c) The revenue model is paradoxically based on the deterministic approach, although it comes from the indeterminateness of information on the investigated quantity (only from the initial conditions presented in our situation by equation (32) – the initial speed of revenues, the revenues at the beginning of the period). This paradox is achieved by a different level of knowledge in an investigated (predicted) quantity (we do not know much about it) and under influences that will affect it in the future (we can determine their behaviour after time). it is possible to determine the behaviour of inputs after time thanks to the fact that all influences in the branch (taken ac-cording to Porter [1994]) are characteristic by their target orientation. This target orientation of influences is manifested by the purposefulness of time variations of all inputs into the model. nevertheless, the purposefulness is opposed to the accidentality and thanks to that, the natural neutralization of uncertainty and indeterminate-ness after time behaviour of inputs to the model will take place. This neutralization of uncertainty and indeterminateness is what justifies the use of the deterministic approach.
COnCLuSIOn
As we very well know, a basic line of communi-ties in the developed (advanced) countries begun to radically change after the end of the Second World War. These deep social changes contribute to the effect - which usually characterized like transforma-tion from an industrial society to companies to an informative society. Just a fast-growing role of the information (suitable according to syntactical and pragmatic standards at its recipient), is a dominant characteristics of a new society (hron and Macak 2008). For this reason, it is necessary to develop new methods for transforming data into knowledge. There is a new method designed for the purpose to predict
revenues which are represented by the result of the paper. This model designed for prediction creates a new tool to support the managerial decision making. As any method working with quantities that may have a certain amount of accidentality, it may fail when applied. Even though the method sometimes fails, it is good that it is available. More methods for investiga-tion of the same phenomena, but based on a differ-ent principle, enable the mutual verification of their objectivity without the necessity for the investigated phenomena to occur (Kozesnik 1983; Wolberg 1997). When, for example, i am going to make the decision on the profitability of my prospectus, i can apply two different decision making methods to it and to confront their results. in the case that the results of both methods are relatively in agreement, i can trust the attained conclusions more (each method uses a different principle, therefore, it restrains a different type of accidentality and owing to this fact, a larger set of accidental influences is reduced).
REFEREnCES
hron J., Macak T. (2008): Determination of Management capacity. Agricultural Economics – czech, 54: 49–51. hron J., Lhotska B., Macak T. (2007): cybernetics in Man-agement – Examples and Applications. czU Publishing, Prague; iSBn 978-80-213-1640-9.
hron J., Macak T. (2006): organisation equilibrium. Agri-cultural Economics – czech, 52: 147–151.
Kozesnik J. (1983): Theory of Similarity and Modelling (in czech). Academia, Prague.
Macak T. (2006): Feed-back integration between predictive and organizational models. Agrarian perspectives Xi, ČzU, Prague; iSBn 80-213-1531-8.
Porter M.E. (1994): competition Analysis (in czech). Prague, Victoria Publishing; iSBn 80-85605-11-2. Sarewitz D.r. (2000): Science, Decision Making and the
Fu-ture. island Press, Washington; iSBn 1-55963-775-7. Wolberg J. r. (1997): Prediction Analysis. D. Van nostrand
company, Princeton, new Jersey; iSBn 80-6261025-6. Arrived on 5th March 2010
�ontact address:
Jan hron, Tomáš Macák, czech University of Life Sciences Prague, Kamýcká 129, 165 21 Prague 6-Suchdol, czech republic