Preparation of TiB
2–SiC Eutectic Composite by an Arc-Melted Method
and Its Characterization
Wen-Jun Li, Rong Tu and Takashi Goto
Institute for Materials Research, Tohoku University, Sendai 980-8577, Japan
TiB2–SiC system composites were prepared using TiB2and SiC powders as starting materials by an arc-melted method in Ar atmosphere. The TiB2–SiC system was binary eutectic. The eutectic composition was 40TiB2–60SiC (mol%) showing a labyrinth texture. The hardness of the eutectic composite was 27 to 30 GPa at the loads from 0.98 to 9.8 N. The electrical conductivity of the composites increased with increasing the content of TiB2. The electrical conductivity of the eutectic composite slightly decreased from 6.5 to6:1105Sm1 with increasing temperature from 298 to 1200 K. The thermal conductivity of the composites increased with increasing the content of SiC. The thermal conductivity of the eutectic composite decreased from 70 to 45 WK1m1with increasing temperature.
(Received June 27, 2005; Accepted September 26, 2005; Published November 15, 2005)
Keywords: TiB2–SiC, eutectic, composite materials, arc-melted method, microstructure
1. Introduction
Silicon carbide (SiC) has some excellent properties, such as high hardness and wear resistance, excellent corrosion, thermal shock and oxidation resistance, and good high temperature strength, which has been used as numerous structural and wear parts,e.g.heat exchanger, metal working parts, nozzles.1–6) However, the low fracture toughness (around 2 MPa m1=2) of SiC limits its more extensive usage. Titanium boride (TiB2) is also an excellent engineering material with high electrical conductivity, thermal conduc-tivity and hardness.7–12)The addition of TiB2was found to be effective to increase the fracture toughness of SiC.13)
There-fore, the TiB2–SiC composites could be an excellent candidate engineering material with the combined properties of TiB2and SiC.
TiB2–SiC composites are commonly prepared by directly mixing TiB2 and SiC powders and then hot pressing the powder mixture. Pan et al. reported the relative density of TiB2–SiC composites hot-pressed at 2251 K and 17 MPa for 7.2 ks was 95.2 to 99.6%.14,15)Recently, a reactive sintering
method16–23) was applied in the fabrication of TiB2–SiC
composites. Blanc et al. has described the preparation of TiB2–SiC composites from SiC, TiO2, B4C and a phenolic resin by reactive pressureless sintering and obtained the TiB2–SiC composites of 98% theoretical density.16)Zhanget al. reported the preparation of TiB2–SiC composites of elongated TiB2 reinforcing grains by reactive hot pressing from the reaction of Si, TiH2and B4C at 2273 K, 30 MPa for 3.6 ks.17)The bending strength and fracture toughness of the
composite of 96% theoretical density were 408 MPa and 4.8 MPa m1=2 higher than that of hot-pressed composites. This result suggests that the bending strength and fracture toughness of TiB2–SiC composites can be improved by optimizing their microstructures.
Directionally solidified eutectic composite ceramics can be attractive materials because of their self-assembled micro-structure and high thermodynamic stability up to near the melting temperature. Recently, we have reported the prep-aration of SiC–B4C and TiB2–B4C eutectic composites by a floating zone method and their particular microstructures and properties. The oxidation resistance and fracture toughness of
B4C were improved by the addition of SiC and TiB2, respectively.24,25)On the other hand, an arc-melting method
is a convenient technique for synthesizing the refractory eutectic ceramics and studying the relationship between composition and microstructure. In the past, no paper has reported the relationship of phase vs. composition through a melt-solidification process in the TiB2–SiC system. In this paper, TiB2–SiC composites were synthesized by an arc-melted method, and their microstructures and some proper-ties were characterized.
2. Experimental Procedure
TiB2and SiC powders were used as starting materials. The powders were weighed and mixed in an agate mortar by adding a small amount of ethanol. The mixtures of powders were then pressed into disks with 10 mm in diameter at 30 MPa. The pellets were melted and solidified by an arc-melted method on a water-cooled copper base in Ar atmo-sphere.
The phases of specimens were determined by X-ray powder diffraction (XRD). The microstructure was observed by scanning electron microscopy (SEM). The hardness of TiB2–SiC composites was measured by a Hardness Tester (Akashi, MVK-E) by averaging values of randomly indented 30 points. The fracture toughness were calculated from the eq. (1):26)
KIc¼0:0719ðP=C3=2Þ ð1Þ
wherePis the indentation load (N) andCthe half of average cracks length (m). The electrical conductivity was measured in Ar atmosphere by a dc four-probed method for rectangular specimens. The specimens were cut from each arc-melted billets and then ground to form the bars whose long axis was perpendicular to or parallel to the growth direction. The thermal conductivity was measured in a vacuum by a laser flash method using disk specimens. The specimens were cut along the growth direction and ground to form the disk with thickness of 1 mm. The electrical and thermal conductivity measurements were conducted in the temperature range between room temperature and 1023 K.
3. Results and Discussion
3.1 Microstructure of TiB2–SiC composites
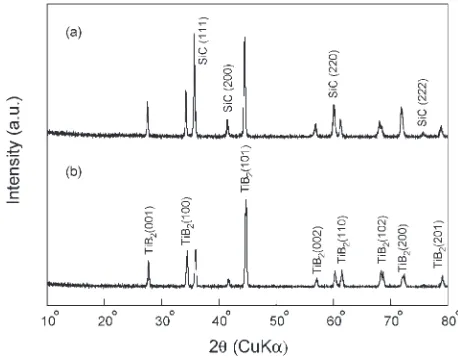
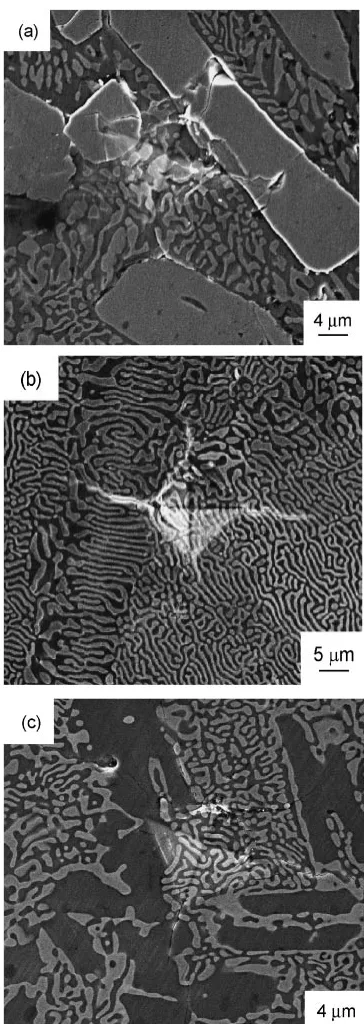
[image:2.595.310.539.138.317.2]TiB2–SiC composites were melted by an arc-melted method and had no serious vaporization and decomposition of SiC. Figure 1 shows the XRD patterns of TiB2–SiC composites at the composition of 30TiB2–70SiC and 50TiB2–50SiC (mol%). The phase of specimens was TiB2 (hexagonal) and SiC (cubic,type) and no other compounds were detected. Figure 2 shows the microstructure of TiB2– SiC composites indicated in Fig. 1 for cross-section perpen-dicular to growth direction. The elongated prismatic SiC phase co-existed with eutectic texture was observed at the composition of 30TiB2–70SiC [Fig. 2(a)]. It can be seen that the SiC content was higher than that of the eutectic composition. The microstructure of TiB2–SiC composite consisted of prismatic TiB2phase and eutectic microstructure at the composition of 50TiB2–50SiC [Fig. 2(b)]. Therefore, it is understood that the TiB2–SiC system is binary eutectic. The eutectic composition was found to be 40TiB2–60SiC because only the typical lamellar texture was identified. Figure 3 shows the microstructure of 40TiB2–60SiC compo-site for the cross-section perpendicular to and parallel to the
growth direction. The 40TiB2–60SiC composite had a labyrinth-like lamellar texture. The microstructure consisted of white TiB2 and black SiC phases of 600 nm in thickness and 5mmin length. The TiB2 and SiC lamellar grains had a
Fig. 1 XRD patterns of TiB2–SiC composites at the composition of (a) 30TiB2–70SiC and (b) 50TiB2–50SiC (mol%).
Fig. 2 SEM photograph of TiB2–SiC composites for cross-section perpendicular to growth direction at the composition of (a) 30TiB2– 70SiC and (b) 50TiB2–50SiC (mol%).
[image:2.595.112.485.374.544.2] [image:2.595.101.493.589.767.2]specific orientation parallel to growth direction. Figures 4(a) and (b) show XRD pattern of the TiB2–SiC eutectic composite for the cross-section perpendicular to the growth direction and its powder XRD pattern, respectively. The increase of relative intensity of SiC(220) and TiB2(100) peaks indicated that the eutectic composite had directionally grown along the directions of SiCh110iand TiB2h100i.
3.2 Characterizations of TiB2–SiC composites
Figure 5 shows the indenter load dependence of Vickers microhardness for TiB2–SiC composites. The hardness of TiB2–SiC composites increased with decreasing the indenter load, which was in agreement with a general trend of high hardness ceramics. The hardness of the TiB2–SiC eutectic composite was higher than that of other composites probably due to the fine microstructure. The hardness of the TiB2–SiC eutectic composite was 27 to 29 GPa at the load of 0.98 to 9.8 N. This value was close to the hardness value of composites sintered at higher than 2273 K,14,16) and was greater than that sintered at less than 2273 K. The hardness of TiB2–SiC composites prepared by in-situ HIP synthesis
processing from TiH2, Si, C and B4C powders at 1773– 1873 K was 11 to 17 GPa.22)Figure 6 shows the indentation
and cracks of TiB2–SiC composites at compositions of 30TiB2–70SiC, 40TiB2–60SiC and 50TiB2–50SiC (mol%). The cracks were partially deflected, but primarily propagated in a transgranular mode. This result was different from the crack propagation path of hot-pressed composites, in which the crack traveled around TiB2 grains.13,14) These results suggested that the interface bonding strength between TiB2 and SiC grains in the eutectic composites was higher than that of sintered composites. The values of fracture toughness for
Fig. 4 XRD pattern of TiB2–SiC eutectic composite for (a) cross-section perpendicular to growth direction and (b) its powder XRD pattern.
Fig. 5 Indenter load dependence of Vickers microhardness for TiB2–SiC composites.
[image:3.595.334.516.69.581.2] [image:3.595.53.281.71.254.2] [image:3.595.52.283.310.485.2]30TiB2–70SiC, 40TiB2–60SiC and 50TiB2–50SiC (mol%) composites were 3, 4 and 4 MPa m1=2, respectively. These values were slightly smaller than 4.8 MPa m1=2 for the reactive hot-pressed composites.22)
Figure 7 shows the temperature dependence of electrical conductivity for TiB2–SiC composites perpendicular to the growth direction. The electrical conductivity of TiB2–SiC composites slightly decreased with increasing temperature showing metallic behavior. The trend was in agreement with that of TiB2. The electrical conductivity of TiB2–SiC composites increased with increasing TiB2 content because of the higher electrical conductivity of TiB2. The electrical conductivity of the TiB2–SiC eutectic composite was about 6.1 to6:5105Sm1 at temperatures from 298 to 1200 K. The electrical conductivity of the TiB2–SiC eutectic compo-site was compared with those simulated by parallel, series and particle dispersion models expressed as eqs. (2) to (4).24)
cal(parallel)¼VAAþVBB ð2Þ
cal(series)1¼VAA1þVBB1 ð3Þ
cal(matrix A)¼Að1VB1=2Þ
þ fA
1ð1V
B1=2Þ=VB1=2þB1g1 ð4Þ
whereVis volume fraction, and subscribes A and B indicate the component of the composite, respectively.cal(TiB2 matrix)
andcal(SiC matrix)represent the electrical conductivity of the
SiC dispersed TiB2matrix composite and TiB2dispersed SiC matrix composite, respectively. This result indicates that
cal(TiB2 matrix) is closer to the experimental values than cal(SiC matrix), cal(series) and cal(parallel) suggesting that TiB2
phase is connected for the cross-section perpendicular to growth direction. The electrical conductivities of the TiB2– SiC eutectic composite parallel to growth direction were 5.3 to 5:7105Sm1, which was almost the same as that perpendicular to the growth direction. Therefore, the TiB2
phase is nearly connected in the TiB2–SiC eutectic composite for any directions.
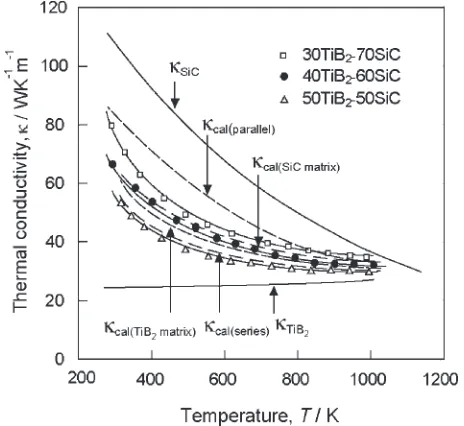
Figure 8 shows the temperature dependence of thermal conductivity for TiB2–SiC composites at temperatures from 298 to 1200 K. The thermal conductivity of the TiB2–SiC composite increased with increasing SiC content and de-creased with increasing temperature. The thermal conduc-tivity of the TiB2–SiC eutectic composite was 45 to 70 WK1m1. The thermal conductivity of the TiB
2–SiC eutectic composite was also compared with those by parallel, series and particle dispersion models, as expressed in eqs. (2) to (4), whereshould be substituted by thermal conductivity ().cal(TiB2 matrix)was much closer to the experimental values
compared to cal(series) and cal(parallel) along the growth
direction confirming that SiC particles were dispersed in the TiB2 matrix in the TiB2–SiC eutectic composite. More-over,cal(SiC matrix)was also closer to the experimental values
compared to cal(series) and cal(parallel) along the growth
direction indicating that SiC phase was almost connected in the TiB2matrix. Above results of the electrical and thermal conductivities confirmed that TiB2–SiC eutectic composite is the labyrinth microstructure, where lamellar SiC and TiB2 particles are almost linked together, respectively, in the TiB2–SiC eutectic composite.
4. Conclusions
TiB2–SiC system was binary eutectic with the eutectic composition of 40TiB2–60SiC (mol%) showing a labyrinth-like lamellar texture. The hardness of the TiB2–SiC eutectic composite was 25 to 30 GPa, which was higher than that of other compositions. The electrical conductivity of TiB2–SiC composites increased with TiB2content and slightly decreas-ed with increasing temperature. The electrical conductivity of the TiB2–SiC eutectic composite was 6.1 to6:5105Sm1 at temperatures from 298 to 1200 K. The thermal conductiv-ity of TiB2–SiC composites increased with SiC content and
Fig. 7 Temperature dependence of electrical conductivity for TiB2–SiC composites.
[image:4.595.56.286.71.319.2] [image:4.595.311.543.73.286.2]decreased with increasing temperature. The thermal con-ductivity of the TiB2–SiC eutectic composite was 45 to 70 WK1m1 at temperatures from 298 to 1200 K.
REFERENCES
1) N. Hidaka, Y. Hirata and X. H. Wang: J. Ceram. Soc. Jpn.113(2005) 143–148.
2) M. Balog, P. Sajgalik and M. Hnatko: J. Euro. Ceram. Soc.25(2005) 529–534.
3) H. Nakano, K. Watari and Y. Kinemuchi: J. Euro. Ceram. Soc.24 (2004) 3685–3690.
4) T. Yamamoto, H. Kitaura and Y. Kodera: J. Am. Ceram. Soc.87(2004) 1436–1441.
5) S. P. Lee, J. O. Jin and J. S. Park: J. Nucl. Mater.329(2004) 534–538. 6) F. V. Motta, R. M. Balestra and S. Ribeiro: Mater. Lett.58(2004)
2805–2809.
7) I. Gunjishima, T. Akashi and T. Goto: J. Jpn. Soc. Powder Metal.47 (2000) 1184–1188.
8) A. D. Mcleod, J. S. Haggerty and D. R. Sadoway: J. Am. Ceram. Soc. 67(1984) 7050708.
9) Y. S. Kwon, J. S. Kim and J. J. Park: Mater. Sci. Forum449(2004) 1113–1116.
10) J. Wachsmuth, R. Radhakrishnan and T. S. Sudarshan: Powder Metall. 46(2003) 361–364.
11) H. Tanaka, N. Hirosaki and T. Nishimura: J. Ceram. Soc. Jpn.111 (2003) 878–882.
12) W. M. Wang, Z. Y. Fu and H. Wang: J. Euro. Ceram. Soc.22(2002) 1045–1049.
13) T. Tani and S. Wada: J. Mater. Sci.26(1991) 3491–3496.
14) M. J. Pan, P. A. Hoffman and D. J. Green: J. Am. Ceram. Soc.80(1997) 692–698.
15) C. H. Mcmurtry, W. D. G. Boecker, S. G. Seshadri, J. S. Zanghi and J. E. Garnier: Am. Ceram. Soc. Bull.66(1987) 325–329.
16) C. Blanc, F. Thevenot and D. Goeuriot: J. Euro. Ceram. Soc.19(1999) 561–569.
17) G. J. Zhang, Z. Z. Jin and X. M. Yue: Mater. Lett.25(1995) 97–100. 18) M. R. Aguiar and R. Caram: J. Cryst. Growth166(1996) 398–401. 19) J. H. Lee, A. Yoshikawa, T. Fukuda and Y. Waku: J. Cryst. Growth231
(2001) 115–120.
20) F. de Mestral and F. Thevenot: J. Mater. Sci.26(1991) 5547–5560. 21) D. A. Hoke, D. K. Kim and J. C. LaSalvia: J. Am. Ceram. Soc.79
(1996) 177–182.
22) D. G. Zhu, S. K. Liu and X. D. Yin: J. Mater. Proc. Tech.90(1999) 457–461.
23) S. S. Ordan’yan, S. V. Vikhman and EV Prilutskii: Powder Metall. Metal. Ceram.41(2002) 42–46.
24) I. Gunjishima, T. Akashi and T. Goto: Mater. Trans.43(2002) 712– 720.
25) I. Gunjishima, T. Akashi and T. Goto: Mater. Trans.43(2002) 2309– 2315.