Mechanical Properties and Shape Memory Behavior of Ti-Nb Alloys
Hee Young Kim
1, Hashimoto Satoru
1, Jae Il Kim
1, Hideki Hosoda
2and Shuichi Miyazaki
1*1Institute of Materials Science, University of Tsukuba, Tsukuba 305-8573, Japan
2Precision and Intelligent Laboratory, Tokyo Institute of Technology, Yokohama 226-8503, Japan
Mechanical properties and shape memory behavior of Ti-(20–29)at%Nb alloys were investigated in order to develop Ni-free biomedical shape memory alloys. The Ti-Nb alloys were fabricated by arc melting method. The ingots were cold-rolled with a reduction up to 95% in thickness and then solution treated at 1173 K for 1.8 ks. The martensitic transformation temperature decreased by 43 K per 1 at% increase of Nb content. The shape memory effect and superelastic behavior were observed at room temperature in the Ti-(22–25)at%Nb alloys and Ti-(25.5–
27)at%Nb alloys, respectively. A small enthalpy of the martensitic transformation and a large difference betweenMsandMfwere observed in
the Ti-Nb alloys compared to Ti-Ni shape memory alloys. The maximum recovered strain of 3% was obtained at room temperature in solution treated Ti-(25–27)at%Nb alloys. The heat treatment at 573 K for 3.6 ks stabilized superelastic behavior of Ti-Nb alloys by increasing the critical stress for slip.
(Received March 17, 2004; Accepted May 17, 2004)
Keywords: shape memory alloy, superelasticity, biomaterial, smart material, titanium based alloy
1. Introduction
Shape memory alloys having good biocompatibility have been required for biomedical applications. Ti-Ni shape memory alloys have been successfully applied as biomedical materials owing to their superior shape memory property, superelasticity and corrosion resistance.1,2)However, the Ni-hypersensitivity and toxicity of Ni have been pointed out in Ti-Ni alloys.3) In order to pursue absolute safety, the development of Ni-free Ti-based shape memory alloys is strongly required.
It has been well known that the-type Ti alloys exhibit a martensitic transformation from (disordered BCC) to two metastable martensite structures, either hexagonal martensite (0) or orthorhombic martensite (00), by quenching. The
martensite structure changes from 0 to00 above a critical
alloying content.4–6)The transformation strain from theto
00 is accommodated primarily by internal twinning. The
shape memory effect is associated with the reversion of00to
in-type Ti alloys. The martensitic transformation start (Ms) temperature can be controlled by addition of alloying elements. But, for the biomedical applications, alloy designs including non-toxic elements are required. The shape memory effect has been reported in Ti-Mo alloys7–10) and Ti-V alloys.11) However, the Ti-Mo based alloys are susceptible to ! phase embrittlement. The Ti-V alloys are not suitable for biomaterial because of the cytotoxity of V.12)
Ti-Nb alloys exhibit shape memory effect. Baker reported the shape memory effect in Ti-35 wt%Nb(Ti-21.7 at%Nb) al-loy.13)Recently, the shape memory and superelastic behavior
in Ti-Nb-Sn alloys14,15) and Ti-Nb-Al alloys16) have been
reported. However, no systematic research on mechanical property, shape memory effect and superelastic behavior was reported in Ti-Nb binary alloys.
In this study, mechanical properties and shape memory behavior of Ti-Nb alloys were investigated in order to develop Ni-free biomedical shape memory alloys. The effects of Nb content on mechanical properties and shape
memory behavior were investigated by tensile tests at various temperatures and thermal cycling tests under various constant stresses. The effects of aging at low temperature on shape memory effect and superelasticity were also investigated in Ti-Nb alloys.
2. Experimental Procedures
The Ti-(20–29)at%Nb alloys were prepared by the Ar arc melting method. The ingots were cold-rolled with the reduction of 95% in thickness. The cold-rolled sheets were cleaned with ethanol, wrapped in Ti foils and encapsulated in quartz tubes under a 25 torr partial pressure of high-purity Ar, and then heat treated at temperatures between 573 K and 1273 K for 60 s–3.6 ks, respectively. The sheets were quenched into water by breaking the quartz tubes. Specimens for the mechanical tests were cut by an electro-discharge machine. The damaged surface was removed by mechanical polishing followed by eletro-polishing. Tensile tests were carried out at a strain rate of 1:67104s1 at various
temperatures. The gage length of specimens was 20 mm. Thermal cycling tests were carried out under various constant stresses. XRD (X-ray diffraction) measurements were con-ducted at room temperature with CuK to determine the constituent phases. Si powders were used as a reference.
3. Results and Discussion
Phase constitutions for Ti-(20-29)at%Nb alloys were investigated by XRD after solution treatment at 1173 K for 1.8 ks. Typical examples of XRD profiles obtained at room temperature are shown in Fig. 1 for 20 at%Nb, Ti-24 at%Nb and Ti-28 at%Nb alloys subjected to the solution treatment. All the peaks were identified as the00martensite
phase in the Ti-20 at%Nb alloy except peaks corresponding to Cu and Si of specimen holder and standard sample powders, respectively. The peaks from both 00 and were
observed in the Ti-24 at%Nb alloy. The XRD profile from the Ti-28 at%Nb alloy shows a single phase of at room temperature. These results indicate that the Mstemperature
*Corresponding author, E-mail: miyazaki@ims.tsukuba.ac.jp
is lower than room temperature for the Ti-28 at%Nb alloy and theMf temperature is higher than room temperature for the Ti-20 at%Nb alloy.
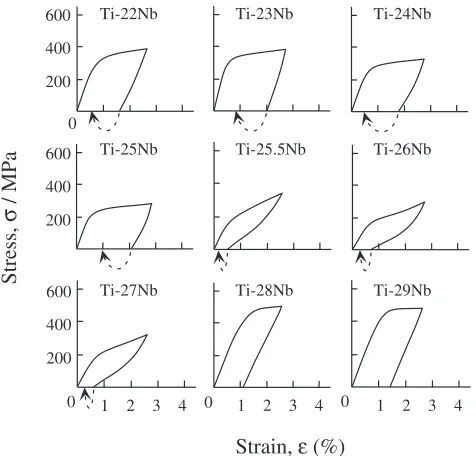
Figure 2 shows stress-strain curves of Ti-(20–28)at%Nb alloys obtained by tensile tests at room temperature after the solution treatment at 1173 K for 1.8 ks. A large elongation of 40% was obtained in the Ti-20 at%Nb alloy. The elongation decreased with increasing Nb content. The yield stress decreased with increasing Nb content from 20 at% to 26 at%. The Ti-26 at%Nb alloy exhibits double yielding. Figure 3 shows the series of stress-strain curves for Ti-(22–29)at%Nb alloys subjected to the solution treatment. Tensile stress was applied until strain reached about 2.5%, and then the stress was removed. After unloading, the specimens were heated at about 500 K: broken lines with arrows indicate the shape recovery by heating. The Ti-(22–25)at%Nb alloys show the shape memory effect. The superelastic behavior was ob-served in the Ti-(25.5–27)at%Nb alloys. The largest strain recovered superelastically was obtained in the Ti-26 at%Nb alloy. Neither shape memory effect nor superelastic behavior was observed in the Ti-(28–29)at%Nb alloys. Yield stresses were evaluated using the stress-strain curves of the Ti-(20– 29)at%Nb and they are plotted as a function of Nb content in Fig. 4. The yield stress decreased with increasing Nb content
reaching a minimum yield stress around 26 at%Nb, and then the yield stress increased rapidly from 27 to 28 at%Nb. It is considered that the increase in yield stress with decreasing Nb content for the Ti-(20–25)at%Nb alloys is due to the increase of stress for the reorientation of martensite variants. The stress-strain curve of Ti-28 at%Nb exhibits a single yielding as shown in Fig. 2, and no superelastic behavior was observed during unloading. TheMstemperatures of Ti-(28– 29)at%Nb alloys are lower than room temperature since the XRD shows a single phase of at room temperature. This indicates that the stress for inducing martensite is higher than that of the slip deformation due to dislocations in the Ti-(28– 29)at%Nb alloys.
Figure 5 shows strain-temperature curves measured during thermal cycling between 173 K and 423 K under constant stresses for the Ti-26 at%Nb alloy subjected to the solution
20 30 40 50 60
2θ
70 80
Intensity (a.u.)
(020)
α
"
(110)
α
"
(111)
α
"
Si
Si
Si
Si
Si
Si
Si
Si
Cu
Cu
Cu
Cu
Cu
Cu
(021)
α
"
(022)
α
"
(130)
α
"
(110)
β
(131)
α
"
(113)
α
"
(200)
β (211)
β
Ti-28Nb
Ti-24Nb
Ti-20Nb
Fig. 1 X-ray diffraction patterns of 20 at%Nb, 24 at%Nb and
Ti-28 at%Nb obtained at room temperature in the solution treated condition of 1173 K for 1.8 ks.
Ti-26Nb
Ti-20Nb
0 600
400
200
10 20 30
Stress,
σ
/ MPa
Strain, ε(%)
40 Ti-22Nb
Ti-24Nb Ti-28Nb
Fig. 2 Stress-strain curves of Ti-(20–28)at%Nb alloys obtained at room
temperature after the solution treatment at 1173 K for 1.8 ks.
Ti-28Nb
0 600
400
200
1 3 4
Ti-26Nb Ti-25Nb
Ti-24Nb
Strain,
ε
(%)
Stress,
σ
/ MPa
Ti-23Nb
0 600
400
200
Ti-22Nb
1 3 4 0
0 600
400
200
1 3 4
Ti-25.5Nb
Ti-29Nb Ti-27Nb
2
2 2
Fig. 3 Stress-strain curves obtained under loading and unloading for
Ti-(22–29)at%Nb alloys subjected to the solution treatment at 1173 K for 1.8 ks.
100 150 200 250 300 350 400 450 500
20 22 24 26 28 30
Nb content (at%)
Critical Stress,
σ
/MPa
Fig. 4 Nb content dependence of yield stress for Ti-(20–29)at%Nb alloys
[image:2.595.310.548.71.299.2] [image:2.595.69.273.338.445.2] [image:2.595.323.529.371.545.2]treatment at 1173 K for 1.8 ks. The test was performed in such a way that the magnitude of the applied stress was increased stepwise for each thermal cycle, using a same specimen throughout the test. The solid and dashed lines indicate heating and cooling processes, respectively. In this figure, Ms, Mf, As and Af denote the start and finish temperatures for martensitic transformation and its reverse transformation, respectively. The temperature hysteresis (Af
-Ms) was measured as about 50 K at 200 MPa. The trans-formation temperature increased with increasing applied stress. TheMstemperature is plotted as a function of applied stress in Fig. 6. There is a linear dependence between the critical stress for inducing martensitic transformation and test temperature. This dependence is known as the Clasius-Clapeyron relationship. The relationship is written as follows,
d
dT ¼
H T"¼
S
" ð1Þ
whereis a uniaxial stress,"is a transformation strain,H
is the enthalpy of the transformation per unit volume andS
is the entropy of the transformation per unit volume. From Fig. 6, the slop of the relationship,d=dTis determined to be 4.4 MPa/K. The Ms temperature under zero stress was evaluated to be 260 K by extrapolating the relationship. Taking "¼0:03 andT ¼260K, the enthalpy and entropy are estimated to be340J/mol and1:30J/molK, respec-tively. These values are much smaller than those of Ti-Ni based alloys. For instance, Takei et al.17) evaluated the
enthalpy and entropy to be 1;819J/mol and 7:69J/ molK, respectively, for a Ti-50.3 at%Ni single crystal. No distinct transformation peak was obtained by a differential scanning calorimeter in the solution treated Ti-Nb alloys. The reason is that the enthalpy of the martensitic transformation is small and the difference betweenMsandMf is large in the Ti-Nb alloys.
Figure 7 shows a series of stress-strain curves obtained at various temperatures for the Ti-26 at%Nb alloy after the solution treatment at 1173 K for 1.8 ks. The specimens were immersed and kept in liquid nitrogen or methanol whose temperature was controlled by liquid nitrogen when the test temperature was between 77 K and 273 K. When the test temperature was above room temperature, the specimens were kept in methanol heated using a pipe heater. The shape memory effect was observed for the specimens deformed at 77-273 K. The residual strain after unloading was completely recovered by heating to about 500 K. The superelastic behavior was observed at both 293 K and 313 K. The largest superelatic strain was observed at 293 K, although the superelasticity is incomplete. The critical stresses for apparent yielding were evaluated, and they are plotted as a function of temperature in Fig. 8. The critical stress decreases with increasing temperature in the temperature range between 77 K and 193 K. This is because the stress for the rearrangement of martensite variants increases with decreas-ing temperature. The minimum of the critical stress is observed at 273 K. This value is similar to theMs
temper-50MPa 100MPa 150MPa 200MPa 250MPa 300MPa Stress
200 300 400
Temperature, T / K
350MPa 1%
400MPa
Strain,
ε
(%)
Ms Mf
As
Af
Fig. 5 Stress-strain curves obtained at various temperatures for the
Ti-26 at%Nb alloy solution treated at 1173 K for 1.8 ks.
0 50 100 150 200 250 300 350 400
200 250 300 350 400
Stress,
σ
/ MPa
Temperature, T / K
Fig. 6 Temperature dependence of yield stress for the Ti-26 at%Nb alloy
solution treated at 1173 K for 1.8 ks.
0 1 3 4
Strain,
ε
(%)
Stress,
σ
/ MPa
77K
0 600
400
200
1 3 4 0
0 600
400
200
1 3 4
600
400
200
233K 193K
253K 273K 293K
313K 333K 353K
2 2 2
Fig. 7 Strain-temperature curves at constant stress for the Ti-26 at%Nb
[image:3.595.60.283.69.250.2] [image:3.595.311.547.71.307.2] [image:3.595.62.278.581.757.2]ature of 260 K obtained from Fig. 6. On the other hand, the critical stress increased with increasing temperature between 273 K and 353 K since the stress for inducing martensites increases with increasing temperature. The superlastic strain decreased with increasing temperature in the temperature range between 293 K and 353 K as shown in Fig. 7. The critical stress to induce the martensite increases with in-creasing temperature, while the critical stress for slip de-creases with increasing temperature. Slip occurs if the stress level for slip becomes lower than the stress to induce the martensite. Thus, the strain by slip deformation increases with increasing temperature, causing the recoverable strain to decrease.
It is also important to note that the critical stress for apparent yielding is almost constant at temperatures between 193 K and 273 K. This is probably due to the large temper-ature difference between MsandMf in the Ti-26 at% alloy subjected to the solution treatment. TheMf,AsandAf under zero stress were estimated to be 180 K, 210 K and 315 K, respectively, from Fig. 5. This means that both martensite andphase coexist in the temperature range between 180 K and 260 K. The shape memory effect was due to the stress induced martensitic transformation or the rearrangement of martensite variants during loading and the reverse trans-formation upon heating after unloading. It is considered that the critical stress for apparent yielding at temperature between 193 K and 273 K for the Ti-26 at%Nb alloy is associated with the stress for inducing martensite phase from the phase rather than the stress for the rearrangement of martensite variants, since the stress for the rearrangement of martensite variants increases with decreasing temperature. In the region T>Ms, with decreasing temperature to Ms, the stress for inducing martensite phase decreases to a threshold stress below which an applied stress does not induce the martensitic transformation effectively. When the test temper-ature is belowMs, thephase is unstable so that thephase easily transforms to the martensite phase under the threshold stress. It is suggested that the constant critical stress at temperatures between 193 K and 273 K is the threshold stress for inducing martensite phase from thephase belowMs.
Figure 9 shows the Nb content dependence of the Ms
temperature in Ti-Nb alloys subjected to the solution treat-ment at 1173 K for 3.6 ks. The temperature exhibiting the minimum critical stress was taken asMstemperature. TheMs
temperature linearly decreases with increasing Nb content. TheMstemperature decreased by 43 K with 1 at% increase of Nb content.
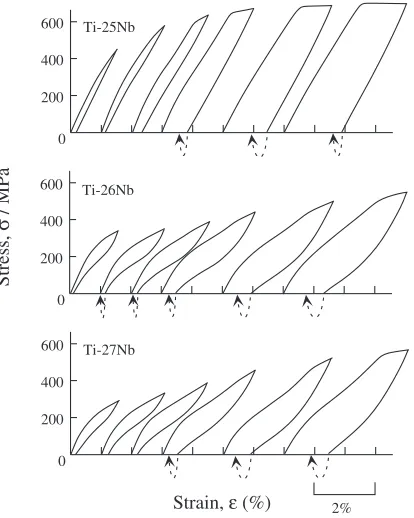
Figure 10 shows stress-strain curves of Ti-(25–27)Nb al-loys subjected to the solution treatment at 1173 K for 1.8 ks. Each stress-strain curve and strain recovery were ob-tained at room temperature by a loading and unloading cycle followed by heating. The similar measurement was repeated by increasing the maximum strain upon loading in a same sample for each alloy. The starting points of the stress-strain
0 100 200 300 400 500 600
50 100 150 200 250 300 350 400
Critical Stress,
σ
/MPa
Temperature, T/K
Fig. 8 Critical stress for apparent yielding determined from stress-strain
curves in Fig. 7.
100 150 200 250 300 350 400
24 25 26 27 28 29 30
Ms
Temperature,
T
/K
Nb Content (at%)
Fig. 9 Effect of Nb content on Mstemperature for Ti-(25–28)at%Nb
alloys.
0 600
400
200
Ti-26Nb
2% Ti-27Nb
0 600
400
200 0 600
400
200
Ti-25Nb
Strain, ε (%)
Stress,
σ
[image:4.595.67.277.72.245.2]/ MPa
Fig. 10 Stress-strain curves obtained by cyclic loading-unloading tensile
[image:4.595.321.527.73.246.2] [image:4.595.309.544.301.577.2]curves are shifted in order that they are separated each other to be distinguishable. The Ti-25 at%Nb alloy exhibited the shape memory effect. On the other hand, the superelastic be-havior was observed in the Ti-26 at%Nb and Ti-27 at%Nb al-loys at the first cycle. The magnitude of recovered strain,i.e.
the summation of superelstically recovered strain and recov-ered strain by heating up to theAf temperature, was plotted as a function of tensile strain in Fig. 11. The Ti-(25–27)at%Nb alloys reveals almost same dependence of recovered strain on tensile strain. The perfect recovery was exhibited up to about 2% strain. The permanent strain increased with increasing tensile strain. The maximum recovered strain of 3% was ob-tained at about 5% tensile strain.
The Ti-(25–27)at%Nb alloys were heat treated at 573 K for 3.6 ks after the solution treatment in order to precipitate fine
phase. Figure 12 shows the stress-strain curves obtained by cyclic tensile tests of the Ti-(25–27)at%Nb alloys subjected to heat treatment at 573 K. It is obvious that the critical stress for the first yielding increases when compared with the solution treated specimens. This means that the critical stress for inducing martensites increased by the heat treatment at 573 K. Figure 12 shows that almost perfect superelastic behavior was obtained within a tensile strain of about 2.5% for the Ti-26 at%Nb and Ti-27 at%Nb alloys. Figure 13 shows the magnitude of recovered strain for the Ti-(25– 27)at%Nb alloys. When the specimen was heated aboveAf
temperature after deforming up to 3% strain followed by unloading, only 0.2% strain remained for the Ti-26 at%Nb and Ti-27 at%Nb alloys. The maximum recovered strain of 3.4% was obtained although the recovery rate decreased with increasing tensile strain. The recovered strain and remained plastic strain for the Ti-26 at%Nb alloy are plotted as a function of applied stress in Fig. 14. The critical stress for slip was defined as a stress inducing 0.5% plastic strain. The
0 1 2 3 4 5
0
Ti-25Nb Ti-26Nb Ti-27Nb
Recovery Strain,
ε
(%)
Tensile Strain, ε (%)
[image:5.595.67.273.251.430.2]1 2 3 4 5
Fig. 11 Recovered strain as a function of tensile strain obtained by cyclic
loading-unloading tensile tests for Ti-(25–27)at%Nb alloys solution treated at 1173 K for 1.8 ks.
0 600
400
200
Ti-26Nb
2% Ti-27Nb
0 600
400
200 0 600
400
200
Ti-25Nb
Strain, ε (%)
Stress,
σ
[image:5.595.324.529.343.516.2]/ MPa
Fig. 12 Stress-strain curves obtained by cyclic loading-unloading tensile
tests for Ti-(25–27)at%Nb alloys which were aged at 573 K for 3.6 ks.
0 1 2 3 4 5
0
Ti-25Nb Ti-26Nb Ti-27Nb
Recovery Strain,
ε
(%)
Tensile Strain, ε (%)
[image:5.595.69.276.499.758.2]1 2 3 4 5
Fig. 13 Recovered strain as a function of tensile strain obtained by cyclic
loading-unloading tensile tests for Ti-(25–27)at%Nb alloys which were aged at 573 K for 3.6 ks.
0 1 2 3 4
0 100 200 300 400 500 600 700 800
Strain,
ε
(%)
Stress, σ/MPa Remained plastic strain : ST Remained plastic strain : ST+Aging Recovered strain : ST
Recovered strain : ST+Aging
Fig. 14 Effect of aging at 573 K for 3.6 ks on the recovered strain and
[image:5.595.324.526.580.758.2]critical stress for slip was obtained as 390 MPa and 520 MPa for the solution treated specimen and the aged specimen, respectively. As a result, the higher critical stress for slip resulted in the stable superelastic behavior in the aged specimens. It is suggested that the increase of critical stress for slip is due to the precipitation ofphase during aging. It is also important to note that the shape memory effect and superelastic behavior of Ti-Nb alloys can be improved by heat treatment. But, the systematic research including micro-strucutral observation is required to clarify the effect of aging treatment on transformation and mechanical properties of Ti-Nb alloys. Based on the above results, it can be concluded that Ti-Nb alloys are promising for the biomedical shape memory and superelastic alloys. Further research on the effect of alloying element and thermo-mechanical treatment on the mechanical properties is needed to improve the shape memory and superelastic properties of Ti-Nb alloy systems.
4. Conclusions
(1) The martensitic transformation start temperature (Ms) decreased by 43 K with 1 at% increase of Nb content. The shape memory effect and superelastic behavior were ob-served in Ti-(22–25)at%Nb alloys and Ti-(25.5–27)at%Nb alloys, respectively, subjected to solution treatment at 1173 K for 3.6 ks, respectively. Neither shape memory effect nor superelastic behavior was observed in Ti-(28–29)at%Nb alloys.
(2) The critical stress for inducing martensitic transformation increased with increasing test temperature. The enthalpy and entropy for the martensitic transformation were estimated to be340J/mol and1:30J/molK, respectively.
(3) The maximum recovered strain of 3% was obtained at room temperature in the solution treated Ti-(25–27)at%Nb alloys. The low critical stress for slip deformation caused the superelasticity not to reveal a large strain. The aging treatment at 573 K for 3.6 ks increased the critical stress for slip and stabilized the superelastic behavior of Ti-Nb alloys.
Acknowledgments
This work was partially supported by the 21 Century Center of Excellence Program and the Grants-in-Aid for Fundamental Scientific Research (Kiban A (1999–2001), Kiban A (2002–2004)) from the Ministry of Education, Culture, Sports, Science and Technology, Japan.
REFERENCES
1) Y. Oshida and S. Miyazaki: Corrosion Engineering40(1991) 1009–
1025.
2) M. Semlitsch, F. Staub and H. Webber: Biomed. Tech.30(1985) 334–
339.
3) S. Shabalovskaya, J. Cunnick, J. Anderegg, B. Harmon and R. Sachdeva: Proc. First Inter. Conf. Shape Memory and Superelastic Technologies, (SMST, 1994) pp. 209–215.
4) R. Davis, H. M. Flower and D. R. F. West: Acta Metall.27(1979)
1041–1052.
5) T. Ahmed and H. J. Rack: J. Mater. Sci.31(1996) 4267–4276.
6) R. Davis, H. M. Flower and D. R. F. West: J. Mater. Sci.31(1979) 712–
722.
7) W. F. Ho, C. P. Ju and J. H. Chern Lin: Biomaterials20(1999) 2115–
2122.
8) T. Grosdidier and M. J. Philippe: Mater. Sci. Eng.A291(2000) 218–
223.
9) H. Hosoda, N. Hosoda and S. Miyazaki: Trans. MRS-J26(2001) 243–
246.
10) H. Y. Kim, Y. Ohmatsu, J. I. Kim, H. Hosoda and S. Miyazaki: Mater.
Trans.45(2004) 1090–1095.
11) T. W. Duerig, J. Albrecht, D. Richter and P. Fischer: Acta Metall.30
(1982) 2161–2172.
12) S. G. Steinemann:Evaluation of Biomaterials, Ed. by G. D. Winter,
J. L. Leray and K. de Goot, (Jhon Wiley & Sons, Ltd., 1980) 1–34.
13) C. Baker: Metal Sci. J.5(1971) 92–100.
14) K. Nitta, S. Watanabe, N. Masahashi, H. Hosoda and S. Hanada: Structural Biomaterials for the 21st Century, TMS, 2001, pp. 25–34. 15) E. Takahashi, T. Sakurai, S. Watanabe, N. Masahashi and S. Hanada:
Mater. Trans.43(2002) 2978–2983.
16) H. Hosoda, Y. Fukui, T. Inamura, K. Wakashima and S. Miyazaki and
K. Inoue: Mater. Sci. Forum426–432(2003) 3121.
17) F. Takei, T. Miura, S. Miyazaki, S. Kimura, K. Otsuka and Y. Suzuki: