Behaviour of different moisture contents of
Jatropha curcas L. seeds under compression loading
A. Kabutey, D. Herák, A. Sedláček
Department of Mechanical Engineering, Faculty of Engineering,
Czech University of Life Sciences Prague, Prague, Czech Republic
Abstract
Kabutey A., Herák D., Sedláček A., 2011. Behaviour of different moisture contents of Jatropha curcas L. seeds under compression loading. Res. Agr. Eng., 57: 72–77.
A study was conducted to investigate the behaviour of different moisture contents of Jatropha curcas L. seeds under compression loading. To obtain jatropha seeds of different moisture contents ranging from 1% (w.b.) to 37% (w.b.), the seeds were soaked in water and kept in a refrigerator at 5°C for different number of days. Compression devices, namely ZDM 50-2313/56/18, pressing vessel with diameter of 76 mm and a pressing plunger of 90 mm height, were used. The amount of seeds in the pressing vessel was measured as 40 mm with compression force of 98,100 N. The results from the experiment showed that increasing the moisture content of the jatropha seeds influenced the force-deformation characteristic curve, deformation energy, maximum deformation and energy per unit volume. While moisture contents 1% (w.b.) and 10% (w.b.) displayed normal force-deformation characteristic, moisture contents 32% (w.b.) and 37% (w.b.) showed wave-effect characteristic. The R2 coefficient of determination value of 0.87 obtained from the effect of moisture content on deformation energy and unit volume energy shows that jatropha seeds of moisture content 16% (w.b.) would require minimum energy but high efficiency during compression.
Keywords: jatropha seeds; moisture content; compressive force; deformation; wave-effect characteristic
Jatropha curcas L., a multipurpose bush/small tree belonging to the family of Euphorbiaceae, is a native of tropical America, but now thrives in many parts of the tropics and sub-tropics in Africa or Asia. In normal conditions the plant will fruit once a year, yielding 2–5 t of dry seed/ha/year, after 5 years, de-pending on the genetic variety, agro-climatic con-ditions and the management input (Herák et al. 2010; Francis et al. 2005; Tewari 2007). The seeds contain 30–35% oil by weight, which can easily be converted into bio-diesel meeting the standards of US, Germany and European Standard Organiza-tion (Azam et al. 2005). The seeds and oil are not
edible due to the presence of toxins as phorbol es-ters, trypsin inhibitors, lectins, phytates (Francis et al. 2005). Jatropha can be utilized for different pur-poses, it can be used for erosion control, recreation, fire wood, grown as a hedge; the bark is rich in tan-nin and produces dark blue dye. Leaves are used for rearing of silkworm, in dyeing and in medicine as anti-inflammatory substance. Seed cakes are used as fertilizer, solid fuel, or for biogas production (Open-shaw 2000; Karaj, Müller 2009). Despite all vari-ous purposes, the application as fuel is probably the most interesting from both economical and ecologi-cal point of view (Bredeson 2007).
The optimal design and control of many primary production and postharvest operations requires an understanding of the dynamic behaviour of agri-cultural particulates. In agriagri-cultural and food proc-esses involving particulates, interest is not only focused on the mechanical behaviour and flow of particles within the bulk system but also on the re-sulting deformation of the individual particles (Raji, Favier 2003). Agricultural and food materials tend to behave as viscoelastic materials when they are subjected to various conditions of stress and strain (Rong et al. 1995). Furthermore, it was reported that most agricultural materials are elastic during the first portion of a load-deformation curve, but have viscoelastic properties with increased loading (Zoerb 1967). Thus, once the elastic region is ex-tended, properties are time-dependent and the ef-fect of deformation rate becomes more noticeable. The relationship between pressing force and mois-ture content are important factors for determining the energy demands of oil extraction from oilseed crops. With proper setting of the pressing force in
relation to the optimal moisture content, minimum energy input but high efficiency can be achieved within a technology line. Knowledge of the force-deformation characteristics in relation to energy re-quirement of many agricultural seed crops is avail-able (Bilanski 1966; Poulsen 1978; Kang et al. 1995) but little is known about the Jatropha curcas
L. seeds. The purpose of this study was to investi-gate the behaviour of different moisture contents of
Jatropha curcas L. seeds under compression load-ing. Parameters including maximum deformation, deformation energy, deformed volume and unit vol-ume energy were also considered in the study.
MAteriALS AnD MetHoD
Materials
[image:2.595.65.534.385.727.2]Matured dried jatropha seeds cleaned from any foreign materials such as dirt, dust, small branches, leaves and immature seeds were used for the ex-periment. To get the samples of different moisture contents ranging from 1% (w.b.) to 37% (w.b.), the cleaned jatropha seeds were divided into four sam-ples and each was soaked in water and kept in a refrigerator at 5°C for different number of days. After each required conditioning period, 20 seeds were selected at random from each sample while in the refrigerator and were allowed to gradual thaw-ing and moisture equilibration for 1 h before oven treatment. The standard hot air oven method with a temperature setting of 105°C and a drying time of 17 h (ISI 1966) was used to determine the moisture content. First the initial mass (g) of each sample
was determined using the Kern 440–35N (Kern & Sohn GmbH, Balingen, Germany) equipment hav- hav-ing an accuracy of 0.001 g followed by oven-dry-ing. The final mass (g) of the oven-dried seeds was also determined and the experiment was repeated five times and average values were used. The dif-ferent moisture contents of the samples obtained were calculated from equation Eq. (1) (Blahovec 2008):
(1)
where:
Mi – weight of the sample in the initial state (g) Mc– weight of the sample after drying (g)
Compression loading test
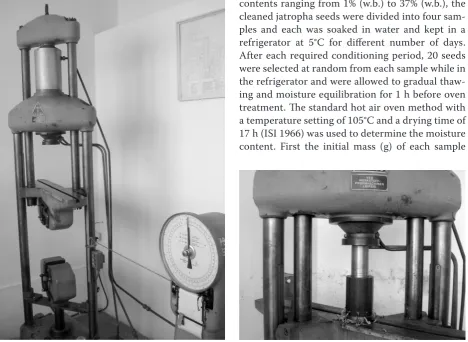
The Jatropha curcas L. seeds with various mois-ture contents ranging from 1%, 10 %, 32% and 37% (w.b.) were compressed to find the dependency be-tween force and deformation. Each sample mea-sured 40 mm as height of the seeds contained in the pressing vessel with diameter of 76 mm. With the pressing plunger on top of the measured seeds in the pressing vessel (Fig. 1), ZDM 50-2313/56/18 (Fig. 1) (VEB, Dresden, Germany) device was used for the compression which recorded the force-deformation functions in an exact and analogical manner. The seeds were pressed under temperature of 20°C and a pressing rate of v = 1 mm/s. The experiment was repeated three times for each sample.
Compression curves
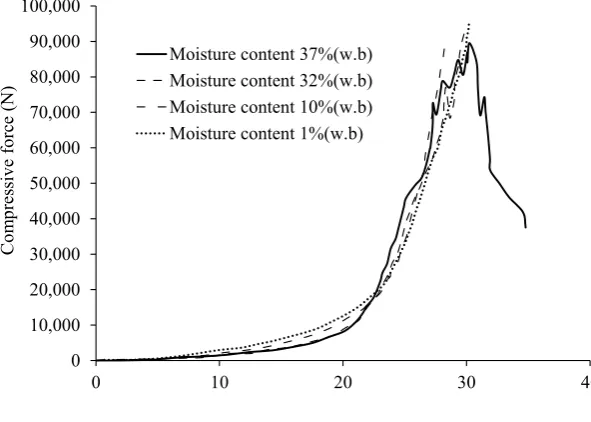
The jatropha seeds of different moisture content subjected to compression test showed different force-deformation characteristics under the same laboratory conditions with respect to temperature and humidity. The differences in the curves were
as a result of the moisture treatment given to each sample as described in the section of materials and method. For instance the force-deformation characteristic of moisture content 37% (w.b.) was extremely different from that of moisture content 32% (w.b.) as well as 10% (w.b.) and 1% (w.b.). This therefore suggests that moisture content has an in-fluence on the behavior of the force-deformation curve and possibly not the prevailing laboratory conditions at the time of compression.
Maximum deformation (ΔL)
The maximum deformations (mm) for various moisture contents of the jatropha seeds were di-rectly obtained from the force-deformation curve shown in Fig. 2.
Deformation energy
Deformation energy is the area under the com-pressive force-deformation curve from the zero deformation to maximum deformation. The defor-mation energy was calculated using the Engauge Digitizer 4.1 software (Mark Mitchell, NY, USA) which gives measurement of all points under the curve with respect to compressive force and maxi-mum deformation.
initial volume
The initial volume was calculated using Eq. (2):
(2)
where:
V – initial volume (m3)
D – diameter of the pressing vessel 76 mm H – height of seeds in the pressing vessel (mm)
H D V =π× ×
4 2 100
% i
c i
Wb MMM
[image:3.595.61.538.661.756.2]MC
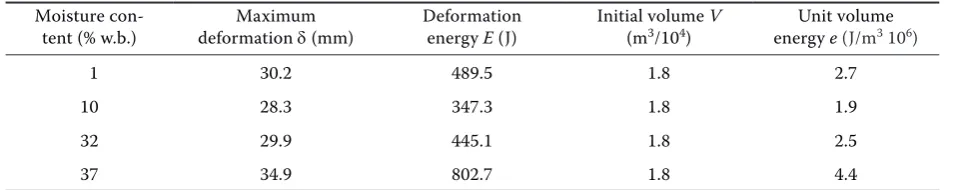
Table 1. Calculated amounts of Jatropha curcas L. seeds of different moisture contents Moisture
con-tent (% w.b.) deformation Maximum δ (mm) Deformation energy E (J) Initial volume V (m3/104) energy e Unit volume (J/m3 106)
1 30.2 489.5 1.8 2.7
10 28.3 347.3 1.8 1.9
32 29.9 445.1 1.8 2.5
Unit volume energy
Unit volume energy is the ratio of the deforma-tion energy and initial volume as described in Eq. (3):
(3)
where:
e – unit volume energy (J/m3)
E – deformation energy (J) V – initial volume (m3)
reSULtS AnD DiSCUSSion
The results presented in Table 1 showed that in-creasing the moisture content of the jatropha seeds from 1% (w.b.) to 37% (w.b.) increased the defor-mation energy and unit volume energy. Moisture content 1% (w.b.) had deformation energy of 489.5 J while moisture contents 10% (w.b.), 32% (w.b.) and 37% (w.b.) obtained values of 347.2 J, 445.11 J and 802.6 J, respectively. However, the energy used for moisture content 1% (w.b.) was higher than the en-ergy requirement for 10% (w.b.) and 32% (w.b.) but substantially lower than the 37% (w.b.). Unit vol-ume energy values ranged from 1.9.106 to 4.4.106 J/
m3. This parameter including deformation energy
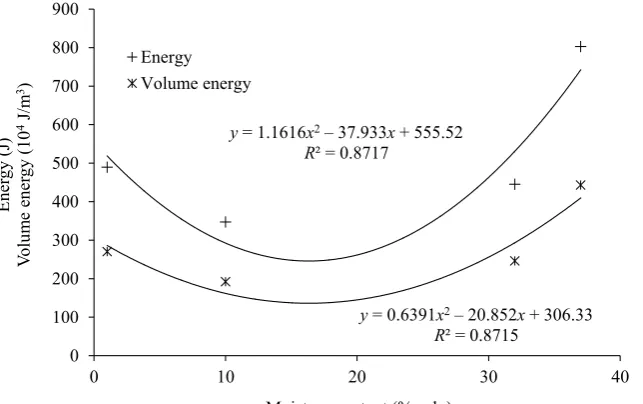
and initial volume helps to determine the power required for the compressive device. The higher the moisture content the higher the energy required for efficient compression. Also the
characteris-tic curve obtained from the deformation energy and unit volume energy as a function of moisture content shown in Fig. 3 gives an indication that at moisture content of 16% (w.b.), minimum energy utilization but high efficiency can be achieved dur-ing compression.
The R2 coefficient of determination value was
0.87. Statistical analysis ANOVA which was calcu-lated in the MathCAD 14 software (PTC, Needham, USA) for the level of significance 0.05, the value of
Fcrit = 5.98 (critical value compares a pair of mod-els) was higher than Fratio = 5.9 × 10⁻⁸ value (value of
the F test). Amount of P value; P = 0.9 (significance level at which the hypothesis of equality of models can be rejected) was higher than 0.05 significance level. This shows that polynomial function can be used for fitting determined amounts of energy. The relationship between determined amounts and polynomial function amounts was statistically sig-nificant.
Also for all moisture contents the initial volume value was the same. However, this did not affect the values obtained for the unit volume energy. But in-creasing the pressing height will definitely increase the unit volume energy. Maximum deformation increased with increasing moisture content. The values range from 28.2 to 34.9 mm for moisture content ranging from 1% (w.b.) to 37% (w.b.). Actu-ally, the pressing force and the deformation charac-teristics are wide-ranging monotonic increasing or decreasing functions; thus, if the pressing force is increased the deformation also increases. In some situations, the pressing force and the deformation
V E e
0 10,000 20,000 30,000 40,000 50,000 60,000 70,000 80,000 90,000 100,000
0 10 20 30 40
C
om
pressi
ve
fo
rce
(N)
Deformation (mm) Moisture content 37%(w.b)
[image:4.595.65.361.86.297.2]Moisture content 32%(w.b) Moisture content 10%(w.b) Moisture content 1%(w.b)
characteristics are local monotonic functions due to the fact that an increase in deformation does not increase the pressing force (Faborode, Fevier 1996; Očenášek, Voldřich 2009; Tavakoli et al. 2009). With respect to wave effect characteristics, jatropha seeds of moisture contents 1% (w.b.) and 10% (w.b.) displayed a normal force-deformation curve while 32% (w.b.) and 37% (w.b.) moisture contents showed wave effect characteristic; mois-ture content 37% (w.b.) showed the greatest effect. This explains that under compression loading test moisture content of seeds higher than 37% (w.b.) will exhibit more wave-effect characteristic causing vibration of the compression device.
ConCLUSion
Jatropha curcas seeds of moisture content 1% (w.b.) and 10% (w.b.) exhibited normal force-deformation curve while increasing the moisture content to 32% (w.b.) and 37% (w.b.), respectively, showed wave ef-fect characteristics. The wave efef-fect characteristics were followed with vibration of the compression device. It was found in this study that the higher the moisture content the higher the maximum de-formation, deformation energy and unit volume energy. The R2 coefficient of determination value of
0.8 obtained from deformation energy and unit vol-ume energy as a function of the various moisture contents reveals that jatropha seeds of moisture content 16% (w.b.) would require minimum energy utilization but high efficiency during compression.
references
Azam M.M., Waris A., Nahar N.M., 2005. Prospects and potential of fatty acid methyl esters of some non-traditional seed oils for use as biodiesel in India. Biomass and Bioen-ergy, 4: 293–302.
Blahovec J., 2008. Agromaterials-Study Guide. Prague, Czech University of Life Sciences Prague: 7–8.
Bilanski W.K., 1966. Damage resistance of seed grains. Transactions of the American Society of Agricultural Engineers, 9: 360–363.
Bredeson D.K., 2007. Mechanical oil extraction. Journal of the American Oil Chemists’ Society, 60: 211–213. Faborade M.O., Favier J.F., 1996. Identification and
sig-nificance of the oil-point in seed-oil expression. Journal of Agriculture Engineering Research, 65: 335–345.
Francis G., Edinger R., Becker K.A., 2005. Concept for simultaneous wasteland reclamation, fuel production, and socioeconomic development in degraded areas in India: need, potential and perspectives of Jatropha plantations. Natural Resources Forum, 1: 12–24.
Herák D., Gürdil G., Sedláček A., Dajbych O.,
Siman-juntak S., 2010. Energy demands for pressing Jatropha
curcas L. seeds. Biosystems Engineering, 106: 527–534. ISI 1966. Indian standard methods for analysis of oilseeds,
IS: 3579. New Delhi, Indian Standard Institute.
Kang S., Spillman C.K., Steele J.L., Chung D.S., 1995. Me-chanical properties of wheat. Transactions of the American Society of Agricultural Engineers, 38: 573–578.
Karaj S., Müller J., 2009. Optimization of mechanical extrac-tion of Jatropha curcas seeds. Landtechnik, 3:164–167. Očenášek J., Voldřich J., 2009. Mathematical modelling of
a biogenous filter cake and identification of oilseed mate-y = 1.1616x2– 37.933x + 555.52
R² = 0.8717
y = 0.6391x2– 20.852x + 306.33
R² = 0.8715
0 100 200 300 400 500 600 700 800 900
0 10 20 30 40
Ener
gy
(J)
Vo
lu
m
e
en
er
gy
(1
0
4 J/m 3)
Moisture content (% w.b.) Energy
[image:5.595.67.389.87.289.2]Volume energy
rial parameters. Applied and Computational Mechanics, 3: 1–12.
Openshaw K., 2000. A review of Jatropha curcas: an oil plant of unfulfilled promise. Biomass and Bioenergy, 19: 1–15. Poulsen G.R., 1978. Fracture resistance of soybeans to
com-pressive loading. Transactions of the American Society of Agricultural Engineers, 21: 1210–1216.
Raji A.O., Favier J.F., 2002. Discrete element modelling of the impact parameters of a selected fruit: application. Journal of Applied Science and Technology, 21: 7–12. Rong G., Negi S.C., Jofriet J.C., 1995. Simulation of the
flow behaviour of bulk solids in bins. Part 2: Shear bands,
flow, corrective inserts and velocity profile. Journal of Agricultural Engineering Research, 62: 257–269.
Tavakoli H., Mohtasebi S.S., Rajabipour A., Tavakoli M., 2009. Effects of moisture content, loading rate and grain orientation on fracture resistance of barley grain. Research in Agricultural Engineering, 55: 85–93.
Tewari D.N., 2007. Jatropha & Biodiesel. New Delhi, Ocean Books, Ltd.: 228.
Zoerb G.C., 1967. Instrumentation and measurement techniques for determining physical properties of farm products. Transactions of the ASAE, 10: 100–109, 113.
Received for publication April 19, 2010 Accepted after correctons June 11, 2010
Corresponding author:
doc. Ing. David Herák, Ph.D., Czech University of Life Sciences Prague, Faculty of Engineering, Department of Mechanical Engineering. Kamýcká 129, 165 21 Prague, Czech Republic