Agriculture has been playing and will continue to play a vital role for humanity, because the hu-man welfare depends on the amount and stability of agricultural production, as determined by crop yield and cultivated area (Garibaldi et al. 2011). The agricultural sector is one of the economic sectors that still have the European Union policymakers’ attention. The European Union (EU) agricultural sector is continually undergoing structural changes, which have significantly impacted the efficiency and productivity growth not only in the agricultural sec-tor, but also in the economy as a whole.
In the today’s highly competitive environment, ef-ficiency is one of the most frequently applied terms to help identify the strengths and weaknesses of the evaluated units. The evaluated units can be firms, national economic sectors, or the entire economies of the evaluated countries. This study is trying to analyse efficiency, which assumes that the evaluated units are doing things right, as determined by the
relationship between the consumed inputs and the produced outputs. However, this evaluation should be accomplished through a more detailed analysis. The Data Envelopment Analysis, or the DEA, is one of the available tools that have become very popular in many sectors for assessing efficiency. The advantage of the DEA is its ability to handle multiple inputs and outputs.
This study aims to address the following objectives: to define the concept of efficiency, to analyse the ef-ficiency in the agriculture of the EU countries during the years 2007–2011, and to make recommendations for increasing the efficiency of the inefficient EU agricultural sectors. Along with these objectives, this paper seeks to address the following research questions:
(1) Is the agricultural sector of the EU performing efficiently?
(2) Has the efficiency of the EU agricultural sector changed over the last several years?
Application of the DEA on the measurement
of efficiency in the EU countries
Kristína KOČIŠOVÁ
Department of Banking and Investment, Faculty of Economics, Technical University of Košice, Košice, Slovak Republic
Abstract: Th e purpose of the paper is to investigate the relative technical effi ciency of the agricultural sector in the Euro-pean Union (EU) using theData Envelopment Analysis (DEA) during the period 2007–2011. Th e authors investigated effi -ciency using both the input and output-oriented models with the assumption of a variable return to scale. Th ey looked for causes of ineffi ciency and made recommendations for ineffi cient agricultural sectors. Th e results show that, in average, the EU agricultural sectors performed effi ciently, as evidenced by the relatively high value of the average input and output effi -ciency. Th e effi ciency of the EU agricultural sectors had changed over the past few years, and in both models the effi ciency has generally decreased over time. As the main source of ineffi ciency was labelled the input “total utilised agricultural area” and as the strength with a positive impact on effi ciency, there was labelled the “crop output.” By calculating the optimal va-lues for the input and output variables for ineffi cient agricultural sectors, it has been found that for the effi cient production of a given quantity of outputs, it was necessary to reduce the value of the in put “total labour” in average by 6.18%, the “total utilised agricultural area” in average by 14.45% and the “total assets” in average by 5.93%. In case of the output-oriented model for effi cient use of a given quantity of inputs, the agricultural sectors should produce up to 111.85% of their crop output and 113.41% of their animal output.
Key words: agricultural sectors in the European Union, agriculture, Data Envelopment Analysis, technical effi ciency DEA, technical effi ciency
(3) What are the main sources of inefficiency, and is there a way to improve efficiency of the agricul-tural sector in the EU?
The answers to these questions may be beneficial to three main constituencies. The knowledge of the level of efficiency is important to agricultural firm manag-ers, since it reflects the quality of daily operations in utilising inputs and outputs, and other decisions can be based on this knowledge. Policymakers are the second group that may benefit from this information, because they can use it to compare the agricultural sector’s performance before and after any regulatory changes took place, and consequently they can evalu-ate if the changes were beneficial to the agricultural sector or not. Finally, researchers can also benefit from a paper analysing the efficiency of the agricultural sector. They can use the previous studies in this area to observe a gradual development in the measuring techniques of efficiency, which may enable them to identify gaps in the research.
LITERATURE REVIEW
In the modern society, a number of approaches exist for defining efficiency. Our definition is based on a study by Farrell (1957), who proposed that a firm’s efficiency has two components: technical efficiency and allocative efficiency. Technical efficiency reflects the ability of the firm to obtain the maximal output from the given set of inputs. Allocative efficiency reflects the firm’s ability to use the inputs in opti-mal proportions, given their prices and production technology. These two types of efficiency are then combined into the overall economic efficiency, which can be examined from the perspective of an input or an output-based model. We can also talk about the overall cost efficiency (input perspective) or the overall revenue efficiency (output perspective). The Farrell’s paper led to the development of many approaches for measuring the input and output efficiency. The most important ones were the Stochastic Frontier Approach (SFA), created by Aigner et al. (1977), and the Data Envelopment Analysis (DEA) developed by Charnes et al. (1978).
Methods for the efficiency measurement can be divided into a number of groups. The earliest tech-niques, which used to measure efficiency through the ratio analysis, examined the financial statements of the evaluated units and compared them with a
benchmark. Parametric methods, which include the Stochastic Frontier Approach (SFA), the Thick Frontier Approach (TFA) and the Distribution Free Approach (DFA), are used to measure economic efficiency. Non-parametric methods, which include Data Envelopment Analysis (DEA) and the Free Disposal Hull (FDH), are used to measure technical efficiency. The fourth group addresses the multi-criteria decision problems, which are described by a set of alternatives, a set of evaluation criteria, and by the links between the criteria and alternatives. A decision maker enters the basic information about criteria and alternatives to formulate a multi-criteria model. This model has the option to enter the additional information the investigator may have failed to state explicitly, which would not have been included in the basic model. The next group, the Balanced Scorecard (BSC), was described in a paper by Gavurová (2011) as a system, which reacts to the criticized explanatory ability of the value criteria for measuring the performance of an enterprise. What distinguishes the Balanced Scorecard system is that it extends and links the performance measurements of purely financial indicators to in-dicators from other perspectives of the enterprise’s activity. The correct construction of measurements for a company’s strategy is to tip its strategic priori-ties, and by the means of a causal-subsequent con-nection, it is possible to tip the way for the strategy realization. Gavurová (2012) and Šoltés and Gavurová (2013) showed that besides many positive responses to the implemented BSC systems and their contribu-tions to effective measurements and performance control in companies, negative experiences were also observed, citing an insufficient contribution of the BSC, the dissatisfaction with the system, and the failure. This suggested that the BSC system was not functional without some modifications, therefore the authors tried to identify the problematic areas of the BSC system implementation and to propose pos-sible solutions for overcoming these problems using the MICMAC method (Matrice d’Impacts Croises Multiplication. Appliquee a un Classement, in English the Cross-Impact Matrix).
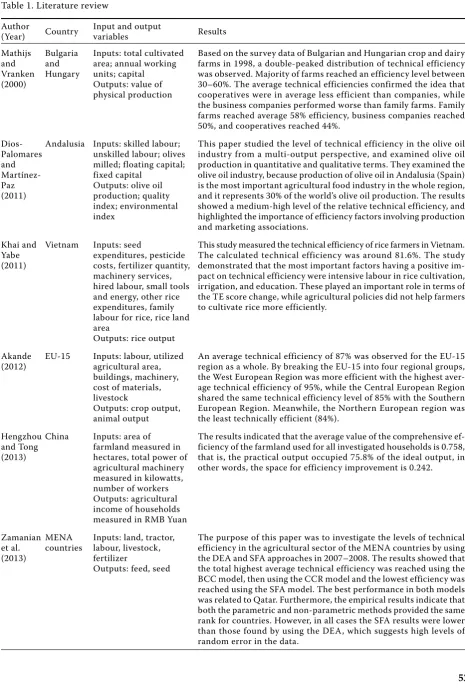
Table 1. Literature review
Author
(Year) Country
Input and output
variables Results
Mathijs and Vranken (2000)
Bulgaria and Hungary
Inputs: total cultivated area; annual working units; capital
Outputs: value of physical production
Based on the survey data of Bulgarian and Hungarian crop and dairy farms in 1998, a double-peaked distribution of technical efficiency was observed. Majority of farms reached an efficiency level between 30–60%. The average technical efficiencies confirmed the idea that cooperatives were in average less efficient than companies, while the business companies performed worse than family farms. Family farms reached average 58% efficiency, business companies reached 50%, and cooperatives reached 44%.
Dios-Palomares and Martínez-Paz (2011)
Andalusia Inputs: skilled labour; unskilled labour; olives milled; floating capital; fixed capital
Outputs: olive oil production; quality index; environmental index
This paper studied the level of technical efficiency in the olive oil industry from a multi-output perspective, and examined olive oil production in quantitative and qualitative terms. They examined the olive oil industry, because production of olive oil in Andalusia (Spain) is the most important agricultural food industry in the whole region, and it represents 30% of the world’s olive oil production. The results showed a medium-high level of the relative technical efficiency, and highlighted the importance of efficiency factors involving production and marketing associations.
Khai and Yabe (2011)
Vietnam Inputs: seed
expenditures, pesticide costs, fertilizer quantity, machinery services, hired labour, small tools and energy, other rice expenditures, family labour for rice, rice land area
Outputs: rice output
This study measured the technical efficiency of rice farmers in Vietnam. The calculated technical efficiency was around 81.6%. The study demonstrated that the most important factors having a positive im-pact on technical efficiency were intensive labour in rice cultivation, irrigation, and education. These played an important role in terms of the TE score change, while agricultural policies did not help farmers to cultivate rice more efficiently.
Akande (2012)
EU-15 Inputs: labour, utilized agricultural area, buildings, machinery, cost of materials, livestock
Outputs: crop output, animal output
An average technical efficiency of 87% was observed for the EU-15 region as a whole. By breaking the EU-15 into four regional groups, the West European Region was more efficient with the highest aver-age technical efficiency of 95%, while the Central European Region shared the same technical efficiency level of 85% with the Southern European Region. Meanwhile, the Northern European region was the least technically efficient (84%).
Hengzhou and Tong (2013)
China Inputs: area of farmland measured in hectares, total power of agricultural machinery measured in kilowatts, number of workers Outputs: agricultural income of households measured in RMB Yuan
The results indicated that the average value of the comprehensive ef-ficiency of the farmland used for all investigated households is 0.758, that is, the practical output occupied 75.8% of the ideal output, in other words, the space for efficiency improvement is 0.242.
Zamanian et al. (2013)
MENA countries
Inputs: land, tractor, labour, livestock, fertilizer
Outputs: feed, seed
of the economy in the evaluated country, based on the method he/she selected.
The Data Envelopment Analysis (DEA) is a non-parametric approach for the frontier estimation. Basic models are discussed in the works of many authors, and they are applied in many areas. In the Slovak and Czech Republic, the DEA models have been used to measure the efficiency of financial institutions, for example in the work of Stavárek (2006), Jablonský and Grmanová (2009); Stavárek and Řepková (2012). The DEA was also used to measure efficiency in other areas. For example, Dlouhý et al. (2007) used the DEA to measure the efficiency of hospitals. They analysed 22 Czech acute-care hospitals using a constant return to scale and a variable return to the scale model. Also Koróny and Gavurová (2013) used the DEA analysis as an indicator in eight Slovak regions with the one-day healthcare during 2009–2011. Separately, they evaluated the efficiency from the viewpoint of the patients who were under age and from the viewpoint of the patients over 18. The DEA models can also be used to measure the efficiency in education. Lima (2013) employed the DEA to describe the evidence of the functioning and the dynamics of labour markets,
and to evaluate the efficiency in the use of knowl-edge as a strategy for increasing growth in the PIGS economies. Jeck and Sudzina (2009) applied the DEA models directly to evaluating the relative efficiency of the departments of Slovak universities. Another area of application is evaluating the efficiency of public transportation. Kráľ and Roháčová (2013) used an input oriented slack-based model under the variable return to scale to measure the efficiency of transport companies in the Slovak Republic. Finally, there are many other areas where it is possible to apply the DEA method.
After reviewing the studies dealing with the ap-plication of the DEA for measuring efficiency in the Slovakia and Czech Republic, we have concluded that there is a lack of such studies in agriculture. The question of the scale efficiency was examined in the work of Bielik and Rajčániová (2004). They examined the relationship between the farm size and the efficient land use as a basic production factor. Their research has been done on a selected sample of agricultural enterprises in the Slovak Republic. The DEA approach allowed them to investigate the difference in efficiency of 110 agricultural enterprises Author
(Year) Country
Input and output
variables Results
Arita and Leung (2014)
Hawaii Inputs: labour, land, machinery, other expenses
Outputs: total sales generated from production
Using data from the US Census of Agriculture, they examined technical efficiency of the population of the Hawaii aqua farms across different types of farms over time. The results showed that only 12% of the farms in 2007 may be classified as efficient, with a steady decline in efficiency over time.
Bojnec et al. (2014)
10 New EU Member States* (BG, CZ, EE, HU, LV, LT, PL, RO, SK, SI)
Inputs: total labour force, number of agricultural tractors, agricultural area, total fertilizers use, number of animal livestock units Output: gross value added
This paper studied the level of technical efficiency in 10 New EU Member States during the period 2001–2006. The results vary over time and between the analysed countries. All countries had the scores of efficiency below 1, implying opportunities for the better use of agricultural resources. In average, Bulgaria and Slovakia achieved the highest scores during the whole period. Between the 2002 and 2006, Hungary has made the greatest catch-up in its DEA efficiency. The Baltic States and Poland have experienced the lowest scores in agriculture.
Špička (2014)
101 EU regions
Inputs: utilized
agricultural area, Labour input, Economics size, Livestock units, Stocking intensity
Outputs: Crop output, Livestock output
The analysis reveals 56 efficient and 45 inefficient regions in 2011. There are generally larger farms in the efficient regions in average. In the Czech Republic and Slovakia, the mixed type of farming, and three regions in Hungary was technical efficient. All four regions in Poland are inefficient with the increasing return to scale. The decreas-ing return to scale was typical for the regions with largest farm such as the regions in the former East Germany. The efficient regions had a higher land, labour, energy, capital productivity and productivity of contract work that the inefficient regions.
of varying sizes. The research has proved that about 10% of the analysed farms were operating at the op-timal scale, 77% at the above opop-timal scale, and 13% could increase their efficiency by increasing their agricultural land area.
Bielik et al. (2010) performed an analysis of the return to scale on the basic industry enterprises in Slovakia. During the whole analysed period (1999– 2007), there was estimated the most numerous group of companies which occurred in the area of decreasing returns to scale. This confirmed that the total input exploitation in agricultural companies was not prof-itable, because in comparison with the production inputs, lower profits were reached. On the basis of these results, it was not possible to estimate which inputs were indispensable for the optimal perfor-mance (for a more specific estimation, it is necessary to apply the non-radial DEA methods), despite the fact that the low measure of input profitability was confirmed.
Bielik and Hupková (2011) measured the technical efficiency of agricultural basic industry subjects in the Slovak Republic during the period 1999–2007, and they identified a developing trend. They found that since 2001, when the technical efficiency reached its highest level, there was a marked decline in the technical efficiency. Based on their results of the tech-nical efficiency measurements, they expected to see a widening gap between the companies in the future.
The question of the technical efficiency was also examined in the work of Čechura (2010). According to Čechura (2010), the technical inefficiency is a significant phenomenon in the Czech agriculture. The average level of the technical efficiency is around 90% for Czech agricultural companies.
Jánová et al. (2012) discussed the possibility of applying the DEA in the bankruptcy prediction mod-els in the field of agribusiness. They collected their primary data set on the Czech agriculture firms’ fi-nancial performance, then they applied a DEA based model, and they evaluated the obtained results and discussed the predictive power of these approaches in the agriculture industry.
METHODOLOGY
This study is trying to analyse efficiency, meaning that the evaluated units (DMU) are doing things right, and it examines this mainly by looking at the relationship between the inputs used and the outputs
produced. However, such evaluation requires a more thorough analysis. The Data Envelopment Analysis, or the DEA, is one of the available tools, which have become very popular in many sectors for assessing efficiency, and it has the advantage of being able to handle multiple inputs and outputs.
The basic DEA model developed by Charnes et al. (1978) was based on the assumption of the constant return to scale. This basic model has been modified by Banker et al. (1984) to be based on a variable return to scale. Both these DEA models have been created in both forms – the input and output-oriented.
In this study, the units of analysis are agricultural sectors. Consider n agricultural sectors (DMUj, j =
1, 2, ..., n), each consuming m different inputs (xij,
i = 1, 2, ..., m) to produce s different outputs (yrj, r =
1, 2, ..., s). The matrix of inputs is marked as follows
X = {xij, i = 1, 2, …, m; j = 1, 2, …, n} and the matrix of outputs Y = {yrj, r = 1, 2, … ,s; j = 1, 2, …, n}. Since the used inputs and the produced outputs have differ-ent levels of significance for each agricultural sector, they have different weights. The advantage of a DEA model is that the weights of the utilized inputs and the produced outputs are the result of solving an optimization of a linear programming problem, and they are not based on a subjective perception. The optimal weights are obtained by solving the following mathematical programming problem:
Max 1
1 1
d
¦
¦
mi ij i s
r rj
ry vx
u (1)
Subject to 1
1 1
m
i ij i s
r rj
ry vx
u j = 1, 2, ..., n
ur ≥ 0 r = 1, 2, ..., s vi ≥ 0 i = 1, 2, ..., m
Where:
ur = the optimized weight of rth output (r = 1, 2, ..., s)
vi = the optimized weight of ith input (i = 1, 2, ..., m)
yrq = the produced amounts of rth output (r = 1, 2, ...,s) for DMUq
xiq = the consumed amounts of ith input (i = 1, 2, ..., m) for DMUq
yrj = the produced amounts of rth output (r = 1, 2, ..., s) for DMUj(j = 1, 2, ..., n)
xij = the consumed amounts of ith input (i = 1, 2, ..., m) for DMUj(j = 1, 2, ..., n)
scale, and it is known as the CCR (Charnes, Cooper and Rhodes) model. The assumption of the constant return to scale can be accepted only if the DMUs operate under the condition of their optimal size. Imperfect competition, financial constraints, control steps, and other factors can cause the DMUs not to operate at their optimal size. A DEA model that allows calculations with a variable return to scale has been developed to overcome this problem. This model is called the BCC model (Banker, Charnes, Cooper). The DEA models (CCR model or BCC model) can be based on inputs or outputs. The input-oriented models make recommendations regarding how the inefficient units can achieve efficiency in the form of reductions on the input side. The output-oriented models require an increase on the output side to achieve efficiency. The efficiency of a particular DMUq
can be obtained by solving the linear programming programs. The input-oriented model with slack vari-ables, which assumes a variable return to scale (BCC model), can be defined as follows (Coelli et al. 2005):
Min »
¼ º «
¬ ª
¦
¦
sr r m
i i
q s s
1 1
İ
ș (2)
Subject to i q iq n
j j
ij s x
x O T
¦
1
rq r n
j j
rj s y
y O
¦
1
1 1
O
¦
nj
j
O ; ; t0
r i
j s s
Where:
θq = the effi ciency of DMUq, ε is the non-Archimedean constant (10–6or 10–8)
sr+, s i
– = the input or output slacks
λj = the weight assigned to the DMUj (j = 1, 2, …, n)
Performing a DEA analysis requires solving n linear programming problems in the above form, one for each DMU. The DMUqis termed fully efficient if and only if the optimal value θq= 1 and all the slack variables are equal to zero. If θq= 1 but the slack variables are not equal to zero, we can talk about the “pseudo-efficiency”. If the slack variables are equal to zero but θq< 1, then the value θq signals the inefficiency. This inefficiency can be eliminated by a proportional (radial) reduction in all inputs of the DMUq by (1 – θq) 100%, and thus a shift on the efficiency frontier can be achieved. If the slack variables aren’t equal to zero and θq< 1, the
non-radial shift expressed by slack variables is necessary to achieve efficiency.
DATA DESCRIPTION
This section gives the description of the data used for the measurement of the technical efficiency. The dataset used for this paper was obtained from the database published annually by the Farm Accountancy Data Network (FADN). The FADN is an instrument for evaluating the income of agricultural holdings and the impacts of the Common Agricultural Policy. It consists of an annual survey carried out by the Member States of the European Union.
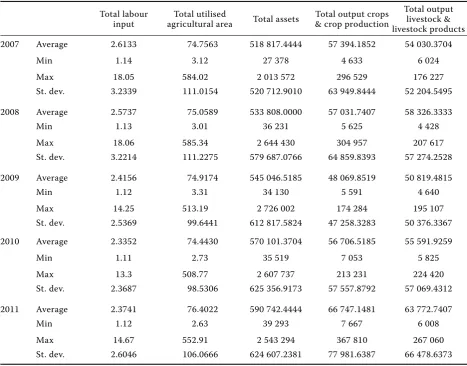
The summary and definitions of both input and output variables are described below. In our analysis, three input variables and two output variables were used. Three main sources were used as the input vari-ables: labour, land and capital. Two main outputs in the agricultural sector were used as the output vari-ables: crop output and animal output. We report the descriptive statistics for these variables in Table 2.
The first input, labour, was measured by the “Total Labour Input” expressed in the Annual Work Units (full-time worker equivalent). The second input, land, was measured by the “Total Utilized Agricultural Area” expressed in hectares (Ha). The last input variable, capital, was measured by the “Total Assets,” which are in the ownership of agricultural holdings expressed in EURO. The total assets were calculated as the sum of the fixed assets and current assets, while the fixed assets were defined as the sum of farm buildings, forest capital, buildings, machinery and equipment, and breeding livestock, all expressed in EURO. The current assets were defined as the sum of non-breeding livestock plus the turn-over capital, expressed in EURO. The first output was measured by the “Total Output Crops and Crop Production” (sales plus the intermediate consumption and own consumption), expressed in EURO. The second output variable was measured by the “Total Output Livestock and Livestock Products” (livestock production, plus change in the livestock value, and animal products), expressed in EURO.
EMPIRICAL ANALYSIS AND RESULTS
production in 27 European Union countries during the years 2007–2011, and to propose recommenda-tions in order to increase the efficiency of the inef-ficient EU agricultural sectors. The term “relative” efficiency refers to the achieved efficiency of evalu-ated agricultural sectors within the group and given the criteria used (input and output variables). The term “technical efficiency” reflects the ability of an agricultural sector to obtain the maximal output from the given set of inputs. In addition to the “techni-cal efficiency”, we can encounter the term “overall economic efficiency” in the literature. This type of efficiency can be estimated when the price data are available. Then we can talk about the overall cost efficiency (input perspective) or the overall revenue efficiency (output perspective).
In our study, we analysed the relative technical efficiency of agricultural sectors through the ba-sic DEA models using the criteria described in the
previous section. The analysed EU member states included: Austria, Belgium, Bulgaria, Cyprus, the Czech Republic, Denmark, Estonia, Finland, France, Germany, Greece, Hungary, Ireland, Italy, Lithuania, Luxembourg, Latvia, Malta, the Netherlands, Poland, Portugal, Romania, Slovakia, Slovenia, Spain, Sweden, and the United Kingdom.
[image:7.595.63.531.113.479.2]To analyse efficiency, we used both the input and output-oriented models with the assumption of a variable return to scale (BCC model), which over-came the need for the perfect competition, since we are aware that the presence of the imperfect competition, financial constraints, control steps, and other factors can cause the agricultural sectors not to operate at their optimal size. The efficiency scores in this study were estimated using the com-puter program “EMS” provided by Scheel (2000). The average technical efficiency calculated using the input and output-oriented BCC model for all of
Table 2. Descriptive statistics on variables used for the efficiency measurement
Total labour input
Total utilised
agricultural area Total assets
Total output crops & crop production
Total output livestock & livestock products
2007 Average 2.6133 74.7563 518 817.4444 57 394.1852 54 030.3704
Min 1.14 3.12 27 378 4 633 6 024
Max 18.05 584.02 2 013 572 296 529 176 227
St. dev. 3.2339 111.0154 520 712.9010 63 949.8444 52 204.5495
2008 Average 2.5737 75.0589 533 808.0000 57 031.7407 58 326.3333
Min 1.13 3.01 36 231 5 625 4 428
Max 18.06 585.34 2 644 430 304 957 207 617
St. dev. 3.2214 111.2275 579 687.0766 64 859.8393 57 274.2528
2009 Average 2.4156 74.9174 545 046.5185 48 069.8519 50 819.4815
Min 1.12 3.31 34 130 5 591 4 640
Max 14.25 513.19 2 726 002 174 284 195 107
St. dev. 2.5369 99.6441 612 817.5824 47 258.3283 50 376.3367
2010 Average 2.3352 74.4430 570 101.3704 56 706.5185 55 591.9259
Min 1.11 2.73 35 519 7 053 5 825
Max 13.3 508.77 2 607 737 213 231 224 420
St. dev. 2.3687 98.5306 625 356.9173 57 557.8792 57 069.4312
2011 Average 2.3741 76.4022 590 742.4444 66 747.1481 63 772.7407
Min 1.12 2.63 39 293 7 667 6 008
Max 14.67 552.91 2 543 294 367 810 267 060
St. dev. 2.6046 106.0666 624 607.2381 77 981.6387 66 478.6373
the periods under consideration (2007 to 2011) is presented in Figure 1.
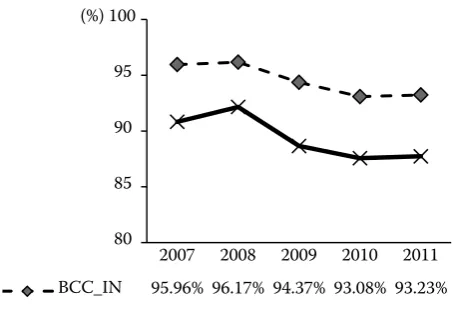
We pooled the cross-country data and used them to define the common best practice efficiency frontier for each year. Figure 1 shows the results for the aver-age input and output efficiencies obtained relative to the whole sample during the analysed period. Both models show that the efficiency of agricultural sec-tors has generally decreased over time. The average input efficiency at the beginning of the analysed period was 95.96%, indicating that the agricultural sectors had to improve their efficiency in average by 4.04%. This efficiency slightly rose to 96.17% in 2008, indicating a decreasing room for the efficiency improvement (3.83%). Since 2008, the average input efficiency decreased to reach its minimum in 2010. In that year, the average efficiency for all agricultural sectors was 93.08% (the room for the efficiency im-provement was at its peak, 6.92%). In the last year, the average input efficiency increased slightly to 93.23%. The average output efficiency was consider-ably lower than it was in the input-oriented model. In the case of the output efficiency, we can observe the same trend. It is possible to detect an improvement in the average output efficiency between 2007 and 2008. The highest output efficiency was reached in 2008 (92.16%). From this year onward, the average efficiency decreased, reaching its minimum in 2010 (87.56%). In the last year of the analysed period, the average output efficiency increased slightly to 87.73%. The next table shows that the highest efficiency was obtained in 2008, which means that during that year the agricultural sectors were most efficient in their management of inputs and outputs. Since then, the
average efficiency decreased. A greater variability was observed in the output efficiency. The output efficiency fluctuated from the 43.91% (2008) to 100%, as compared to the fluctuations from 72.06% (2010) to 100% for the input efficiency, while the variability in the output-oriented model was the highest in 2009 (the standard deviation of 0.1526) and the lowest in 2008 (the standard deviation of 0.1377).
The level of the relative technical efficiency was calculated separately for each country. The results from the input and output-oriented BCC models for the analysed European Union countries are presented in Table 3.
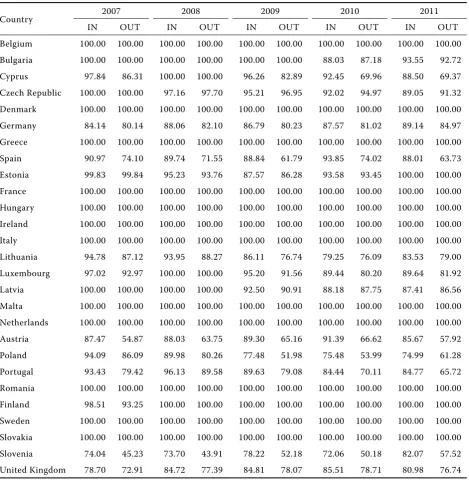
Table 3 shows that 13 agricultural sectors were marked as relatively technically efficient in both models during the whole analysed period (Belgium, Denmark, Greece, France, Hungary, Ireland, Italy, Malta, the Netherlands, Romania, Finland, Sweden, and Slovakia). “Relatively” means that these agri-cultural sectors were efficient within the analysed group of countries, taking into account the specified input and output variables. If other variables were used for the analysis, or if we changed the number of the analysed countries, the results of the efficiency measurements could be quite different.
In the analysed sample, we can also find countries, which were marked as relatively efficient at the begin-ning, but during the analysed period, they lost their efficiency and became inefficient. The agricultural sectors in Bulgaria, the Czech Republic, and Latvia belong to this group. On the other hand, the agricul-tural sectors in Estonia and Finland moved from the inefficient group to the efficiency margin.
The lowest efficiency was reached mainly in by the agricultural sectors in Slovenia and Poland. The agricultural sector in Slovenia reached its minimum values in both models for 2007, 2008 and 2010; and in the output-oriented model also for 2011. The Polish agricultural sector reached its minimum in both models for 2009; and in the input-oriented model also for 2011.
The Spainish agricultural sector was markedly more efficient in its use of inputs than in its production of outputs. This can be seen from the values for the input and output efficiency, which show that the Spanish agricultural sector reached a higher level of the input efficiency. The same situation, namely the higher input efficiency, can be observed in other inefficient agricultural sectors like those of Cyprus, Germany, Lithuania, Luxembourg, Austria, Poland, Portugal, Slovenia, and the United Kingdom. The 80
85 90 95 (%) 100
2007 2008 2009 2010 2011
[image:8.595.63.292.95.251.2]BCC_IN 95.96% 96.17% 94.37% 93.08% 93.23% BCC_OUT 90.82% 92.16% 88.66% 87.56% 87.73%
Figure 1. Average technical efficiency in the EU countries
opposite trend, i.e. a higher output efficiency, can be seen in the Czech agricultural sector. This was the only agricultural sector, which was more efficient at producing its outputs than at using its inputs.
One of the important advantages of the DEA analy-sis is its ability to identify the potential areas of im-provement for the inefficient agricultural sectors. The input-oriented model gives recommendations for the inefficient agricultural sectors to achieve ef-ficiency in the form of reductions on the input side.
The output-oriented model requires increases on the output side for achieving efficiency.
[image:9.595.64.534.260.744.2]Over the whole analysed sample, we found that to improve the input efficiency, it was necessary to reduce the value of the “Total Labour” in average by 6.18%, the “Total Utilised Agricultural Area” in average by 14.45%, and the “Total Assets” in average by 5.93%. This means that to achieve an efficient production of the given quantity of outputs, the agricultural sectors should use only 93.82% of their
Table 3. Input (IN) and output (OUT) technical efficiency in the EU countries (%)
Country 2007 2008 2009 2010 2011
IN OUT IN OUT IN OUT IN OUT IN OUT
Belgium 100.00 100.00 100.00 100.00 100.00 100.00 100.00 100.00 100.00 100.00
Bulgaria 100.00 100.00 100.00 100.00 100.00 100.00 88.03 87.18 93.55 92.72
Cyprus 97.84 86.31 100.00 100.00 96.26 82.89 92.45 69.96 88.50 69.37
Czech Republic 100.00 100.00 97.16 97.70 95.21 96.95 92.02 94.97 89.05 91.32
Denmark 100.00 100.00 100.00 100.00 100.00 100.00 100.00 100.00 100.00 100.00
Germany 84.14 80.14 88.06 82.10 86.79 80.23 87.57 81.02 89.14 84.97
Greece 100.00 100.00 100.00 100.00 100.00 100.00 100.00 100.00 100.00 100.00
Spain 90.97 74.10 89.74 71.55 88.84 61.79 93.85 74.02 88.01 63.73
Estonia 99.83 99.84 95.23 93.76 87.57 86.28 93.58 93.45 100.00 100.00
France 100.00 100.00 100.00 100.00 100.00 100.00 100.00 100.00 100.00 100.00
Hungary 100.00 100.00 100.00 100.00 100.00 100.00 100.00 100.00 100.00 100.00
Ireland 100.00 100.00 100.00 100.00 100.00 100.00 100.00 100.00 100.00 100.00
Italy 100.00 100.00 100.00 100.00 100.00 100.00 100.00 100.00 100.00 100.00
Lithuania 94.78 87.12 93.95 88.27 86.11 76.74 79.25 76.09 83.53 79.00
Luxembourg 97.02 92.97 100.00 100.00 95.20 91.56 89.44 80.20 89.64 81.92
Latvia 100.00 100.00 100.00 100.00 92.50 90.91 88.18 87.75 87.41 86.56
Malta 100.00 100.00 100.00 100.00 100.00 100.00 100.00 100.00 100.00 100.00
Netherlands 100.00 100.00 100.00 100.00 100.00 100.00 100.00 100.00 100.00 100.00
Austria 87.47 54.87 88.03 63.75 89.30 65.16 91.39 66.62 85.67 57.92
Poland 94.09 86.09 89.98 80.26 77.48 51.98 75.48 53.99 74.99 61.28
Portugal 93.43 79.42 96.13 89.58 89.63 79.08 84.44 70.11 84.77 65.72
Romania 100.00 100.00 100.00 100.00 100.00 100.00 100.00 100.00 100.00 100.00
Finland 98.51 93.25 100.00 100.00 100.00 100.00 100.00 100.00 100.00 100.00
Sweden 100.00 100.00 100.00 100.00 100.00 100.00 100.00 100.00 100.00 100.00
Slovakia 100.00 100.00 100.00 100.00 100.00 100.00 100.00 100.00 100.00 100.00
Slovenia 74.04 45.23 73.70 43.91 78.22 52.18 72.06 50.18 82.07 57.52
United Kingdom 78.70 72.91 84.72 77.39 84.81 78.07 85.51 78.71 80.98 76.74
labour, 85.55% of their utilised agricultural area, and 94.07% of their total assets. The highest reduction rate was required in 2010, when the input efficiency was at its lowest.
In case of the output-oriented BCC model, it was necessary to increase outputs to become efficient using the given inputs. In the whole analysed sample, we found, that for the improvement of the output ef-ficiency it was necessary to increase the “Crop Output” in average by 11.85% and the “Animal Output” in aver-age by 13.41%. This suggests that for the efficient use of a given quantity of inputs, the agricultural sectors should produce up to 111.85% of their crop output and 113.41% of their animal output.
Another advantage of the DEA analysis is its abil-ity to identify the strengths and weaknesses within a set of inputs and outputs through the values of their optimal weights. Lower weights signal the factors, which had a negative impact on efficiency. On the other hand, higher weights signal factors with a posi-tive impact on efficiency. When we looked at optimal weights obtained by solving the linear programming problems, we found that during the whole analysed period, the “Total Utilised Agricultural Area” was the weakest factor on the input side. The “Crop Output” was the strongest factor with a positive impact on efficiency. The reason we used the analysis through optimal weights for the identification of strengths and weaknesses instead of the regression analysis was to highlight the benefits of the DEA models.
CONCLUSION
The objective of this paper was to investigate and compare the relative technical efficiency of the agri-cultural production in the European countries at the national level. To reach this objective, we attempted to answer the following research questions: “(1) Is the agricultural sector in the EU performing efficiently? (2) Has the efficiency of the EU agricultural sector changed over the last several years? (3) What are the main sources of inefficiency, and is there any way of improving the efficiency of the agricultural sector in the EU?”
We investigated efficiency using both the input and output-oriented models using the assumption of a variable return to scale in 27 agricultural sec-tors of the European Union (EU) countries during the period 2007–2011. The results showed that, in average, the agricultural sector in the EU performed
efficiently, as evidenced by the relatively high values of the average input and output efficiency. There were 13 agricultural sectors, which were determined to be relatively technically efficient in both models dur-ing the whole analysed period (Belgium, Denmark, Greece, France, Hungary, Ireland, Italy, Malta, the Netherlands, Romania, Finland, Sweden, and Slovakia). The lowest efficiency was observed mainly in the agricultural sectors in Slovenia and Poland. In the analysed sample, there were also countries, which were observed to be relatively efficient at the begin-ning, but during the analysed period they lost their efficiency and became inefficient. The agricultural sectors in Bulgaria, the Czech Republic, and Latvia belong to this group. On the other hand, the agricul-tural sectors in Estonia and Finland moved from the inefficient group to the efficiency margin. “Relatively” means that these agricultural sectors were efficient within the analysed group of countries, taking into account the specified input and output variables. If other variables were used for the analysis, or if we changed the number of the analysed countries, the results of the efficiency measurement could be quite different.
The efficiency of the EU agricultural sector has changed over the past few years, and in both mod-els it could be seen that the efficiency has generally decreased over time. The average input efficiency at the beginning of the analysed period was 95.96%, indicating that the agricultural sectors had to improve their efficiency in average by 4.04%. In the last year, this efficiency reached 93.23%. The average output efficiency was considerably lower than in the input-oriented model. The output efficiency at the begin-ning of the analysed period was 90.82%, and in the last year it declined to 87.73%.
produce up to 111.85% of their “Crop Output” and 113.41% of their “Animal Output.”
The answers to the analysed questions may be ben-eficial to three main constituencies. The knowledge of the level of efficiency is important to agricultural firm managers, since it reflects the quality of daily operations in utilising inputs and outputs, and other decisions can be based on this knowledge. Policymakers are the second group that may benefit from this in-formation, because they can use it to compare the agricultural sector’s performance before and after any regulatory changes took place, and consequently they can evaluate if the changes were beneficial to the agricultural sector or not. Finally, researchers can also benefit from a paper analysing the efficiency of the agricultural sector. They can use the previous studies in this area to observe a gradual development in the measuring techniques of efficiency, which may enable them to identify gaps in the research.
In our study, we analysed the relative technical ef-ficiency of agricultural sectors using the basic DEA models with the criteria described in the previous section. The term “relative technical efficiency” re-flects the ability of an agricultural sector to obtain the maximal output from the given set of inputs within its group and the criteria used (input and output vari-ables). The findings of this paper should be updated on a larger scale, for example using all European countries, in order to investigate the evolution the efficiency of the EU agricultural sectors in a larger set of the surveyed countries. The future analysis may also benefit from using the DEA models with the information about prices to evaluate the overall economic efficiency in the form of cost, revenue, or profit efficiency. Other benefits of the future analysis may also include the examination of the impact of variables beyond the inputs and outputs used in the DEA models. The impact of various factors such as the technology, the relative factor abundance, the institutional and policy reforms, the market environ-ment, and other on the relative technical efficiency or the overall economic efficiency of agricultural sectors in the analysed countries can be analysed through the regression analysis.
REFERENCES
Aigner D.J., Lovell C.A K., Schmidt P. (1977): Formulation and estimation of stochastic frontier production function models. Journal of Econometrics, 6: 21–37.
Akande O.P. (2012): An Evaluation of Technical Efficiency and Agricultural Productivity Growth in EU Regions. Wageningen University, Wageningen.
Arita S., Leung P.S. (2014): A technical efficiency analysis of Hawaii’s aquaculture industry. Journal of the World Aquaculture Society, 3: 312–321.
Banker R.D., Charnes A., Cooper W.W. (1984): Some mod-els for estimating technical and scale inefficiencies in data envelopment analysis. Management Science, 9: 1078–1092.
Bielik P., Hupková D. (2011): The technical efficiency analy-sis – case of agricultural basic industry in Slovakia. Agris On-line Papers in Economics and Informatics, 1: 3–12. Bielik P., Hupková D., Vadovič M., Turčeková N. (2010):
The Return to Scale Analysis in the Basic Industry En-terprises in the Slovak Republic. Agricultural Economics – Czech, 56: 359–367.
Bielik P., Rajčániová M. (2004): Scale Efficiency of Agricul-tural Enterprises in Slovakia. AgriculAgricul-tural Economics – Czech, 50: 331–335.
Bojnec Š., Fertő I., Jámbor A. Tóth J. (2014): Determi-nants of technical efficiency in agriculture in new EU member states from Central and Eastern Europe. Acta Oeconomic, 64: 197–217.
Charnes A., Cooper W., Rhodes E. (1978): Measuring the efficiency of decision-making units. European Journal of Operational Research, 6: 429–444.
Coelli T., Rao D.S.P., O’Donell CH.J, Battese G.E. (2005): An Introduction to Efficiency and Productivity Analysis. Springer, New York.
Čechura L. (2010): Estimation of technical efficiency in Czech agriculture with respect to firm heterogenity. Agricultural Economics – Czech, 56: 183–191. Dios-Palomares R., Martínez-Paz J.M. (2011): Technical,
quality and environmental efficiency of the olive oil industry. Food Policy, 4: 526–534.
Dlouhý M., Jablonský J., Novosádová I. (2007): Využití analýzy obalu dat pro hodnocení efektivnosti českých nemocnic. (Use of data envelopment analysis to evaluate the effectiveness Czech hospitals.) Politická ekonomie, 1: 60-71.
Farrell M.J. (1957): The measurement of productive ef-ficiency. Journal of the Royal Statistical Society, 3: 253–290.
Garibaldi L.A., Aizen M.A., Klein A.M., Cunningham S.A., Harder L.D. (2011): Global growth and stability of agricultural yield decrease with pollinator dependence. Proceedings of the National Academy of Sciences, 108: 5909–5914.
Gavurová B. (2012): Source identification of potential mal-function of balanced scorecard system and its influence on system function. E+M Ekonomie a Management, 3: 76–90.
Hengzhou X., Tong Ch. (2013): Impact of farmers’ dif-ferentiation on farmland-use efficiency: Evidence from household survey data in rural China. Agricultural Economics – Czech, 59: 227–234.
Jablonský J., Grmanov E. (2009): Analýza efektívnosti slo-venských a českých poisťovní pomocou modelov analýzy obalu dát. (Analysis of efficiency of Slovak and Czech insurance companies by Data Envelopment Analysis Models.) Ekonomický časopis, 57: 857–869.
Janová J., Vavřina J., Hampel D. (2012): DEA as a tool for bankruptcy assessment: the agribusiness case study. In: Proceedings of the 30th International Conference Mathematical Methods in Economics 2012: 379–383. Jeck T., Sudzina F. (2009): Relatívna efektívnosť univerzít
na Slovensku. Úloha univerzít v regionálnom rozvoji. (Relative Efficiency of Slovak Universities.) In: Zbor-ník vedeckých prác vedeckej konferencie, 30.11.2009, Košice: 84–93.
Khai H.V, Yabe M. (2011): Technical efficiency analysis of rice production in Vietnam. Journal of ISSAAS, 17: 135–146.
Koróny S., Gavurová B. (2013): DEA analysis of one day health care in Slovakia. Forum Statisticum Slovacum, 2: 104–109.
Kráľ P., Roháčová V. (2013): Measuring the efficiency of public road transport companies in the Slovak Republic using DEA and SFA. Statistika, 93: 76–85.
Lima R. (2013): More money in education makes economy best? Statistika: Statistics and Economy Journal, 93: 63–84.
Mathijs E., Vranken L. (2000): Farm restructuring and efficiency in transitions: Evidence from Bulgaria and Hungary. In: American Agricultural Economics As-sociation Annual Meeting, Tampa: 1–26.
Scheel H. (2000): EMS: Efficiency Measurement System, User’s Manual. Version 1.3. Dortmund. Available at http://www.scheel-online.de/ems/ems.pdf
Stavárek D. (2006): Banking efficiency in the context of European integration. Eastern European Economics, 4: 5–31.
Stavárek D., Řepková I. (2012): Efficiency in the Czech banking industry: a non-parametric approach. Acta Universitatis Agriculturae et Silviculturae Mendelianea Brunensis, 2: 357–365.
Šoltés V., Gavurová B. (2013): Application of the cross impact matrix method in problematic phases of the Balanced Scorecard system in private and public sec-tor. Journal of Applied Economic Sciences, 1: 99–119. Špička J. (2014): The regional efficiency of mixed crop and
livestock type of farming and its determinants. Agris On-line Papers in Economics and Informatics, 1: 99–109. Zamanian G.R., Shahabinejad V., Yaghoubi M. (2013):
Application of DEA and SFA on the Measurement of Agricultural Technical Efficiency in MENA Countries. International Journal of Applied Operational Research, 2: 43–51.
Received: 23th June 2014 Accepted: 10th September 2014
Contact address:
Kristína Kočišová, Technical University of Košice, Faculty of Economics, Department of Banking and Investment, Nemcovej 32, 04001 Košice, Slovak Republic