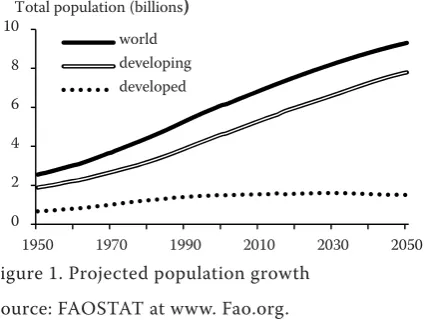
World population has more than doubled during the past 50 years and it possibly will keep increasing up to 7.56 billions by 2020, 8.18 billions by 2030 and 9 billion by 2050 (FAO 2003) as shown in Figure 1.
Not only the total amount but also the structure of population changed. In 1950, only 30% of the global population were urban dwellers, while in the recent years, this percentage has exceeded 50%, and more than 95% of the net increase in the global population will be in the cities of the developing world, which
will approach the 80% urbanization level of the most industrialized nations today (Grimm et al. 2008). The structural changes in addition to the total amount changes of population will place an extra impact on food consumption. The central question is whether and how the global food production may be increased to provide enough food for the coming population expansion (Kendall and Pimentel 1994).
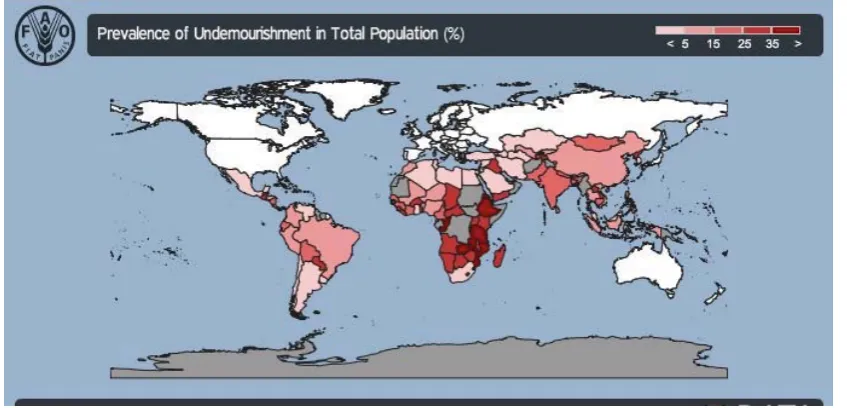
The world currently produces enough food for its citizens (FAO 2011). However, food demand is only met in the aggregate, as there are profound disparities in access to food across the geographic regions and across the spectrum of incomes at both the household and country levels. Despite considerable efforts to combat the global hunger, 925 million people were undernourished in 2010, while the number of over-weight and obese people, across the developed and developing worlds, rose to 1.5 billion in 2008 (FAO 2012). The rise of this extreme discrepancy provides new and unique challenges to households and govern-ments as they strive to provide a sustainable dietary sustenance to citizens (WHO 2011). Figure 2 shows the prevalence of undernourished people over the world in 2012.
A simple global food system model
Li JIANG
, Xuefeng CUI
1, Xia XU
1, Yuan JIANG
1, Mark ROUNSEVELL
2,
Dave MURRAY-RUST
2, Yinghui LIU
31State Key Laboratory of Earth Surface Processes and Resource Ecology, Beijing Normal
University, Beijing, China
2School of GeoSciences, University of Edinburgh, United Kingdom
3College of Resources Science and Technology, Beijing Normal University, Beijing, China
Abstract:In this study, we develop a simple dimension model to construct the food system in response to the population
growth, the land use change and various socio-economic developments. Th e model simulates the consumption and
pro-duction of agricultural goods in the individual countries, and maintains the global balance of food through the international trade fl ows between countries. Although there are some biases in the model results at the country levels, we suggest that such a simple model is feasible for simulating the global food supply system and assessing the uncertainties coming from various environmental and socio-economic factors.
Key words: food model, consumption and production, food trade
Supported by the National Basic Research Development Program of China (Grant No. 2011CB952001), National Science Foundation of China (Grant No. 41271542); Program for New Century Excellent Talents in University (Grant No. NCET-09-0227), the Fundamental Research Funds for the Central Universities and the Scientific Research Foundation for the Returned Overseas Chinese Scholars, State Education Ministry.
0 2 4 6 8 10
1950 1970 1990 2010 2030 2050 Total population (billions)
[image:1.595.67.281.536.696.2]world developing developed
Figure 1. Projected population growth
As shown by the FAO and others, food consumption varies widely between countries and among different cultures. The average caloric intake in the least devel-oped, developing, and industrialised countries varies widely (FAO 2011). In addition, some food safety risks are greater in developing countries, where the lack of access to extension services, to market information, to physical markets via sufficient infrastructure, and to agricultural inputs pose greater risks to human health and poverty than in the developed countries.
New challenges also emerge such as the climate change. It is clear from the above review that although the world food production has increased substantially in the past century, the current food supplies, with the present patterns of distribution and consumption, appear insufficient to provide diets to all (Kendall and Pimentel 1994). It is also of importance to note that only available food does not assure access to food, the distribution of the available food is critical, so the challenges of providing a stable physical, social and economic access to the adequately nutritious food define the food security agenda (Groot et al. 1998). Many studies have been developed in the last decade. Global food system is one of them.
The global food system is a network of organizations working together in different processes and activi-ties in order to bring products and services to the market, with the purpose of satisfying the customers’ demands (Christopher 2005). The emergence of the global food system is the outcome of a long line of developments in the globalization and safety man-agement. Under the background of globalization, the
food trade , which can affect the relationship between the international grain supply and demand, gradu-ally become the importance factor of food security and each country’ s food security have been linked to the international grain market(Feng et al. 2010). So in the today’s world, the food crisis is no longer the traditional food production shortage crisis, but the entire food industry process crisis including the food production, trade and consumption (FAO 2008).
The global system of agricultural products is im-portant, in terms of consumption and the monetary value. It can also offer the potential for shifting the production of food commodities out of their ‘in-dustrial mode’ and through developing new qual-ity definitions associated with localqual-ity/region or speciality and nature, new associational networks can be built (Murdoch et al. 2000). The food system may be considered an integrated process in which a group of several organizations, such as suppliers, producers, distributors and retailers, work together to acquire raw materials with a view to converting them into end products which they distribute to retailers (Beamon 1998).
Mathematical model is a useful tool to study the interaction between different factors of food security across the scales based on the methods of systems analysis. The traditional crop model, based on the crop growth process of natural factors, often focuses on the influence of the production of grain and it is incapable to consider the socio-economic factors (Wu et al. 2011). Food consumption models try to project the consumption by income, consumption per
[image:2.595.86.510.513.717.2]
Figure 2. The prevalence of undernourished people over the world in 2012
capita and the coefficient of urbanization (Yao et al. 2011). The trade balance model following the theory of market equilibrium is more widely used to study the food security, including the GTAP (Taheripour and Tyner 2011), the IMPACT (Rosegrant 2008) and the CGE Model (Computable General Equilibrium Model). The trade equilibrium model can reflect the price fluctuation in the international agricultural product market, but it is based on the simulation of the planned scenarios and without consideration of the land use type transition.
Therefore, the food security research needs to develop an entire process model integrating the food production driven by natural force and the food con-sumption driven by socio-economic force which also reflect the allocation between different regions by the food trade.
MODEL DESCRIPTION
The global food system (GLOBFOOD) model is designed to simulate the balance of the agricultural commodities between the production and consump-tion at the global level through the trade flows between countries (Van Tongeren et al. 2001). The dynamics of the modelled system will be driven by changes on the demand-side for agricultural goods arising from the trends in population, consumer preferences, economic development and international trade agreements, and on the supply-side of production arising from the climate change, technological development and management improvements.
The model is constructed within the SIMILE de-clarative modelling framework (Muetzelfeldt and
Massheder 2003; http://www.simulistics.com), which facilitates its testing through the sensitivity and un-certainty analysis. Demonstrated in Figure 3, the model is composed by a global trade market module and 160 countries units, which are made up from 4 sub-models: consumption, production, land-use, and trade. We apply the basic economic rules in the model concept, i.e. demand determines production. The model comprises 160 countries. Each country is a model unit. It acts independently in a way to calculate its total consumption and production, but it also interacts with other countries by the import/ export commodities. In the model, we only simulate the changes of all commodities basing on one base-line. The world total production and consumption will be balanced up.
For the given socio-economic situation, such as the population growth, the GDP per capital, the glob-al trade, the consumption structure and the yield changes, the model applies regression variability in consumption between countries to simulate the historic consumption per country along its GDP per capita changes. And then, the GLOBFOOD model simulates competition and the equilibrium point in several land-intensive sectors and it quantifies the demand for the area of different land use types. Finally, the model optimizes the allocation of different land use requirements under the different balance between food supplies and demands caused the by the dynamic changes in the socio-economic structure.
Consumption module
[image:3.595.63.348.560.762.2]Population growth is the primary driving force for the development of agriculture food production.
World population has more than doubled during the past 50 years and it possibly will keep increasing up to 7.56 billion by 2020 and 8.18 billion by 2030 (FAO 2003). Not only the population, but also the structural changes in addition to the total amount changes will place an extra impact on the food con-sumption.
Pressures on food supplies come not only from the steadily growing populations but also from the changes in the food consumption per capita and food preferences. The proportion of meat in national diets varies from negligible in some countries in Central Africa to 30–40% in some countries in Latin America and Mongolia (Gill 1999). Apart from the dietary habits, the societal structure (Rockwell 1994) and the religious beliefs, food preference is highly related with the individual’s wealth (Gill 1999). Higher liv-ing standards in richer countries may mean higher meat consumption; for example, the average meat consumption in the United States is 120 kg/year per capita, which is more than three times the world average (Eckardt et al. 2009).
In this paper, the global food consumption structure will be divided into three major types; they are the consumption of cereal, the consumption of meat, and the milk consumption. Here we examine the relationship between the GDP per capita and the meat and milk consumption. We will apply this re-gression variability in the food consumption between countries to simulate the historic consumption per country along its GDP per capita changes, although the problems of causality of course remain (Lambin et al. 2000).
The relationship for the meat consumption per capita can be simply described as:
m t t P P M M 0 0
where Mtand M0 stand for the meat consumption per capita at the time of t and a reference baseline respectively; Pt and P0 stand for the GDP per capita at the time of t and a reference baseline; m is a chang-ing parameter.
The milk consumption can be described similarly in:
n t t P P N N 0 0
where Nt and N0 stand for the milk consumption per capita at the time of t and a reference baseline; Pt
and P0 stand for the GDP per capita at the time of t
and a reference baseline; n is a changing parameter.
To sum up, the pressures on food consumption come not only from the growing population, but also from the food consumption per capita and food pref-erences such as the dietary habits, social structure, religious beliefs and the individual’s wealth. In our model, the consumption demand is calculated from the consumption per capita, which is influenced by the population growth and the GDP per capita in each country. Then, the production module translates the consumption demand into the agricultural land use that can meet it in each country. The different type of food demands determine the major transition of the land use between the agricultural arable land and other land sectors, i.e. the forest and grassland. We will explain it further in the following sessions.
Production module
To increase the production of edible-type crops, particularly cereals, is a principal concern in the global food sector (Wirsenius 2003). The increase could be met either through the expansion of agricultural area or through the intensification with the optimized al-location of world products (Balmford et al. 2005). The crop yield is not only affected by the climate change, the impact of which varies by region, but it is also de-termined together by the technological sophistication (Ewert et al. 2005), the governmental environmental policy and the current natural available resources. The productivity gains, however, have been uneven across regions (Evenson and Gollin 2003).
In the model, to simplify the process, we only cal-culate the dynamics of the cropland for cereal growth as cereal is the major commodity in the model simula-tion. That means we convert the milk consumption demand into the meat demand by assuming that the sources used to provide milk could provide meat as well, and then, by converting meat into cereal will also help to understand the land use changes associ-ated with the changes.
Finally, the per capita consumption in each region is converted into the total regional demand for crops by taking into account the region’s population and the additional amount of crops needed as the feed for animals. The total regional demand is then converted into the land use demand for each region by including the interregional trade of crops and animal products.
Land-use module
or biennial type and require cultivable land for their production (Wirsenius 2003). In the GLOBFOOD, we treat land as its functions (Verburg et al. 2009), such as the provider of crops, forest, or, and it will change based on a certain understanding of the land-use de-cisions representing the shifts of land requirements from one world region to another.
The GLOBFOOD simulates the LUC at the country scale with focus more on the total outcome of the land use rather than on its allocation, which provides an appropriate framework to the model competition and the resulting changes between two land-intensive sectors (agriculture and forestry). An important aspect for the treatment of land in the production process is the heterogeneity of land, which is determined by the biophysical characteristics of land, the societal setting of land management (Müller and Munroe 2008) and political decisions (Geist and Lamibin 2004). Many nations face declining areas of arable land due to water shortages, soil erosion, and desertification (Eckardt et al. 2009). All these factors will be formed into the scenario design, for example they could be assigned to a certain rate of changes for specific countries in the short period projection.
In our model, the basic assumption is that the rate of the cereal cropland in the total arable land is deter-mined by the market demand. So the different types of food demands determine the major transition of the land use between the agricultural arable land and other land sectors, i.e. the forest and grassland for production. We also apply some parameters such as the yield changes and the rates to serve as a useful independent check of the model calculations.
Global trade market module
The global trade method calculates the balance of agricultural commodities between production and consumption at the global level through the trade flows between countries (Van Tongeren et al. 2001; Tebaldi and Lobell 2008; Van Tongeren 2008).
The global trade market module is aiming to simu-late the land allocation by the explicit demand sup-ply functions of the land-intensive sectors under certain exogenously defined constraints, including international environmental agreements, global businesses, the technology transfer, and the market integration. The translation of the demand to land systems is, however, typically mediated by the local policies and institutions (Angelsen and Kaimowitz 1999). Additionally, trade agreements may alter the national competitiveness for natural resources (e.g.
agricultural production), and, consequently, they result in a change in the resource extraction.
In the GLOBFOOD, the implementation of a quasi-liberalized trade market creates a complicated set of environmental effects – some negative, some positive, and in some cases a link to the food safety issues. This includes that the goods are homogenous and priceless, distinguished by the producer and origin, implying that neither the bilateral trade flows nor the industrial trade can be represented appropriately (Van Tongeren et al. 2001). To guarantee the market closure, the remaining market (and feedbacks with agricultural sectors) is largely ignored in the model as it is assumed that the markets of interest are neg-ligible for the rest of the economy. Food stocks are not taken into account in the model as they are too random to be simulated either on the country or international level. World grain stocks have fallen annually for the last 10 years and they are now at the lowest level since 1960, as consumption of grain has outpaced the production for years (Brown and Funk 2008).
MODEL EVALUATIONS
The validation/evaluation is an essential process during the model development as it concerns how well the model outcomes represent the real system behaviour, which involves comparing the model outputs with the real-world observations or the product of another model or theory assumed to adequately characterize the reality (Parker et al. 2003). Our model takes some of the parameters from the literature and others based on historical data, therefore, the set of parameters needs be tested to be able to reproduce the history for a relatively long period as a part of very important evaluation criteria (Pindyck and Rubinfeld 1998). In this respective, the model is validated empirically (Meyer and Turner 2003) and is suitable for the time series simulation if the equations are adapted until the development of endogenous variables tracks the historical data very closely.
Data input
has a quite high uncertainty and have often been updated. Table 1 lists the details of the data used and the locations from where to download them.
Experimental setup
We design an experiment to simulate the evolu-tion of the food system and the associated land use between 1970 and 2000 with the following settings in order to evaluate the model performance against the FAO records.
(1) The model initialised from year 1970 with the series data from the FAO including the food con-sumption and production, the population and the historical land-use patterns and the cereal yield and the GDP data from the GSCRP. In addition to the primary food consumption, we also take into account the processed food products in our calculation, which account for an increasing share of the world market (Van Tongeren et al. 2001). We try to use data for one set of parameters from a single resource to reduce systematic biases and carefully reflect the consistency between the input data in order to avoid artifacts in the calibration of model parameters. We are confident with that the data applied in the GLOBFOOD are roughly reliable at the country level, and especially at the aggregated global scale.
(2) As we discussed earlier, the GLOBFOOD simulates the global food system by the driving forces of the population and the GDP, and the area of cereal arable land is calculated by the cereal production divided by the cereal yield. We setup a storyline by the combination of the observed data in years of 1980, 1990 and 2000, which shows a pathway of the population, the GDP and the cereal yield changes during the past 30 years.
(3) We assume some environmental data (terrain, ir-rigation and soil conditions) which determine the environmental suitability for different land-use types and socioeconomic data (market structures, diet habits and governance) as the drivers and consequences of the LUC keeping unchanged for all the countries during the past 30 years. The land conversion is allocated between the forest, grassland and the cereal crop land only while we assume the arable land for vegetables and cash crops unchanged. Countries which have expe-rienced political or administrative changes are artificially kept as it is in the year of 1970 to make the system sustain, including the SSSR, Belgium-Luxembourg, Yugoslavia SF and Czechoslovakia. (4) Between 1975 and the year 2000, the world lost
[image:6.595.62.532.483.762.2]22 percent of its high-potential agricultural land (FAO 2003). Agricultural production will have to expand onto the medium- and low-potential
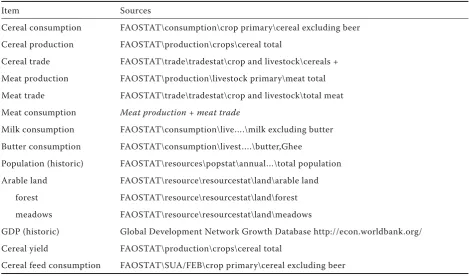
Table 1. The data used and the locations
Item Sources
Cereal consumption FAOSTAT\consumption\crop primary\cereal excluding beer
Cereal production FAOSTAT\production\crops\cereal total
Cereal trade FAOSTAT\trade\tradestat\crop and livestock\cereals +
Meat production FAOSTAT\production\livestock primary\meat total
Meat trade FAOSTAT\trade\tradestat\crop and livestock\total meat
Meat consumption Meat production + meat trade
Milk consumption FAOSTAT\consumption\live….\milk excluding butter
Butter consumption FAOSTAT\consumption\livest….\butter,Ghee
Population (historic) FAOSTAT\resources\popstat\annual…\total population
Arable land FAOSTAT\resource\resourcestat\land\arable land
forest FAOSTAT\resource\resourcestat\land\forest
meadows FAOSTAT\resource\resourcestat\land\meadows
GDP (historic) Global Development Network Growth Database http://econ.worldbank.org/
Cereal yield FAOSTAT\production\crops\cereal total
lands that are not only less productive but also more fragile and susceptible to degradation. Soil is degraded mainly through the deforestation, agricultural activities, overgrazing, and over-exploitation. Therefore, we simply assign 0.2% of the cropland and 0.5% of the natural forest as degraded into the grassland and 0.3% of the grassland degradation rate.
(5) The aforementioned global trade market is a semi-free market in the GLOBFOOD, and in this experiment, we assume the global trade landscape unchanged during this period, i.e., the ratio of trade for one specific country in the global total trade commodities are kept the same as in the year 1970 during the whole period.
(6) To apply a different environmental or agricultural development policy, we divided the 160 countries into the environment-friendly (developed and eco-nomic transition) countries and the agriculture-driven (developing and least developed) countries. The environment-friendly countries will prioritize their environment by the means of conversion of the cropland (the oversupplied area, but not more than 20% of its total cropland area) into the forest, if the domestic production is higher than the sum of its domestic consumption and the net trade in the previous year. The agriculture-driven countries always tend to increase their domestic production by the conversion of the forest into a new cropland.
Results analysis
The results are validated for the consumption, pro-duction and land use changes at the aggregated global level and for some major countries as well. Figure 4
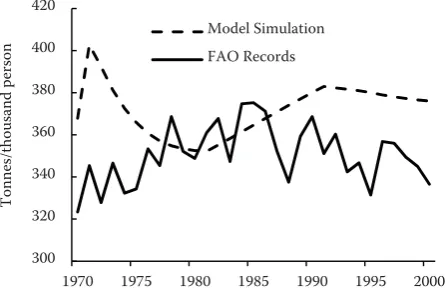
shows the comparison of the global consumption be-tween the model simulation and the FAO records. The GLOBFOOD quite well reproduces the world doubled consumption of cereals for food due to the doubled population during the past 30 years. It also simulates well the 150% increase of the global meat consumption as people eat more meat when they become richer. Milk has a slightly increasing tendency during this period and the model seems to underestimate it a little. It is not surprising to see that the curves produced by the model are smoother than the actual records, as we linearly interpolate the driving forces between the years of 1970, 1980, 1990 and 2000.
To satisf y the global increase of consumption, the production needs to increase as well. Figure 5 shows that the total production of cereal produced by the GLOBFOOD follows quite well the FAO data, which almost doubled during the last 30 years from 1.17 billion tonnes in 1970 to 2.19 billion tonnes. However, the production per capita increases much less than the total production due to the higher population growth rate in the same period. The model produced a higher production per capita than the observed data in the last about 10 years, which might relate to the decrease of the food stock dur-ing the last 10 years (Brown and Funk 2008), which is not included in the model simulation to ease the consumption demand.
So far, we focus on the comparisons at the aggre-gated global scale. In general, we could conclude that the model system could reproduce the land use changes by simulating the global food system of con-sumption and production in providing the realistic storyline of the population, the GDP and the yield. Moreover, it will be really interesting to investigate how the model performs at the countries scale as
400 500 600 700 800 900 1000
1970 1975 1980 1985 1990 1995 2000
Million tonnes
Model Simulation FAO Records
300 320 340 360 380 400 420
1970 1975 1980 1985 1990 1995 2000
Tonnes/thousand person
Model Simulation
[image:7.595.64.278.573.723.2]FAO Records
Figure 4. The comparison of global consumption
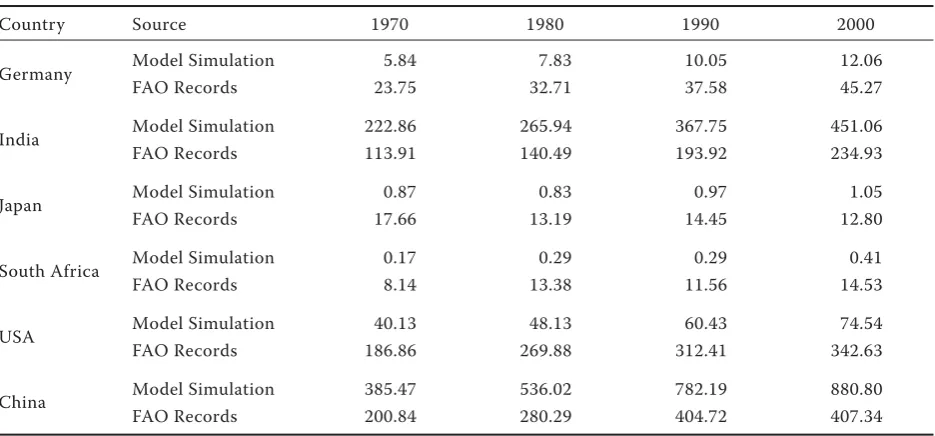
[image:7.595.306.529.576.723.2]the land use is simulated at the country level in the model and managed in the real world at the country or regional level. Among all the 160 countries in the model, the model needs to tackle properly those countries with a major cereal production. We choose 6 typical countries as our research areas. Table 2 lists the comparison of cereal production for 6 countries between the GLOBFOOD simulation and the FAO records in years of 1970, 1980, 1990 and 2000. The model simulates the trends correctly for most of the countries except some years. However, there is a clear bias for the model to overestimate the pro-duction in China and India as they are classified as the agriculture-driven countries in the model, while it underestimates the production in the rest of the countries listed here, which are all recognised as the environment-driven countries. This might imply that the environmental policy applied in this experiment might be too strong and the division into two groups might be too simple as well. As a simplified model, the GLOBFOOD contains many free parameters, meaning that it can be very data hungry (Parker et al. 2008). In addition to the data availability, the data quality differs between the regions and the national statistical data have a high uncertainty due to the possibly different standards.
DISCUSSION AND CONCLUSION
This paper has presented an approach of modelling the global food supply and demand, although mix mismatches are found for some countries, the
sim-ple GLOBFOOD model performs well at the global level comparing the FAO records, and the simulation results correctly reflect the global food supply and the demand change trends during the past 30 years. Food system is one kind of human-environment interactions characterized by such high degrees of complexity. We must realize that the implementation of the model is difficult due to the complex social realities and the analysis in different countries. It may be natural to wonder if the task of model-building is justified, given that we can be confident that our model will fall short of an exactly accurate representa-tion of the real-world system. It is convenient to fall back on the Box’s wisdom ‘‘All models are wrong, but some are useful’’ (Box 1979). Human decisions are influenced by individual preferences, group dynamics, and top-down social, political, and economic forces. It is clear that no one single model could adequately capture the complexity of human decisions, which depend heavily on drivers and context that vary over space and time (Parker et al. 2008).
[image:8.595.64.532.540.758.2]In this respective, any strategies for simplifying empirical models, that do not at the same time move the model away from a clear representation of the research question it investigates, are of practical use (Parker et al. 2008). Indeed, the use of simpler models, with their level of abstraction, often en-hances understanding of the major system controls. The process of model building can also be a process of knowledge building, especially as the members of interdisciplinary teams come to understand the diverse perspectives, concerns, and knowledge of their colleagues (Olson et al. 2008).
Table 2. Cereal production for 6 countries in1970, 1980, 1990 and 2000 (million tonnes)
Country Source 1970 1980 1990 2000
Germany Model Simulation 5.84 7.83 10.05 12.06
FAO Records 23.75 32.71 37.58 45.27
India Model Simulation 222.86 265.94 367.75 451.06
FAO Records 113.91 140.49 193.92 234.93
Japan Model Simulation 0.87 0.83 0.97 1.05
FAO Records 17.66 13.19 14.45 12.80
South Africa Model Simulation 0.17 0.29 0.29 0.41
FAO Records 8.14 13.38 11.56 14.53
USA Model Simulation 40.13 48.13 60.43 74.54
FAO Records 186.86 269.88 312.41 342.63
China Model Simulation 385.47 536.02 782.19 880.80
This simulation model has made it possible to ex-plore the global socio-economic influence on food supply and consumption changes, In the future work, we suggest a mixed approach which could improve our model at the countries scale and try to construct probabilistic projections of the future global food supply and the land use change.
REFERENCES
Angelsen A., Kaimowitz D. (1999): Rethinking the causes of deforestation: lessons from economic models, The
World Bank Research Observer, 14: 73–98.
Balmford A., Green P.E., Scharlemann J. (2005) Sparing land for nature: exploring the potential impact of changes in agricultural yield on the area needed for crop
produc-tion. Global Change Biology, 11: 1594–1605.
Beamon B.M. (1998). Supply chain design and analysis: Models and methods. International Journal of
Produc-tion Economics, 55: 281–294.
Box G.E.P. (1979): Robustness in the strategy of scientific model building. In: Launer R.L., Wilkinson G.N. (eds.): Robustness in Statistics. Academic Press, New York. Brown M.E., Funk C.C. (2008): Food Security under climate
change. Science, 319: 580–581.
Christopher M. (2005): Logistics and Supply Chain
Manage-ment: Creating Value-Adding Networks. 3rd ed. Financial
Times/Prentice Hall, Harlow.
Eckardt N.A., Cominelli E., Galbiati M., Tonelli C. (2009): The future of science: food and water for life. The Plant
Cell, 21: 368–372.
Evenson R.E., Gollin D. (2003): Assessing the impact of the
green revolution, 1960 to 2000. Science, 300: 758–762.
Ewert F., Rounsevell M.D.A., Reginster I., Metzger M.J., Leemans R. (2005): Future scenarios of European ag-ricultural land use. I. Estimating changes in crop pro-ductivity. Agriculture, Ecosystems and Environment,
107: 101–116.
FAO (2003): State of the World’s Forests. FAO, Rome. FAO (2008): The State of Food and Agriculture. Part I:
Bio-fuels: prospective, risks and opportunities. FAO, Rome. FAO (2011): State of the World’s Forests. FAO, Rome. FAO (2012): The State of Food and Agriculture. FAO, Rome. Feng Z., Zhao X., Yang Y. (2010): Evolutionary Trends of
World Cereal Trade in Recent 50 Years from a View of Spatial-Temporal Patterns and Regional Differences. Evolutionary Trends of World Cereal Trade in Recent 50 Years from a View of Spatial-Temporal Patterns and
Regional Differences. Resources Science, 32: 2–10.
Geist H.J., Lambin E.F. (2004): Dynamic causal patterns of
desertification. BioScience, 54: 817–829.
Gill M. (1999): Meat production in developing countries.
Proceedings of the Nutrition Society, 58: 371–376.
Grimm N.B., Faeth S.H., Golubiewski N.E., Redman C.L., Wu J., Bai X., Briggs J.M. (2008): Global change and the
ecology of cities. Science, 319: 756–760.
Groot J.J.R., Penning de Vries F.W.T., Uithol P.W.J. (1998): Food supply capacity study at global scale. Nutrient
Cycling in Agroecosystems, 50: 181–189.
Kendall H.W., and Pimentel D. (1994): Constraints on the
expansion of the global food supply. Ambio, 23: 198–205.
Lambin E.F., Rounsevell M.D.A., Geist H.J. (2000): Are agricultural land-use models able to predict changes in land-use intensity? Agriculture, Ecosystems and
Envi-ronment, 82: 321–331.
Müller D., Munroe D.K. (2008): Changing rural landscapes in Albania: Cropland abandonment and forest clearing in the postsocialist transition. Annals of the Association
of American Geographers, 98: 855–876.
Murdoch I., Marsden T., Banks J. (2000): Quality, nature and embeddedness: Some theoretical considerations in the context of the food sector. Economic Geography,
76: 107–125.
Olson J.M., Alagarswamy G., Andresen J.A., Campbell D.J., Davies A.Y., Ge Jianjun, Huebner M., Lofgren B.M., Lausch D.P., Moore N. J., Pijanowski B.C., Qi J., Thornton P.K., Torbic N.M., J. Wang J.: (2008) Integrating diverse methods to understand climate-land interactions in East
Africa. Geoforum, 39: 898–911.
Parker D.C., Hessl A., Davis S.C. (2008): Complexity, land-use modeling, and the human dimension: Fundamental challenges for mapping unknown outcome spaces.
Geo-forum, 39: 789–804.
Parker D.C., Manson S.M., Janssen M.A., Hoffmann M.J., Deadman P. (2003): Multi-agent systems for the simula-tion of land-use and land-cover change: a review.
An-nals of the Association of American Geographers, 93:
314–337.
Pindyck R., Rubinfeld D. (1998): Econometric Models and Econometric Forecast. McGraw-Hill, New York. Rockwell R. (1994): Culture and cultural change. In: Meyer
W., Turner II B. (eds.): Changes in Land Use and Land Cover: A Global Perspective. Press Syndicate of the Uni-versity of Cambridge, Cambridge, pp. 357–382. Rosegrant M.W. (2008): Biofuels and Grain Prices: Impacts
and Policy Responses. IFPRI, Washington.
Taheripour, F., Tyner W. (2011): Introducing First and Sec-ond Generation Biofuels into GTAP Data Base version 7. GTAP Research Memoranda, GTAP Research Memo-randa 3477. Center for Global Trade Analysis, Depart-ment of Agricultural Economics, Purdue University. Tebaldi C ., Lobell D.B. (2008): Towards
crop yields. Geophysical Research Letter, 35 (8); doi: 10.1029/2008GL033423.
Van Tongeren F. (2008): Agricultural Policy Design and Implementation: A Synthesis. OECD Food, Agricul-ture and Fisheries Working Papers No. 7; doi: 10.1787/ 243786286663.
Van Tongeren F., van Meijl H., Surry Y. (2001) Global mod-els applied to agricultural and trade policies: a review
and assessment. Agricultural Economics, 26: 149–172.
Verburg P.H., van de Steeg J., Veldkamp A., Willemen L. (2009): From land cover change to land function dynam-ics: A major challenge to improve land characterization.
Journal of Environmental Management, 90: 1327–1335.
WHO (2011): World Health Statistics 2011. WHO, Swit-zerland
Wirsenius S. (2003): Efficiencies and biomass appropria-tion of food commodities on global and regional levels.
Agricultural System, 77: 219–255.
Wu W., Tang H., Yang P., You L., Zhou Q., Chen Z., Shiba-saki R. (2011): Scenario-based assessment of future food
security. Journal of Geographical Sciences, 21: 3–17.
Yao P., Liu L., Chen Z. (2011): Analysis on influencing fac-tors and trend of grain consumption for rural residents. Journal of Huazhong Agricultural University (Social
Sciences Edition), 39: 26–30.
Received: 9th April 2013
Accepted: 28th August 2013
Contact address:
Xuefeng Cui, State Key Laboratory of Earth Surface Processes and Resource Ecology, Beijing Normal University, Beijing, 100875, China