Evaluation of the influence of fermentation input
substrates preparation on biogas production intensity
D. Sochr
1, R. Adamovský
2, J. Kára
3, I. Hanzlíková
31
Blue Power – Energetické systémy s.r.o., Nenačovice, Czech Republic
2
Department of Mechanical Engineering, Faculty of Engineering, Czech University
of Life Sciences Prague, Prague, Czech Republic
3
Research Institute of Agricultural Engineering, Prague, Czech Republic
Abstract
Sochr D., Adamovský R., Kára J., Hanzlíková I., 2014. Evaluation of the influence of fermentation input
sub-strates preparation on biogas production intensity. Res. Agr. Eng., 60: 60–67.
The article is aimed at verification of the effect of chaff length of fermented material and duration time of the contact of material with oxygen before dosing into the fermenter, on production and energy content of biogas. The results of the verification showed an effect of chaff length in the fermented material on production and energy content of the biogas at processing grass silage with high content of dry-matter and especially maize silage. When processing maize silage, optimal length of chaff in terms of production and energy content of biogas was 13 mm, with grass silage it was from 69 to 112 mm. Verification of the influence of time of grass silage and maize silage contact with air oxygen before dosing into the fermenter did not confirm our hypothesis. It was demonstrated that production and energy content of the biogas increase together with the length of duration of 7 days compared to fermentation of material after max. 3 h of contact with air oxygen.
Keywords: biogas plant; energy crop; grass silage; maize silage; energy content
Our works were aimed at verification of the ef-fects of grass silage and maize silage particle sizes and contact of these substrates with air oxygen be-fore dosing into a fermenter on the intensity of pro-duction and quality of biogas. The purposely grown energy crops can be best applied in biogas plants (BP) mixed in certain ratios and shapes. The task of our works was to find the optimal particle sizes of both substrates for use in BP in form of anaero-bic digestion and to determine the effect of contact of these substrates with air oxygen before dosing into a fermenter on overall biogas production ef-ficiency. To reach these tasks there were numbers of fermentation tests performed with the following results.
lies in frequent content of impurities (stones, clay) due to poor condition of the vegetation. Produc-tion of grass silage does not bring negative conse-quences for the land under cultivation since grass lands do not require chemical treatment and they create a suitable cover that prevents soil erosion. Use of grass silage in BP brings increased demands on proper handling of BP and preparation of sub-strate; it is especially about compliance with right size of chaff (Pastorek et al. 2004).
Maize silage is most often used and purposely grown energy crop. Literature sources (Herout et al. 2011) show that the total amount of maize silage on all substrates used in BP in Europe is approxi-mately 34%. Reasons for widespread use of maize silage consist in high yields, suitable composition and dry-matter and also experience with growing the maize. Good-quality harvest, preparation and storage of the substrate prior to dispensing into the fermenter may sometimes be a problem. Ma-jor problem in growing the maize lies in a negative impact on soil erosion and intensive treatment with chemical products. We can therefore expect some reduction in maize production as purposely grown energy crop, and its replacement by alternative per-ennial crops.
Impact of particle size of the silage materials on quality of silage and formation of methane was dealt with in Herrman et al. (2012). They stated that the silage had higher content of lactic acid with the length of chaff 6–33 mm and that methane pro-duction increased by 11–13% compared to produc-tion of methane in longer lengths of the chaff. Ma-sahiko and Kengo (2012) reported, that larger surface and higher rate of porosity of materials are important factors affecting degradation of the ma-terial and production of biogas at BP.
Transporta-tion alternatives and optimizing of logistics chains of major energy crops for BP in terms of financial costs, biogas production and impact on the envi-ronment, that was dealt with in Miao et al. (2012). They placed a particular emphasis on configuration of BP equipment.
MATERIAL AND METHODS
Subject of the examination consisted in the fol-lowing points:
– impact of the length of chaff in grass silage and maize silage on production and energy content of the biogas;
– impact of duration time of grass silage and maize silage contact with air oxygen before dosing into the fermenter on production and energy content of the biogas.
When verifying the length of chaff, chaff lengths of 220, 112 and 69 mm were monitored in grass silage. Maize silage was cut to the lengths of 22, 13 and 5 mm. A fermentation test was carried out with individual samples, with the residence time of 43 days. There were samples of the total weight of 1 kg weighed in the laboratory fermenter (1 l labo-ratory fermenter; Research Institute of Agricultural Engineering, Prague, Czech Republic). Regarding the grass silage, the ratio of BP digestate and silage dry-matter was 1:1. Regarding the maize silage, the dry-matter contained 60% of silage and 40% of BP digestate. Always 3 equal samples were fermented in order to eliminate errors in their establishment. The fermentation tests were performed at the ex-perimental fermentation facility in the Research Institute of Agricultural Engineering (1 l laboratory fermenter, Research Institute of Agricultural
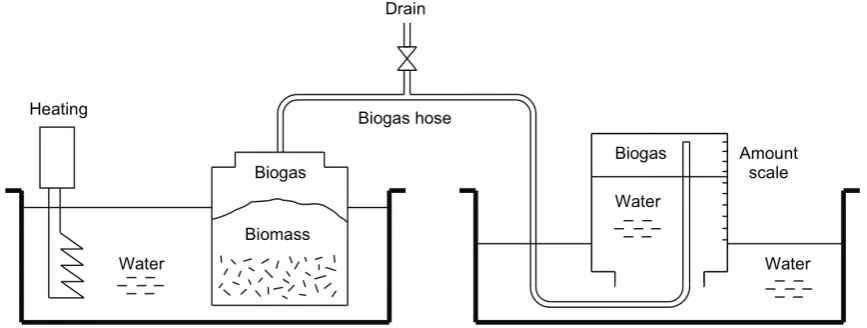
Engi-Fig. 1. Experimental fermentation facility scheme
[image:2.595.79.513.576.740.2]neering, Prague, Czech Republic), Prague, Czech Republic. The experimental fermentation facility scheme is shown in Fig. 1.
When verifying the influence of time of grass si-lage and maize sisi-lage contact with air oxygen, the fermented samples were to be tested:
– immediately after removal from the storage space, the residence time before dosing in experimental fermenters did not exceed 3 h;
– after simulated 7-day delay in air oxygen; – after simulated 14-day delay in air oxygen.
During fermentation tests, we monitored: – amount of biogas produced;
– biogas composition in terms CO2, CH4 and O2 content;
– calorific value of the biogas produced.
Of the total amount of produced biogas and con-tent of CH4 energy content of individual samples was calculated and consequently also cumulative energy content for all the time of material delay in the fermenter was given.
The length of chaff of both materials was modified by cutting in the electric chipper Viking GE 150 (Vi-king AG, Langkampfen, Austria). Biogas composition
was analysed by infrared biogas analyser Aseko Air LF (ASEKO s.r.o., Vestec u Prahy, Czech Republic).
RESULTS AND DISCUSSION
Grass silage
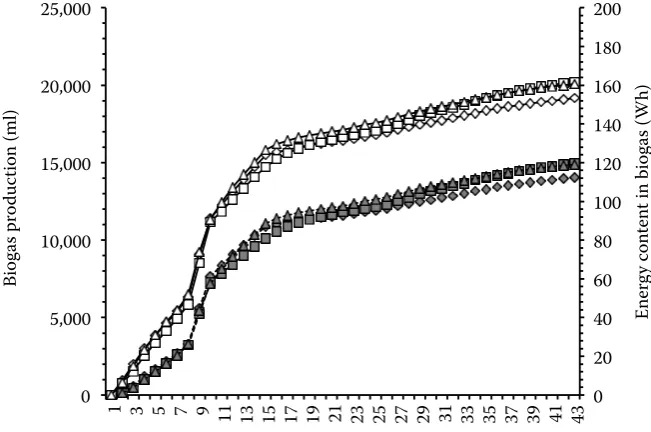
Results of monitoring the cumulative biogas pro-duction from grass silage and energy content of the biogas at the levels of verified lengths are shown in Fig. 2. Fig. 2 shows that the differences in biogas production and energy content of the biogas gained with individual lengths of chaff are negligible. Veri-fication confirmed the hypothesis saying that grass silage has, unlike maize silage, substantially longi-tudinal character. It means that increase of specific surface of chaff particles does not occur in case of chaff length reduction.
The dependence graph of the biogas energy con-tent on sizes of chaff of grass silage (Fig. 3) clearly shows that the changeable size of the chaff has no significant effect on the energy content. For cor-rect sizing of the chaff, it is advisable to use
em-0 20 40 60 80 100 120 140 160 180 200
0 5,000 10,000 15,000 20,000 25,000
1 3 5 7 9 11 13 15 17 19 21 23 25 27 29 31 33 35 37 39 41 43
Ene
rg
y
co
nt
en
t in bi
og
as
(Wh)
Bi
og
as p
ro
du
ction (
ml
)
Time of delay in fermentation (days)
[image:3.595.65.391.86.302.2]Biogas production – uncut haylage – average particle size 220 mm Biogas production – 2× cut haylage – average particle size 112 mm Biogas production – 4 × cut haylage – average particle size 69 mm Energy content – uncut haylage – average particle size 220 mm Energy content – 2× cut haylage – average particle size 112 mm Energy content – 4 × cut haylage – average particle size 69 mm
pirical knowledge which is based mainly on good workability, transport and especially easy use in BP. Practice shows that the ideal size of the chaff in grass silage, which does not clog components of BP or does not form floating layers in the fermenter, ranges from 50 to 70 mm.
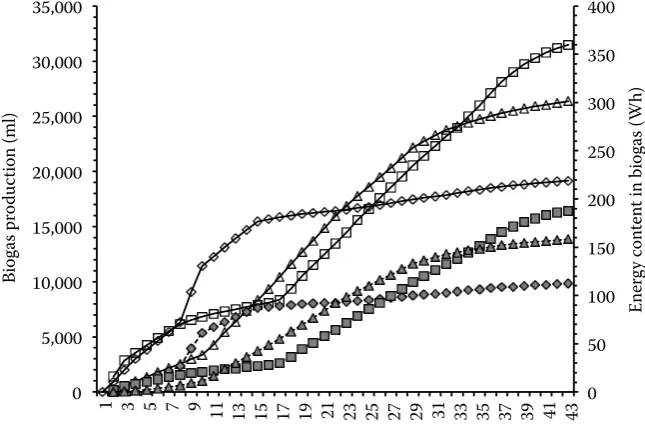
Results of monitoring the cumulative biogas pro-duction from grass silage and energy content of the biogas at verified duration times of contact with air oxygen are shown in Fig. 4.
Measurement results show that the cumulative bi-ogas production and its energy content increase when compared to the expected hypothesis at delay of mate-rial in air oxygen. The increase of the total received en-ergy in the biogas obtained from the sample of 7-day delay was 67%, compared to the sample without delay. At 14-day delay of material, some reduction of the to-tal gained energy by 16% was recorded, compared to the sample of 7-day delay. This fact can be explained by increase of other biologically well-degradable biomass
118.273 121.025
119.035
111.114 121.879
114.270
107.309 116.084
123.787
106 108 110 112 114 116 118 120 122 124 126
0 50 100 150 200 250
Ene
rg
y
co
nt
en
t in bi
og
as
(Wh)
Particle size of grass haylage (mm)
118.273
184.281
149.855
111.114
185.412
163.878
107.309
193.417
161.151
80 100 120 140 160 180 200 220
0 5 10 15
Ene
rg
y
co
nt
en
t in bi
og
as
(Wh)
Contact with air oxygen before fermentation (days)
106.795 143.765
8.986
116.453 137.834
103.974 135.927
0 20 40 60 80 100 120 140 160
0 5 10 15 20 25
Ene
rg
y
co
nt
en
t in bi
og
as
(Wh)
[image:4.595.70.362.85.252.2]Particle size of maize silage (mm)
Fig. 3. Dependence of the biogas energy content on the length of chaff in grass silage (always 3 identical samples for each size of chaff)
0 50 100 150 200 250 300 350 400
0 5,000 10,000 15,000 20,000 25,000 30,000 35,000
1 3 5 7 9 11 13 15 17 19 21 23 25 27 29 31 33 35 37 39 41 43
Ene
rg
y c
on
te
nt in bi
og
as
(Wh)
Bi
og
as p
ro
du
ction (
ml
)
Time of delay in fermentation (days)
Biogas production – haylage fermented immediately after extraction Biogas production – haylage fermented 7 days after extraction Biogas production – haylage fermented 14 days after extraction Energy content – haylage fermented immediately after extraction Energy content – haylage fermented 7 days after extraction Energy content – haylage fermented 14 days after extraction
Fig. 4. Cumulative amount of biogas and energy content of biogas at verified duration times of contact of grass si-lage with air oxygen
[image:4.595.67.390.427.641.2]in the sample, in the form of aerobic bacteria, moulds and fungi. Another factor may be partial decomposi-tion of biomass by aerobic organisms and subsequent improved accessibility for anaerobic methanogenous bacteria. These facts probably surpassed the negative effects of mycotoxins and inhibitory substances pro-duced by fungi and moulds, whose negative effects began to surpass during longer delay in air oxygen. For this reason, the total energy obtained in the sample of 14 days began to decline again.
The above-mentioned findings also support the recently discussed biomass processing by using so-called AAA procedure that looks as beneficial in the empirical point of view. In this process, this is a case of aerobic preparation of biomass, anaerobic processing in BP and aerobic stabilization of the di-gestate.
Fig 5. shows that the time of grass silage contact with oxygen has a significant impact on the energy content of biogas.
118.273 121.025
119.035
111.114 121.879
114.270
107.309 116.084
106 108 110 112 114 116 118 120 122
0 50 100 150 200 250
Ene
rg
y
co
nt
en
t in bi
og
as
(Wh)
Particle size of grass haylage (mm)
118.273
184.281
149.855
111.114
185.412
163.878
107.309
193.417
161.151
80 100 120 140 160 180 200 220
0 5 10 15
Ene
rg
y
co
nt
en
t in bi
og
as
(Wh)
Contact with air oxygen before fermentation (days)
106.795 143.765
8.986
116.453 137.834
103.974 135.927
0 20 40 60 80 100 120 140 160
0 5 10 15 20 25
Ene
rg
y
co
nt
en
t in bi
og
as
(Wh)
[image:5.595.71.469.84.253.2]Particle size of maize silage (mm)
Fig. 5. Dependence of the energy con-tent of biogas on the duration time of grass silage contact with air oxygen (always 3 identical samples for each duration time)
0 20 40 60 80 100 120 140 160 180 200
0 5,000 10,000 15,000 20,000 25,000
1 3 5 7 9 11 13 15 17 19 21 23 25 27 29 31 33 35 37 39 41 43
Ene
rg
y c
on
te
tn
t in bi
og
as
(Wh)
Bi
og
as p
ro
du
ction (
ml
)
Time of delay in fermentation (days)
Biogas production – uncut silage – average particle size 22 mm Biogas production – 2× cut silage – average particle size 13 mm Biogas production – 4× cut silage – average particle size 5 mm Energy content – uncut silage – average particle size 22 mm Energy content – 2× cut silage – average particle size 13 mm Energy content – 4× cut silage – average particle size 5 mm
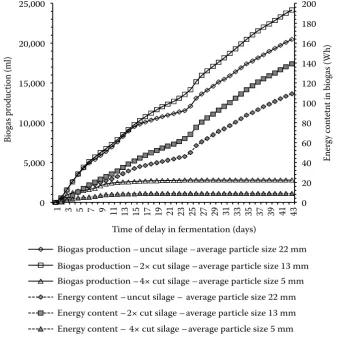
Fig. 6. Cumulative amount of biogas and energy content of biogas at different lengths of chaff of the maize silage
[image:5.595.65.404.421.765.2]Maize silage
Results of monitoring the cumulative biogas production from maize silage and energy content of the biogas at the levels of verified lengths are shown in Fig. 6.
The measurement results show that the size of chaff affects production of biogas and total energy content of the biogas from maize silage which can
be extracted from the silage within a limited resi-dence time in BP. It can be generally said that we confirmed the hypothesis saying that the increasing specific surface of chaff causes increasing of effi-ciency of anaerobic fermentation process. This fact is caused by disclosure of chaff biomass for metha-nogenous bacteria over a larger area. The same results were reached when monitoring the impact of the size and porosity of the silage materials on
118.273 121.025
119.035
111.114 121.879
114.270
107.309 116.084
123.787
106 108 110 112 114 116 118 120 122 124 126
0 50 100 150 200 250
Ene
rg
y
co
nt
en
t in bi
og
as
(Wh)
Particle size of grass haylage (mm)
118.273
184.281
149.855
111.114
185.412
163.878
107.309
193.417
161.151
80 100 120 140 160 180 200 220
0 5 10 15
Ene
rg
y
co
nt
en
t in bi
og
as
(Wh)
Contact with air oxygen before fermentation (days)
106.795 143.765
8.986
116.453 137.834
103.974 135.927
0 20 40 60 80 100 120 140 160
0 5 10 15 20 25
Ene
rg
y
co
nt
en
t in bi
og
as
(Wh)
[image:6.595.70.370.86.253.2]Particle size of maize silage (mm)
Fig. 7. Dependence of the biogas energy content on the length of chaff in maize silage (always 3 identical samples for each size of chaff)
0 50 100 150 200 250 300 350 400
0 5,000 10,000 15,000 20,000 25,000 30,000
1 3 5 7 9 11 13 15 17 19 21 23 25 27 29 31 33 35 37 39 41 43
Ene
rg
y
co
nt
en
t in bi
og
as
(Wh)
Bi
og
as p
ro
du
ction (
ml
)
Time of delay in fermentation (days)
Biogas production – silage fermented immediately after extraction Biogas production – silage fermented 7 days after extraction Biogas production – silage fermented 14 days after extraction Energy content – silage fermented immediately after extraction Energy content – silage fermented 7 days after extraction Energy content – silage fermented 14 days after extraction
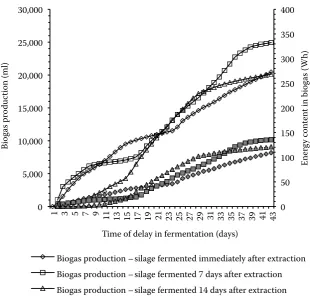
Fig. 8. Cumulative amount of biogas and energy content of biogas at verified duration times of contact of maize silage with air oxygen
[image:6.595.66.377.413.709.2]production of methane by Masahiko and Kengo (2012).
The low value of biogas production and its en-ergy value in samples with an average size of chaff of 5 mm are probably caused by too rapid start of anaerobic fermentation process. It most likely hap-pened that the rapid increase of acidogenous phase of fermentation and over-acidity of the whole pro-cess appeared due to high acpro-cessibility of biomass for anaerobic bacteria. Low pH value subsequently prevented the development of methanogenous bac-teria. This fact appeared due to small content of individual experimental fermenters and also due to correspondingly low buffering capacity of their content. It can be assumed that such case of hypera-cidity could not appear in a normal BP environment which relates to large and well-stirred volumes of biomass. This claim is also supported by the rela-tively low pH values, measured on these samples after the test. We did not find a similar conclusion while studying related literature.
When considering the trend of dependence of the energy content of biogas on the length of chaff of maize silage, the value of the energy content for the chaff of 5 mm size was represented by only one point (square), as represented on Fig. 7. Due to the irrelevant results, it was excluded from further consideration of the trend.
As with grass silage (Fig. 3), linear trend of de-pendence of energy content of biogas on the length of chaff of maize silage may be also assumed, even though we only have 2 points of dependence avail-able. Any polynomial trend should have decreas-ing tendency startdecreas-ing in a certain min. size of the chaff, which contradicts the basic assumption of increasing energy efficiency of biogas production with increasing specific surface of particles in
bio-mass used. Assuming a linear trend, then its ana-lytical equation shows that reduction in the average size of the chaff by every 1 mm means the increase of the total energy yield by about 3%. The above-mentioned consideration shows the fact saying that the lower the average size of the chaff is, the more efficient the production of biogas will be. This state-ment has obviously some limits, such as technical ones (you cannot again and again reduce the size of the chaff to infinity) and economic limits too. Re-ducing the size of chaff is energetically and there-fore also economically very demanding.
The research works (Lammers et al. 1996) show that increasing the size of chaff in self-propelled forage harvesters for maize silage only from 15 to 17 mm means 22% increase in harvesting efficiency, measured in quantity of harvested green matter per unit of fuel consumed by the harvester. It is there-fore apparent that size of the chaff decrease by every 1 mm causes the increase of the total energy yield during anaerobic fermentation by 3%. And at the same time, there is the decrease in the amount of cut green mass of maize per unit of fuel consumed by the harvester by 11%. The rate of harvesting effi-ciency reduction is almost 4 times higher compared to the rate of increase of biogas yield. For this rea-son, there is a given size of the chaff of maize, used for the production of biogas. It is settled to the value of about 15 to 17 mm. To make further disclosure of chaff for anaerobic bacteria, it is more appropriate to use different types of mechanical or pressure ex-truders, or certain types of hydrolysis which further crush and split the material, consequently increas-ing the specific surface value and accessibility for methanogenous bacteria.
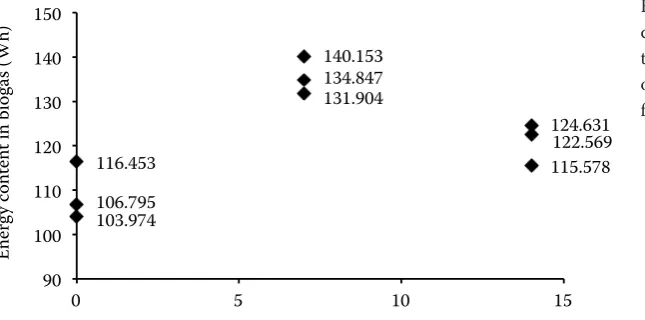
[image:7.595.71.394.86.246.2]The results of monitoring the cumulative biogas production from maize silage and energy content Fig. 9. Dependence of the energy content of biogas on the duration time of maize silage contact with air oxygen (always 3 identical samples for each duration time)
106.795
134.847
124.631 116.453
131.904
115.578
103.974
140.153
122.569
90 100 110 120 130 140 150
0 5 10 15
Ene
rg
y
co
nt
en
t in bi
og
as
(Wh)
of the biogas at verified duration times of contact with air oxygen are shown in Fig. 8
The measurement results show that the cumula-tive biogas production and biogas energy content increased in prolonged contact of silage with air oxygen, compared to expectations. The total en-ergy obtained in the sample with 7-day delay was increased by 23%, compared to the sample without delay. In case of delaying the material by one more week, there was the reduction by 11%, the reduc-tion of the total energy was extracted from the sample. Explanation of this result of verification is similar to grass silage. The effect of contact of the maize silage on production and energy content of the biogas is not as significant as it is in grass silage. Fig. 9 shows that the time of maize silage contact with air oxygen has a significant impact on the en-ergy content of biogas.
CONCLUSION
Results of the verification showed the effect of chaff length in the fermented material on produc-tion and energy content of the biogas at processing grass silage with high content of dry-matter and especially maize silage. There was consistent pro-duction and energy content of biogas at the chaff length of the grass silage of 69 and 112 mm. With longer chaff, the production rate and energy con-tent of biogas went down. When processing maize silage, optimal length of chaff in terms of produc-tion and energy content of the biogas was 13 mm. With longer chaff, the production rate and energy content of biogas went down again. The analysis of research related to the impact of chaff length on fuel consumption of a harvesting machine however shows the recommended length of chaff at the level of 15–17 mm. Further verification and deeper anal-yses would significantly increase the total energetic efficiency of biogas production.
Verification of the influence of time of grass si-lage and maize sisi-lage contact with air oxygen
be-fore dosing into the fermenter did not confirm our hypothesis. It was demonstrated that production and energy content of the biogas increased to-gether with the length of duration time of 7 days compared to fermentation of material after max. 3 h of contact with air oxygen. For grass silage, the increase rate of the total energy obtained was 67 % and the increase rate for maize silage was 23%. This fact was observed despite significant mould occur-rence. Moulds appeared in the material after 7 days when coming into contact. In contact with air oxy-gen lasting 14 days, production and energy content of the biogas decreased down. Further measure-ments would optimize the duration time of differ-ent materials contact with air oxygen before dosing into the fermenter.
References
Herout M., Malaťák J., Kučera L., Dlabaja T., 2011. Biogas composition depending on type of plant biomass used. Research in Agricultural Engineering, 57: 137–143. Herrmann C., Heiermann M., Idler C., Prochnow A.,
2012. Particle size reduction during harvesting of crop feedstock for biogas production I: Effects on ensiling pro-cess and methane yields. BioEnergy Research, 5: 926–936. Lammers B., Buckmaster D., Heinrichs A., 1996. A sim-ple method for the analysis of particle sizes of forage and total mixed rations. Journal of Dairy Science, 79: 922–928. Masahiko M., Kengo S., 2012. Factors influencing the
degradation of garbage in methanogenic bioreactors and impacts on biogas formation. Applied Microbiology and Biotechnology, 97: 575–582.
Miao Z., Shastri Y., Grift T.E., Hansen A.C., Ting K.C., 2012. Lignocellulosic biomass feedstock transportation alternatives, logistics, equipment configurations, and mod-elling. Biofuels, Bioproducts and Biorefining, 6: 351–362. Pastorek Z., Kára J., Jevič P., 2004. Biomasa: Obnovitelný zdroj energie. [Biomass: Renewable Energy Source.] 1st Ed. Prague, FCC Public: 286.
Received for publication September 18, 2012 Accepted after corrections November 11, 2012
Corresponding author:
Ing. David Sochr, Ph.D., Nenačovice 5, 26 601 Beroun, Czech Republic phone: + 420 725 648 004, e-mail: [email protected]