Journal Name
ARTICLE
Received 00th January 20xx, Accepted 00th January 20xx
DOI: 10.1039/x0xx00000x
www.rsc.org/
Amphiphilic block copolymers from a renewable ε-decalactone
monomer: prediction and characterization of micellar core effects
on drug encapsulation and release
Deepak Kakde,a Vincenzo Taresco,a Kuldeep K. Bansal,a E. Peter Magennis,a Steven M. Howdle,c
Giuseppe Mantovani,a Derek J. Irvine*b and Cameron Alexander*a.
Here we describe a methoxy poly(ethyleneglycol)-b-poly(ε-decalactone) (mPEG-b-PεDL) copolymer and investigate the potential of the copolymer as a vehicle for solubilisation and sustained release of indomethacin (IND). The indomethacin loading and release from mPEG-b-PεDL micelles (amorphous cores) was compared against methoxy poly(ethyleneglycol)-b-poly(ε-caprolactone)(mPEG-b-PCL) micelles (semicrystalline cores). The drug-polymer compatibility was determined through a theoretical approach to predict drug incorporation into hydrated micelles. Polymer micelles were prepared by solvent evaporation and characterised for size, morphology, indomethacin loading and release. All the formulations generated spherical micelles but significantly larger mPEG-b-PεDL micelles were observed compared to mPEG-b-PCL micelles. A higher compatibility of the drug was predicted for PCL cores based on Flory-Huggins interaction parameters (χsp)
using the Hansen solubility parameter (HSP) approach, but higher measured drug loadings were found in micelles with PεDL cores compared to PCL cores. This we attribute to the higher amorphous content in the PεDL-rich regions which generated higher micellar core volumes. Drug release studies showed that the semicrystalline PCL core was able to release IND over a longer period (80% drug release in 110 h) compared to PεDL core micelles (80% drug release in 72 h).
Introduction
The poor solubility of active drugs in aqueous environments is one of the major hurdles to the development of improved formulations.1 It has been estimated that around 70% of new therapeutic chemical entities are poorly soluble in aqueous media.2 Consequently, the use of micelles has emerged as one of the major strategies to achieve enhanced solubilisation and controlled release of hydrophobic drugs.3-8 Micelles of interest in drug delivery are nanoscale structures (10-100 nm) obtained by the self-assembly of interfacially active, amphiphilic molecules (an emulsifier) upon their addition to water. The hydrophobic part of the micelle forms the self-assembled core which is surrounded by a hydrophilic outer shell, often referred to as the corona.9 This core-shell structure creates a cargo space for hydrophobic molecules that enables drug transportation.10, 11 Increasingly, polymeric emulsifiers are being used to create micellar drug carriers due to the higher levels of interfacial stability that they exhibit when compared to small molecule interfacial agents. With polymeric emulsifiers, the drug loading that is achieved in such the cargo spaces can be affected by various factors, including the chemical nature of the particular core-forming block, the relative block length, the overall polymer molecular weight, the properties of the drug involved, and the level of drug-polymer compatibility.12 A significant number of studies have shown that drug-polymer compatibility is one of the major factors in determining the level of
loading obtained.13, 14 For example, Yang et al. showed enhanced doxorubicin loading in acid-functionalized polycarbonate block copolymers due to the electrostatic interaction between the amine group of the drug with the acid group of the polymer.15 However, strong interactions such as these can also adversely delay drug release from the core. Therefore, it is just as important that a formulation should be optimised to exhibit desirable release kinetics. To achieve this, several research groups have focused on the use of block copolymers containing specific functional groups for which the interaction with the drug can be manipulated via alteration of the system conditions e.g. temperature, pH and redox.16-20 By adopting this strategy improvements to drug stability, loading and release characteristics have been achieved for amphotericin B,21 cisplatin,22 and doxorubicin.23, 24
One of the key methods used to determine drug-polymer compatibility is via Flory-Huggins interaction parameters,11, 12, 25, 26, 21 where a low value for the parameter (i.e. approaching zero) predicts a strong interaction between drug and polymer. A second important series of factors that have been shown to influence drug-polymer interactions are the physical/material properties of the copolymer amphiphiles. In general, micelles which possess amorphous cores are able to accommodate higher drug loadings. It has been proposed that this is because the drug molecules reside only in the amorphous region of the polymer.12, 27 Accordingly, there is a need for drug delivery polymers which have the appropriate physical properties to prevent core crystallisation. At the same time, there has been an increasing focus on utilising materials which are obtained from natural sources and synthesised using sustainable chemistries.28-33 This study has investigated replacing ε-caprolactone (ε-CL, see Figure 1) with monomers which are not obtained from petrochemical sources, and which may be advantageous as drug delivery materials also because they are not semi-crystalline in nature. Here we show that decalactone (DL, see Figure 1) is a good alternative to
ε-a.School of Pharmacy, University of Nottingham, University Park, Nottingham
NG7 2RD, UK. e-mail: [email protected],
b.School of Chemical and Environmental Engineering, University of Nottingham,
University Park, Nottingham NG7 2RD UK
c. School of Chemistry, University of Nottingham, University Park, Nottingham
NG7 2RD UK
caprolactone as a biomedical monomer because; (a) the (ε-DL) monomer is derived from a sustainable source, i.e. castor oil, (b) it has already been commercially adopted in the flavouring and fragrance industries,34, 35 and (c) the pendent butyl groups are predicted to disrupt the chain packing of PεDL chains, so promoting the desired amorphous character within the poly(ε-decalactone) (PεDL) core structures to enhance drug loading.36 We thus describe the synthesis of novel mPEG-b-PεDL block copolymers and determine the efficiency of drug loading and the release profiles of drugs from mPEG-b-PεDL micelles. These data are compared to the current benchmark methoxy poly(ethyleneglycol)-b-poly(ε-caprolactone) (mPEG-b-PCL) micelles. Additionally, the drug-micelle core compatibilities are assessed and compared to the drug loading
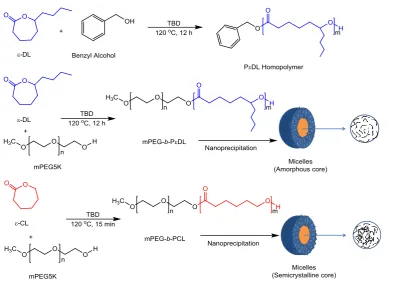
and release pattern experimentally achieved. The synthetic strategy for the copolymers is given in scheme 1.
Figure 1 Structure of decalactone (DL, renewable) and
ε-caprolactone (ε-CL , non-renewable) monomers
Scheme 1 Synthetic route utilised to synthesise the amphiphilic block copolymers which were used to generate micelles with
different core properties.
Experimental Section
Materials
-Decalactone (ε-DL) (≥99%), -caprolactone (-CL), (97%), 1,5,7-Triazabicyclo[4.4.0]dec-5-ene (TBD) (98%), mono methoxy poly(ethylene glycol) (Mn 5000) (mPEG), benzoic acid (≥99.5%), indomethacin (≥99%) (IND), were all purchased from Sigma-Aldrich. All solvents were purchased from Fischer Scientific UK. All chemicals were used as received unless otherwise stated. Azeotropic distillation was used for dehydration of mPEG using anhydrous toluene.
Methods
Synthesis of PεDL homopolymer: The PεDL homopolymer was synthesised via ring opening polymerisation (ROP) of ε-DL utilising benzyl alcohol as the initiator and Triazabicyclo[4.4.0]dec-5-ene (TBD) as the catalyst. In a typical procedure, benzyl alcohol (0.04 g,
0.42 mmol) was transferred into a flask containing ε-DL (5.00 g, 29.37 mmol) monomer and the mixture was stirred for 5-10 minutes at 120 oC to produce a homogeneous mixture. A quantity of TBD (0.12 g, 0.88 mmol) was dissolved in anhydrous acetone (0.5 mL) and then added to the flask under a nitrogen atmosphere and the acetone was evaporated via nitrogen degassing (10 minutes). The reaction was then allowed to proceed at 120 oC for 12 hours with stirring. The reaction was then quenched by the addition of benzoic acid (0.21 g, 1.76 mmol) and cooled. The resulting product was purified by precipitation into cold methanol, and the residual solvent was removed under vacuum. The final product was a colourless, viscous oil obtained in a 74% (3.73 g) yield.
1H NMR (400 MHz, CDCl3) δ (ppm) 7.36 (Benzene protons, m, 5H), 5.12 (CH2-O-CO, s, 2H), 4.87 (CH-O-CO, m, 62H), 2.28 (O-CO-CH2, t, 127H), 1.63-1.54 (CH2-CH2-CH2-CH (OCO)-CH2, m, 386H), 1.30 (CH-CH2-CH2; CH3-CH2-CH2, m, 391H), 0.89 (CH2-CH3, t, 191H).
13C NMR (101 MHz, CDCl3) δ (ppm) 173.25 (O-CO-CH2), 136.06 (C-CH2-O, ring carbon), 128.53 CH-CH-C , ring carbon), 128.16
(CH-ε-Caprolactone (Non-renewable)
[image:2.595.105.504.230.511.2]CH-CH-C , ring carbon), 73.87(CH2-CH-O), 66.10 (CH2-O-CO), 34.48 (CH2-CH- CH2), 33.72 (O-CO-CH2), 27.45 (CH-CH2-CH2), 25.00 (CO-CH2 -CH2), 22.56 (CH-CH2-CH2; CH3-CH2-CH2), 13.98 (CH3-CH2-CH2). FTIR
(cm−1): 2932 (C–H, stretching, aromatic), 2862 (C–H, stretching,
methylene), 1727 (C=O, stretching), 1345 (C–H, bending), 1097 (C–
O, stretching).
Synthesis of mPEG-b-PεDL and mPEG-b-PCL block copolymers: This procedure followed that detailed for the homopolymerisation but mono methoxy poly(ethylene glycol) (mPEG) (Mn 5000) (2.44 g, 0.49 mmol) was used as the initiator. The mPEG was reacted with ε-DL (5.00 g, 29.37 mmol) to generate the mPEG-b-PεDL copolymers and ε-CL (2.78 g, 24.4 mmol) for the mPEG-b-PCL. The resultant polymer was precipitated into cold methanol three times, followed by evaporation of the residual solvent under vacuum. This crude polymer product was dissolved in minimum volume of acetone and re-precipitated into diethyl ether three times. Any solvent residues were removed under vacuum. The product mPEG-b-PεDL copolymer was a waxy colourless solid and was obtained in a 68% (5.02 g) yield.
1H NMR (400 MHz, CDCl3) δ (ppm) 4.87 (CH-O-CO, m, 36H), 4.24 (CH2 -O-CO, t, 2H), 3.66 (O-CH2-CH2-O, s, 487H), 3.40 (O-CH3, s, 3H), 2.29 (O-CO-CH2, t, 75H), 1.61-1.55 (CH2-CH2-CH2-CH (OCO)-CH2, m, 230H), 1.31 (CH-CH2-CH2; CH3-CH2-CH2, m, 234H), 0.90 (CH2-CH3, t, 116H). 13C NMR (101 MHz, CDCl3) δ (ppm) 173.25 (O-CO-CH2), 73.86(CH2 -CH-O), 70.57 (CH2-CH2-O), 34.48 (CH2-CH- CH2), 33.80 (O-CO-CH2), 27.44 (CH-CH2-CH2), 24.99 (CO-CH2-CH2), 22.55 (CH-CH2-CH2; CH3 -CH2-CH2), 13.98 (CH3-CH2-CH2).
FTIR (cm−1): 2880 (C–H, stretching), 1731 (C=O, stretching), 1341
(C–H, bending), 1102 (C–O, stretching).
The mPEG-b-PCL product was solid off-white in colour with 89% (10.54 g) yield.
1H NMR (400 MHz, CDCl3) δ (ppm) 4.24 (CH2-O-CO, t, 2H), 4.08 (CH2 -O-CO, t, 92H), 3.66 (O-CH2-CH2-O, s, 464H), 3.40 (O-CH3, s, 3H), 2.33 (O-CO-CH2, t, 93H), 1.67 (CH2-CH2-CH2, m, 211H), 1.40 (CH2-CH2-CH2, m, 91H).
13C NMR (101 MHz, CDCl3) δ (ppm) 173.50 (O-CO-CH2), 70.58 (CH2 -CH2-O), 64.13 (CH2-O-CO), 34.12 (O-CO-CH2), 28.36 (CH2-CH2-O-CO), 25.53 (CH2-CH2-CH2), 24.58 (CO-CH2-CH2).
FTIR (cm−1): 2886 (C–H, stretching), 1723 (C=O, stretching), 1342
(C–H, bending), 1100 (C–O, stretching)
Polymer Characterisation
Nuclear Magnetic Resonance: A Bruker NMR spectrometer operating at 400 MHz (1H) and 101 MHz (13C) was used to perform nuclear magnetic resonance (NMR) analysis on the purified polymers in deuterated solvents. Chemical shifts were assigned in parts per million (ppm). MestReNova 6.0.2 copyright 2009 (Mestrelab Research S. L.) was used for analysing the spectra.
Determination of Monomer Conversion by 1H NMR: In ε-DL polymerisations the conversion was assessed by comparing the peak area integral of –O–CH(C4H9)– (proton attached to ε-carbon; δ= 4.19 ppm) of ε-DL monomer to the integral of the same peak within the PεDL polymer (PεDL; δ= 4.87 ppm) in the 1H NMR spectrum. Figure S1 shows the spectra before and after conversion of the ε-DL monomer via polymerisation. In ε-CL based reactions the integral intensity of –O–CH2– (δ= 4.14 ppm) for the ε-CL monomer was compared to the intensity of the same peak for PCL polymer (δ= 4.08 ppm) (Figure S2).
Determination of the degree of polymerisation (DP) in the homo- and copolymers by 1H NMR: In the case of ε-DL, the degree of
polymerisation was estimated by comparing the peak area integrals of benzyl protons (C6H5-, δ=7.36 ppm) and methoxy protons (–O–
CH3, δ=3.40 ppm) in the benzyl alcohol and mPEG initiators respectively with that of the –O–CH(C4H9)– (δ=4.87 ppm) proton peak in the PεDL purified polymer (Figure S3, S4).
The calculated molecular weight of mPEG-b-PεDL copolymer by 1H NMR was found to be 11,100 g/mol which was lower than the predicted molecular weight of 15200 g/mol based on the feed ratio of M/I = 60 used during the synthesis (Figure S4).
In the 1H NMR spectrum of mPEG-b-PCL (Figure S5), the degree of polymerisation (DP) was determined for the purified polymer by comparing the integral of mPEG (–O–CH3, δ=3.40 ppm) to that of PCL (–O–CH2–, δ=4.08 ppm). The calculated molecular weight of mPEG-b-PCL copolymer was 10,250 g/molin good agreement with the predicted molecular weight of 10700 g/mol (Figure S5).
Further spectroscopy (13C NMR) was used to determine the purity of the homopolymer and copolymer of ε-DL (Figure S6 and S7) and copolymer of ε-CL (Figure S8).
Gel permeation chromatography (GPC): was used for determination of number-average molecular weight (Mn), weight average molecular weight (Mw), peak molecular weight (Mp) and molecular weight distribution (polydispersity, Ð, Mw/Mn). The analysis was performed on a Polymer Laboratories GPC 50 instrument fitted with a differential refractive index detector. HPLC grade CHCl3 was used as eluent at a flow rate of 1 mL/min. A calibration curve was made using polystyrene standards (Mw range: 443000-132 g/mol) and Polymer Labs Cirrus 3.0 software was used for data analysis. Differential scanning calorimetry (DSC): The thermal properties of the materials were measured using TA-Q2000 DSC (TA Instruments). Samples were subjected to two heating-cooling cycles from -90 to 150 oC at 10 oC/min and the second cycle results were reported. Fourier transform infrared spectroscopy (FTIR): FTIR spectroscopy was performed in the range of 4000-650 cm-1 by placing a small quantity of the sample on a clean ATR crystal in the sample holder of a Cary 630 FTIR spectrophotometer. Spectra were analysed using MicroLab software.
Determination of solubility parameters: The drug–micellar core compatibility was calculated using the Flory-Huggins interaction parameter which is given by:
χsp = (δs-δp)2 Vs/RT (equation 1)
Where χsp = Interaction parameter of solubilizate (drug) and core forming block (polymer hydrophobic block); δs = Solubility parameter of solubilizate; δp = Solubility parameter of the polymer (core block); Vs = Molar volume of solubilizate; R = Gas constant and T temperature in Kelvin. The partial solubility was calculated using the group contribution method (GCM) obtained by the Hoftyzer Van Krevelen method for the estimation of solubility parameter.37 The systematic, stepwise calculations for determining various parameters are given in supporting information Table S1.
HPLC grade water. Zetasizer software version 7.03 was used for data analysis. The morphology of the micelles was investigated by transmission electron microscopy (TEM) using a Tecnai G2 (FEI, Oregon, USA) microscope. A droplet of micelle solution (10 µL) containing 1 mg/mL of the polymer was placed on the copper grid and allowed to dry in air. Samples were then imaged at 100 KV using TIA imaging software, without staining, at a magnification of ×43000. Assessment of drug loading within micelles: The copolymer micelles were formed by a single step nanoprecipitation method and purified as described previously38 but in this case both copolymers (50 mg) and IND (4 mg) were dissolved in the acetone (5 mL) feedstock to be added into HPLC grade water (10 mL). The drug-loaded micelles were then passed through a PD10 desalting column to remove any free drug prior to further characterisation. A portion of the obtained micellar solution was then freeze-dried to estimate the drug content (wt%) and encapsulation efficiency (%EE). The amount of indomethacin loaded in the micelles was determined by dissolving a known amount of micelles (5 mg) in methanol and comparing the data collected by a UV-visible spectrophotometer at λmax = 318 nm to a calibration curve which had been constructed over the quantification range of 5-50 μg/mL (Beckman Coulter DU 800 UV spectrophotometer).39The calculation for the drug content (wt%) and encapsulation efficiency (%EE) was performed as described in the literature by using the formula.40
Drug Content (wt%) = Total amount of drug in the micelles (in mg) X 100 / Total amount of micelles (mg)
% Encapsulation Efficiency (%EE) = Total amount of drug in the micelles (in mg) X 100 / Total amount of drug added (mg)
In-vitro drug release study from the micelles: Analysis of the in-vitro release of IND was performed based upon a reported method39 with the following modifications. An appropriate amount of freeze-dried micelles, with a drug content equivalent to 250 μg of IND was dispersed in HPLC grade water (1 mL). The solution was transferred to dialysis tubing (Slide-A-Lyzer, 3.5 kDa, Thermo Scientific) and dialysed against 5 mL of phosphate buffer solution (PBS, 0.1 M, pH 7.4) at 37 oC. At predetermined time intervals, the whole release media was taken as a sample and replaced with fresh media to maintain sink conditions. The samples were then freeze-dried and dissolved in methanol (1 mL) for quantification by UV-visible spectroscopy. Three control solutions (Control ‘A’, ‘B’ and ‘C’) were also prepared for comparison and analysed by the same method given above. Control solution ‘A’ consisted of 250 μg of IND dissolved in 1 mL of phosphate buffer. Control solution ‘B’ consisted of 250 μg/mL of IND in PBS to which 15 μL of mPEG-b-PεDL copolymer solution in acetone (250 mg/mL of mPEG-b-PεDL) was added. Control solution ‘C’ consisted of 250 μg/mL of IND in PBS to which 18 μL of PCL copolymer solution in acetone (250 mg/mL of mPEG-b-PCL) was added. The acetone in control solutions (Control ‘B’ and ‘C’) was removed by bubbling with nitrogen, and the volume was made up to 1 mL, if required.
Statistical analysis. Data were reported as mean ±standard deviation (SD). Statistical analysis for the significant difference was performed using Student’s unpaired t-test. A significance level was set at P <0.05.
Results
Synthesis and characterization of polymers
The molecular characterisation data for the homopolymer and block copolymers PεDL are shown in Table 1. The optimum concentration of the TBD catalyst was found to be 3 mol% and was used for all the polymerisations. At this concentration >85 % conversion of ε-DL was achieved within 12 h. Figure 2 shows the results of a typical polymerisation kinetics experiment as a plot of both the log of monomer conversion and conversion as a percentage against time. The linear relationship demonstrated in Figure 2 indicates that the reaction followed pseudo-first order kinetics, and the apparent rate constant (kp) of ε-DL polymerisation was determined from this data to be 0.18 h-1. Homopolymer and other impurities in the product (as detected by GPC analysis of the unpurified mPEG-b-PεDL copolymer) were removed by methanol precipitation and diethyl ether re-solvation cycles. The GPC chromatogram of the pure copolymer showed a unimodal size distribution with low polydispersity (Figure S9). GPC-determined molecular weights underestimated the Mn of homopolymer and overestimated the Mn for copolymer when compared to values calculated by 1H NMR (Table 1). These discrepancies were most likely due to the differences in solubility behaviour and solution conformation of the tested polymers compared to the polystyrene standards.
Figure 2 Kinetic analysis of ε-decalactone polymerisation on mPEG5K
[image:4.595.325.558.423.560.2]at 120 oC using TBD as a catalyst (conversion determined by 1H NMR)
Table 1 Molecular characteristics of mPEG5K, PεDL homopolymer and block copolymers determined by 1H NMR and GPC.
Polymera [M]/[I] Ratiob
Predicted Mol. Wt. (g/mol)
Mn by 1H NMR
(g/mol)
GPC (g/mol)
Mn Mw Mp PDI
mPEG5K -- 5000 --- 9400 9700 9400 1.03
PεDL62 70 12000 10700 6100 11300 10100 1.86
mPEG-b-PεDL36 60 15200 11100 15000 16300 15000 1.08
mPEG-b-PCL46 50 10700 10250 17000 25200 17600 1.48
a The number in subscript shows degree of polymerisation of each block; b Monomer/Initiator ratio in feed; Mn: Number average molecular weight, Mw : Weight average molecular weight, Mp: Peak molecular weight (Mp), PDI: Polydispersity index
0 2 4 6 8 1 0 1 2 1 4
0 2 0 4 0 6 0 8 0 1 0 0
0 .0 0 .5 1 .0 1 .5 2 .0 2 .5
T im e ( h )
C
o
n
v
e
r
s
io
n
(
%
)
In
([
M
]
0
/[
M
])
C o n v e r s io n ( % ) ln ( [M ]o /[M ] )
[image:4.595.41.553.636.726.2]Table 2 DSC analysis of homopolymers and copolymers
Polymer Tg (oC) Tm (oC)
Melting Enthalpy
(∆H) J/g
Hydrophobic block
mPEG5K --- 65 201 ---
PCL5K -56 60 96 Semicrystalline
PεDL -53 --- --- Amorphous
mPEG-b-PεDL -52 57 86 Amorphous
mPEG-b-PCL -57 60 114 Semicrystalline
Tg: Glass transition temperature, Tm: Melting Temperature
DSC analysis was conducted on the copolymers, and the data are shown in Table 2. PCL is a semi-crystalline polymer (Tg -60 ⁰C and Tm 59-64 ⁰C), and it has been established that typically the crystallinity of polymers decreases with increasing the molecular weight.41 The reference PCL5K homopolymer displayed both a Tg and Tm in the DSC scan indicating semi-crystalline behaviour. The DSC of the PεDL homopolymer reported only a Tg indicating the amorphous nature of the homopolymer which was consistent with previous reports.27 The block copolymer data showed that the presence of mPEG imparted a level of crystallinity to PεDL copolymers as both Tg and Tm were apparent in DSC scans (Figure S10). As apparent from table 2 it is likely that there was some core crystallinity in the PCL containing block copolymer as both blocks exhibited semi-crystalline behaviour. Ring-opening polymerisation of ε-CL from mPEG resulted in full conversion to polymer within 15 min. The lower reaction time of CL compared to DL was attributed to the higher reactivity of the non-side-chain substituted monomer. The calculated molecular weight of the copolymer was 10250 g/mol compared to the theoretical molecular weight of 10700 g/mol indicative of a controlled polymerisation (Table 1).
Self-assembly of block copolymers and micelles structure.
Both empty and indomethacin (IND)-loaded micelles were prepared by nanoprecipitation. IND was chosen as a model drug for the incorporation studies because controlled release oral formulations for this important hydrophobic non-steroidal anti-inflammatory drug (NSAID) are in widespread clinical use to avoid acute toxicity and because analytical methods for its loading and release have been well-established.42 The percentage recovery of the mPEG-b-PεDL and mPEG-b-PCL copolymers micelles after freeze-drying was found to be 91% and 93% respectively. The self-assembling properties of the copolymers were evaluated via DLS in HPLC grade water. A significant difference was observed between the sizes of the mPEG-b-PCL and
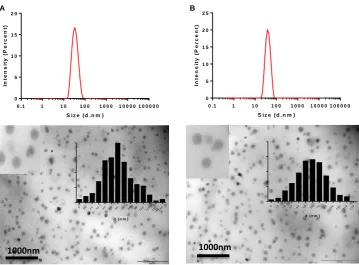
mPEG-b-PεDL micelles. The average diameter (Z-average diameter) of mPEG-b-PεDL micelles was ~38 nm while that of the mPEG-b-PCL micelles was observed to be ~30 nm (Table 3).
These data correlated with previous reports for ε-caprolactone and δ-decalactone based copolymers where micelle sizes in the range of 30-40 nm were found.38 No secondary size distributions were recorded for either of the micellar formulations and the TEM images of the micelles showed uniform spherical micelles with a clear surface boundary. Analysis of TEM images using ImageJ software suggested a larger mean size (i.e. <60 nm) than recorded by DLS for both of the micelles formulations, although there was no sign of aggregation in either case (Figure 3). The difference between the sizes of the micelles as recorded by the different techniques may have been due to the collapse of the spherical micelles into ‘pancake’ structures on dehydration prior to TEM. The data from Table 3 indicate that there were no significant differences between the drug loaded and unloaded micelles of both the PCL and mPEG-b-PεDL copolymers (P > 0.05, unpaired student’s t-test), although there was a significant difference in the average size of the micelles of the different copolymers (P < 0.05, unpaired student’s t-test). In addition, there were still significant differences in the average micellar sizes of the different copolymers after drug loading into the micelles (P < 0.05, unpaired student’s t-test). The optimum drug:polymer ratio for the nanoprecipitation was found to be 4:50 and was used for both formulations. A significant difference in percentage encapsulation was observed between the copolymers. For the mPEG-b-PεDL micelles, 81% of the IND was encapsulated compared to only 66% in the mPEG-b-PCL micelles which translated into a significant difference in drug loading between the two polymers. The mPEG-b-PεDL micelle was able to load around 6.5wt% of IND whereas only 5.4 wt% was loaded by mPEG-b-PCL micelles (P < 0.05, unpaired student’s t-test Table 3).
The percent cumulative release profile of IND against time for different formulations and control systems is shown in Figure 4. Control ‘A’ contained drug dissolved in PBS and showed rapid transit of IND, with more than 90 percent of the free drug able to cross the dialysis membrane within 12 h. In contrast to the rapid release observed in Control ‘A,' when IND was mixed with empty micelles of mPEG-b-PεDL (Control ‘B’) or of PEG-b-PCL (Control ‘C’) in PBS, transit of the drug across the membrane was not complete until after > 24 h. Nevertheless, nearly 90% of the IND was recovered within 24 h from both control ‘B’ and ‘C’. No significant difference was observed between control ‘B’ and control ‘C’ formulations.In contrast, IND encapsulated in the polymer micelles was released at a much lower rate, with a time period of ~ 120 h for 80% IND to cross the dialysis membrane.
Table 3 Characteristics of empty and IND loaded block copolymer micelles
Polymera
Empty micelle
Drug Content (wt%) ± SD
Encapsulation Efficiency (%EE)± SD
IND loaded micelles
Average Size
(nm)b PDIc Average size (nm)b PDIc
[image:5.595.59.540.652.731.2]a The number in subscript shows degree of polymerisation of each block. b Determined from intensity mean by Dynamic Light Scattering (DLS) Technique. C Polydispersity index (PDI) by Dynamic Light Scattering (DLS) Technique. d Significant difference from mPEG-b-PCL46 (P < 0.05, unpaired student’s t-test).
Figure 3 Micelle Size distributions by DLS, TEM Image and size distribution histogram (using Image J software) of empty (A) mPEG-b-PεDL
micelles, (B) mPEG-b-PCL micelles. The images were taken without staining. Scale bar – 1000 nm.
Figure 4 (A) Indomethacin loading (wt% to polymer) in different copolymers. (B) In-vitro IND release (%) from different test formulations
in pH 7.4 PBS buffer solution at 37 oC
Furthermore, whilst the release rate profiles were similar for IND-loaded mPEG-b-PεDL and mPEG-b-PCL micelles, a significant difference was observed in the quantity of IND released with time from the respective co-polymers. Both systems showed an initial rapid release which was followed by a sustained release phase. The mPEG-b-PεDL micelles exhibited an initial burst of 34% IND release in 6 h. This was then followed by a sustained release phase (92% in 120 h) where drug slowly diffused across the dialysis membrane into the release media. The mPEG-b-PCL micelles were able to release the
drug more slowly with 25% of the IND ‘dose’ released in the first 6 h followed by 85% drug release in 120 h.
Determination of solubility parameters and interaction parameters of indomethacin with copolymers
The solubility parameters of IND, the mPEG block and the hydrophobic blocks (PεDL and PCL) were calculated using the Hansen solubility approach (see equation 1 in experimental section). The calculated values are presented in Table 4 and indicate that the Van
1000nm
0 1 0 2 0 3 0 4 0 5 0 6 0 7 0 8 0 9 0 100 1 101 201 30
d ( n m )
1000nm
0 1 0 2 0 3 0 4 0 5 0 6 0 7 0 8 0 9 0 1 001 101 20
d ( n m ) 0 .1 1 1 0 1 0 0 1 0 0 0 1 0 0 0 0 1 0 0 0 0 0
0 5 1 0 1 5 2 0
S i z e ( d .n m )
In
te
n
s
it
y
(
P
e
r
c
e
n
t)
m P E G - b - PD L
A
0 .1 1 1 0 1 0 0 1 0 0 0 1 0 0 0 0 1 0 0 0 0 0 0
5 1 0 1 5 2 0 2 5
S i z e ( d .n m )
In
te
n
s
it
y
(
P
e
r
c
e
n
t)
m P E G - b - P C L
B
m P E G -b-PD L m P E G -b-P C L
3 4 5 6 7 8
D
r
u
g
L
o
a
d
in
g
(
w
t
%
) *
0 2 4 4 8 7 2 9 6 1 2 0 1 4 4 0
2 0 4 0 6 0 8 0 1 0 0
T im e ( h )
C
u
m
u
la
ti
v
e
R
e
le
a
s
e
(
%
)
C o n tr o l A
C o n tr o l B
C o n tr o l C
m P E G -b- PD L M ic e lle s m P E G -b- P C L M ic e lle s
[image:6.595.119.472.435.590.2]der Waals dispersion forces were similar for all the copolymer segments. Meanwhile, the polarity and hydrogen bond formation ability was noted to be higher for the PEG segment. The solubility difference (δs-δp) was calculated using the partial solubility data. The lowest value of this parameter was found for the PCL core (PCL = 4.47) (Table 5). The interaction parameter (χsp) was then determined using the (δs-δp) value from equation 1. The values for the solubility differences and interaction parameters are given in table 5. The interaction parameters were predicted to be in the order of χsp (PεDL)> χsp (mPEG)> χsp (PCL). The lower interaction parameter value for PCL suggested a higher compatibility with this drug. Hence, the PCL block was predicted to encapsulate more IND compared to the other copolymers synthesised for this study.
Table 4 Calculated value of partial solubility and total solubility
parameters of copolymer segments and drug
Polymer segments
and drug
Partial solubility
parameter (MPa1/2) Molar Volume (cm3/mol)
Total Solubility Parameter δT (MPa1/2)
δd δp δh
PεDL 17.05 3.00 6.54 163.20 18.50
PCL 17.66 4.97 8.42 98.50 20.18
PEG 17.17 11.11 9.12 36.00 22.85
Drug (IND) 21.80 6.00 9.40 230.00 24.50 δd dispersion parameter; δp dipolar parameter; δh hydrogen bonding parameter; δT total solubility parameter.
Table 5 Calculated values of solubility difference (δs-δp) and
interaction parameter χsp between drug and polymer segments
Drug
(δs-δp) or ∆ (PEG)a
(δs-δp) or ∆ (PCL)b
(δs-δp) or ∆ (PεDL)c
χsp (PEG)d
χsp (PCL)e
χsp (PεDL)f
IND 6.51 4.47 6.30 3.39 1.85 3.68
Solubility difference between a drug and mPEG; b drug and PCL; c drug and PεDL. Flory-Huggins interaction parameter between d drug and mPEG; e drug and PCL; f drug and PεDL.
Discussion
The commercial availability, renewability and structural similarity with ε-CL (currently regarded as a non-renewable feedstock) makes ε-DL a versatile monomer for polymer synthesis. The TBD catalyst offered a fast reaction under mild conditions, potentially conferring advantages over Sn(Oct)2 which has been extensively used in ROP previously.43-45 The DSC data demonstrated that the alkyl side chains of ε-DL disrupted the packing in the PεDL block compared to PCL blocks, generating mPEG-b-PεDL micelles with amorphous cores. The finding that PεDL homopolymer was amorphous was also supported by previous studies.27, 36
Here we targeted the block copolymer synthesis to produce an overall hydrophilic: hydrophobic ratio of 1:1 in order to control the core properties of the micelles. The initial polymerisations were conducted at low concentrations of TBD (i.e. 1 and 2 mol% TBD compared to monomer), and this resulted in low conversion of ε-DL. However, after [TBD] was increased to 3 mol%, approximately 85% of the ε-DL was converted into PεDL within 12 h. In a comparable polymerisation, the ε-CL monomer was converted to PCL within 15 min (>90% conversion) using 3 mol % TBD. These results were attributed to the presence of the butyl side chain on the ε-DL. The additional steric bulk of this functional group reduced the reactivity
of the secondary alcohol in the ROP process. The lower reactivity of ε-DL has been previously described by Olsen et al.46 Additionally, the initiation efficiency was also observed to be lower for ε-DL polymerisation for the same reason. Thus a higher monomer to initiator ratio of [M]:[I]= 70 and 60 respectively were required for homopolymers and copolymer to achieve the target molecular weights.
The Gel Permeation Chromatography (GPC) data were found to underestimate the Mn of PεDL homopolymer compared to the Mn determined by 1H NMR. This was most likely to have been a result of the less favourable solvation in chloroform of the PεDL polymer compared to the GPC standards, resulting in suppression of hydrodynamic volume of the polymer. The underestimation of Mn in GPC has been reported previously.46 In contrast to the homopolymer, the Mn of the copolymer was overestimated (Table 1), again likely due to differences in solvation with the calibrant polymer and this too was consistent with previous reports.27 The polydispersity index (PDI) determined by GPC provides valuable information regarding the polymer size distributions. Low polydispersities determined by GPC for both of the copolymers suggested some control over the chain lengths of the copolymers. In contrast, higher polydispersities of the homopolymers were observed indicating loss of polymerisation control, most likely due to the presence of nucleophilic or basic impurities such as adventitious water in the reaction. It was found to be difficult to separate benzyl alcohol initiated homopolymers from other homopolymers (initiated by impurity nucleophiles) due to the lack of differences in solubility and molecular weight. However, the desired copolymers were easily separated from homopolymer by precipitation in diethyl ether, in which solvent the homopolymer remained in solution.
[image:7.595.55.294.247.355.2](10 – 200 nm in diameter) and surface-hydrated micelles are less susceptible to uptake by the RES system,47 and thus the obtained polymer micelles might be predicted to have good in vivo stability and thus long circulation time if injected systemically.
In order to predict drug loadings with these co-polymers, investigation of polymer-drug interactions via Flory-Huggins theory was carried out. This parameter has been used in a number of studies for the prediction of drug solubility in polymers.48-51 In one prior investigation,13 the Flory-Huggins interaction parameter (
sp) was calculated between the drug cucurbitacin I with poly(ε-caprolactone) (PCL), poly(-benzylcarboxylate-ε-caprolactone) (PBCL) and poly( -cholesteryl carboxylate-ε-caprolactone) (PChCL) blocks of specific copolymers to determine the compatibility of the drug in the micellar cores. A higher drug-polymer compatibility was predicted for PChCL core micelles, which was also supported by the drug encapsulation study on the mPEG-b-PChCL micelles. The authors suggested that the addition of a cholesteryl moiety to produce PChCL blocks improved the solubilization of the cholesteryl compatible cucurbitacin drug in the mPEG-b-PChCL micelles.13 In another study, the PCL block of an mPEG-b-PCL copolymer was predicted to be more compatible with the poorly water soluble anticancer drug ellipticine, compared to PLA (polylactic acid) block of mPEG-b-PLA copolymer using Flory-Huggins interaction parameter (sp). In this case, the authors reported a higher loading in the more compatible mPEG-b-PCL micelles compared to the less compatible mPEG-b-PLA micelles supported the prediction made by Flory-Huggins interaction parameter (sp).52 Experimentally, a higher loading of IND as a model drug was found with mPEG-b-PεDL copolymer (6.55 wt%) compared to mPEG-b-PCL copolymers (5.39 wt%), which from first principles was not expected. However, whilst the drug-polymer interaction is one of the key parameters affecting the drug loading into the micelle core, it is important to note that neither of the copolymers in our investigation possessed any active functional groups that can interact with the drug to enhance the drug loading. Thus, we suggest that the hydrophobic-hydrophobic interactions between the lipophilic drug and hydrophobic blocks of the copolymers were the predominant factors for drug-polymer interaction with these systems. Therefore, the most probable reason for the increased loading of IND in the PεDL copolymers would be the greater disorder of the PεDL core due to its amorphous nature, which in turn increased the core volumes to provide more space and encapsulate more drug molecules. The calculated volume of the PεDL core micelle was ~1.8 times higher than the PCL core micelles, providing support for this hypothesis. This assertion was reinforced by a recent literature report where the core crystallinity of the PCL block was reduced by the incorporation of medium chain triglyceride (MCT) in the micelle core to enhance the loading of disulfiram (DSF), cabazitaxel (CTX), and TM-2 (a taxane derivative).53
Drug release studies were performed using different controls to compare the release profile with IND loaded micelle formulations. Control ‘A’ showed that IND transport in solution was not affected by the barrier properties of the dialysis membrane. Controls ‘B’ and ‘C’ showed that IND was able to interacting with pre-formed micelles and this interaction slowed the movement of the drug molecules across the dialysis membrane. However, no significant difference was observed between control ‘B’ and control ‘C’ which shows that the IND was interacting in a similar manner with both of the empty micelles. In contrast to the control formulations, the IND loaded micelles were able to reduce the release significantly and gave a sustained release pattern for 120 h. It is likely that the drug inside the micellar cores was present in its protonated form (pKa of
indomethacin carboxylic acid ~ 4.5). However, the carboxyl group of the drug would have been deprotonated after release from the polymer micelles to the bulk medium (PBS, pH 7.4). This would have led to increased solubilization of IND in the release medium. Therefore, the release rate was most dependent on the partition coefficient of the IND between the micelle core and release medium (PBS, pH 7.4).
A significant difference in IND release was observed between PEG-b-PεDL and PEG-b-PCL micelles (P < 0.05, unpaired student’s t-test). The PEG-b-PεDL micelles exhibited burst release (34% in 6 h) followed by a sustained release phase up to 120 h. On the other hand, PEG-b-PCL micelles were able to release the drug over a longer period and also the burst release was reduced (25% in 6 h) significantly. Around 80% of the drug was released in 72 h and 110 h for mPEG-b-PεDL and PEG-b-PCL micelles respectively. This indicates that the amorphous core of the mPEG-b-PεDL micelles was not able to retain the drug compared to the PCL core. This result was again as predicted as the drug molecules can more easily move within the mobile chains of PεDL cores compared to those of the semicrystalline PCL cores.
Drug-polymer compatibility predictions from Flory-Huggins theory indicated low values of the interaction parameter (χsp) of <5 for all the segments of copolymers (mPEG, PεDL and PCL), suggesting that the IND should interact with all of the segments in the polymers. However, as the relative values of dispersion parameters were similar for all the materials in this study [PCL (17.66)>PEG (17.17)> PεDL (17.05)], the strength of drug-copolymer interactions were predicted to be the same across all polymer segments. Solubility differences (∆) showed a lower value for PCL (4.47) compared to PεDL (6.30) indicating the higher compatibility of the IND with the PCL core. These results were also confirmed by determining interaction parameters (χsp). The obtained χsp values implied that more IND should encapsulate within PCL core micelles compared to PεDL core micelles, but the IND loading study revealed an overall higher amount of IND in PεDL core micelles (6.5 wt%) compared to PCL core micelles (5.4 wt%). However, determination of the IND loading per unit volume of the micelles revealed that the PCL core micelle was able to load 1.5 times more drug compared to the PεDL cored micelle, illustrating the higher compatibility of IND with the PCL core in accordance with the solubility parameter calculations. The higher compatibility of the PCL core with IND compared to the PεDL core suggested a slower release of drug from the mPEG-b-PCL micelles, and this was indeed observed in IND release profiles. Also, the slower release can be partly attributed to the semicrystalline core in the PCL micelles hence a lower mobility to allow drug transport compared to the amorphous PεDL cores. The mPEG block, which was a common segment for both of the copolymers, showed a low interaction parameter value mPEG (χsp = 3.39). This also suggested compatibility between IND and mPEG, although in micellar formulations the mPEG block would remain hydrated in the aqueous phase and hence would incur enthalpic penalties for association with IND. Nevertheless, the burst release in the first 6 h from the micelles might have been due to the loose interaction of IND with mPEG at core-corona interface. Thus it might be expected that drug molecules might not only be in the core but also at the core-corona interface, and the association of IND with micelles in the IND transport studies with pre-formed empty micelles gave partial backing for this assertion.
A successful polymerisation of ε-DL (renewable monomer) was described using TBD as an organocatalyst for homopolymer (PεDL) and copolymer (mPEG-b-PεDL) synthesis. The properties of the copolymer were compared with the structurally similar mPEG-b-PCL copolymer. We showed that the copolymers self-assemble in water to give non-aggregated nanosized micelles with amorphous (mPEG-b-PεDL) and semicrystalline cores (mPEG-b-PCL). The amorphous core resulted in increased drug loading due to increased core volume. However, the determination of loading in term of per unit volume of the core illustrated the higher loading in PCL core which was in accordance with the Flory-Huggins interaction parameter. A sustained release pattern was also demonstrated by PεDL core based micelles. The faster release from PεDL core micelles compared to PCL core illustrated the effect of core crystallinity on release properties. The small size of the micelles combined with sustained release characteristics of the mPEG-b-PεDL polymers demonstrate their potential as drug delivery vehicles, but further work is needed to improve overall drug loading and fine control over release.
Acknowledgements
The authors are grateful to the Indian Government for providing financial support to Deepak Kakde. We also thank the Engineering and Physical Sciences Research Council (EPSRC) for financial support (Leadership Fellowship to CA and Grants EP/H005625/1, and EP/J021180/1) and Christy Grainger-Boultby, Tom Booth and Paul Cooling for technical assistance.
Data access statement
All raw data created during this research are openly available from the corresponding author ([email protected]) and at the University of Nottingham Research Data Management Repository (https://rdmc.nottingham.ac.uk/) and all analysed data supporting this study are provided as supplementary information accompanying this paper.
Notes and references
1. C. Rupp, H. Steckel and B. W. Mueller, International Journal of Pharmaceutics, 2010, 395, 272-280.
2. Y. Lu and K. Park, International Journal of Pharmaceutics, 2013, 453, 198-214.
3. J. Zou, Y. Yu, Y. Li, W. Ji, C.-K. Chen, W.-C. Law, P. N. Prasad and C. Cheng, Biomaterials Science, 2015.
4. H. Cabral and K. Kataoka, J Control Release, 2014, 190, 465-476.
5. H.-J. Yoon and W.-D. Jang, J. Mater. Chem., 2010, 20, 211-222.
6. W. Scarano, P. de Souza and M. H. Stenzel, Biomaterials Science, 2015, 3, 163-174.
7. K. Miller, C. Clementi, D. Polyak, A. Eldar-Boock, L. Benayoun, I. Barshack, Y. Shaked, G. Pasut and R. Satchi-Fainaro, Biomaterials, 2013, 34, 3795-3806.
8. S. Cajot, P. Lecomte, C. Jerome and R. Riva, Polym. Chem., 2013, 4, 1025-1037.
9. M. C. Jones and J. C. Leroux, European Journal of Pharmaceutics and Biopharmaceutics, 1999, 48, 101-111. 10. H. Lu, R. H. Utama, U. Kitiyotsawat, K. Babiuch, Y. Jiang and
M. H. Stenzel, Biomaterials Science, 2015.
11. T. C. Lai, H. Cho and G. S. Kwon, Polymer Chemistry, 2014,
5, 1650-1661.
12. C. Allen, D. Maysinger and A. Eisenberg, Colloids and Surfaces B-Biointerfaces, 1999, 16, 3-27.
13. A. Mahmud, S. Patel, O. Molavi, P. Choi, J. Samuel and A. Lavasanifar, Biomacromolecules, 2009, 10, 471-478. 14. J. P. L. Dwan'Isa, L. Rouxhet, V. Preat, M. E. Brewster and
A. Arien, Pharmazie, 2007, 62, 499-504.
15. C. Yang, A. B. E. Attia, J. P. K. Tan, X. Ke, S. Gao, J. L. Hedrick and Y.-Y. Yang, Biomaterials, 2012, 33, 2971-2979. 16. M. Zhang, C.-C. Song, R. Ji, Z.-Y. Qiao, C. Yang, F.-Y. Qiu,
D.-H. Liang, F.-S. Du and Z.-C. Li, Polymer Chemistry, 2016, 7, 1494-1504.
17. T. Thambi, J. H. Park and D. S. Lee, Biomaterials Science, 2016, 4, 55-69.
18. N. Chan, S. Y. An and J. K. Oh, Polymer Chemistry, 2014, 5, 1637-1649.
19. J. Chen, F. Zehtabi, J. Ouyang, J. Kong, W. Zhong and M. M. Q. Xing, J. Mater. Chem., 2012, 22, 7121-7129.
20. L. M. Randolph, M.-P. Chien and N. C. Gianneschi, Chemical Science, 2012, 3, 1363-1380.
21. A. Lavasanifar, J. Samuel, S. Sattari and G. S. Kwon, Pharmaceutical Research, 2002, 19, 418-422.
22. N. Nishiyama, Y. Kato, Y. Sugiyama and K. Kataoka, Pharmaceutical Research, 2001, 18, 1035-1041.
23. M. Yokoyama, S. Fukushima, R. Uehara, K. Okamoto, K. Kataoka, Y. Sakurai and T. Okano, Journal Of Controlled Release, 1998, 50, 79-92.
24. K. Kataoka, T. Matsumoto, M. Yokoyama, T. Okano, Y. Sakurai, S. Fukushima, K. Okamoto and G. S. Kwon, Journal Of Controlled Release, 2000, 64, 143-153.
25. F. Gadelle, W. J. Koros and R. S. Schechter, Macromolecules, 1995, 28, 4883-4892.
26. R. Nagarajan, M. Barry and E. Ruckenstein, Langmuir, 1986,
2, 210-215.
27. L. Glavas, P. Olsen, K. Odelius and A.-C. Albertsson, Biomacromolecules, 2013, 14, 4150-4156.
28. M. Winkler, C. Romain, M. A. R. Meier and C. K. Williams, Green Chemistry, 2015, 17, 300-306.
29. K. Schroder, K. Matyjaszewski, K. J. T. Noonan and R. T. Mathers, Green Chemistry, 2014, 16, 1673-1686.
30. D. K. Schneiderman and M. A. Hillmyer, Macromolecules, 2016, 49, 2419-2428.
31. J. Zhang, T. Li, A. M. Mannion, D. K. Schneiderman, M. A. Hillmyer and F. S. Bates, ACS Macro Lett., 2016, 5, 407-412. 32. D. K. Schneiderman, E. M. Hill, M. T. Martello and M. A.
Hillmyer, Polym. Chem., 2015, 6, 3641-3651.
33. M. A. Hillmyer and W. B. Tolman, Accounts of Chemical Research, 2014, 47, 2390-2396.
34. C. Romero-Guido, I. Belo, T. M. N. Ta, L. Cao-Hoang, M. Alchihab, N. Gomes, P. Thonart, J. A. Teixeira, J. Destain and Y. Wache, Applied Microbiology and Biotechnology, 2011, 89, 535-547.
35. A. Endrizzi, Y. Pagot, A. LeClainche, J. M. Nicaud and J. M. Belin, Critical Reviews in Biotechnology, 1996, 16, 301-329. 36. J.-O. Lin, W. Chen, Z. Shen and J. Ling, Macromolecules,
2013, 46, 7769-7776.
38. K. K. Bansal, D. Kakde, L. Purdie, D. J. Irvine, S. M. Howdle, G. Mantovani and C. Alexander, Polymer Chemistry, 2015,
6, 7196-7210.
39. S. Y. Kim, I. L. G. Shin, Y. M. Lee, C. S. Cho and Y. K. Sung, Journal of Controlled Release, 1998, 51, 13-22.
40. H. M. Aliabadi, S. Elhasi, A. Mahmud, R. Gulamhusein, P. Mahdipoor and A. Lavasanifar, International Journal of Pharmaceutics, 2007, 329, 158-165.
41. M. A. Woodruff and D. W. Hutmacher, Progress in Polymer Science, 2010, 35, 1217-1256.
42. H. Liu, N. Finn and M. Z. Yates, Langmuir, 2005, 21, 379-385.
43. L. Simon and J. M. Goodman, Journal of Organic Chemistry, 2007, 72, 9656-9662.
44. A. Chuma, H. W. Horn, W. C. Swope, R. C. Pratt, L. Zhang, B. G. G. Lohmeijer, C. G. Wade, R. M. Waymouth, J. L. Hedrick and J. E. Rice, Journal of the American Chemical Society, 2008, 130, 6749-6754.
45. R. C. Pratt, B. G. G. Lohmeijer, D. A. Long, R. M. Waymouth and J. L. Hedrick, Journal of the American Chemical Society, 2006, 128, 4556-4557.
46. P. Olsen, T. Borke, K. Odelius and A.-C. Albertsson, Biomacromolecules, 2013, 14, 2883-2890.
47. A. Lavasanifar, J. Samuel and G. S. Kwon, Advanced Drug Delivery Reviews, 2002, 54, 169-190.
48. K. Letchford, R. Liggins and H. Burt, Journal of Pharmaceutical Sciences, 2008, 97, 1179-1190.
49. M. Danquah, T. Fujiwara and R. I. Mahato, Biomaterials, 2010, 31, 2358-2370.
50. L. Huynh, C. Neale, R. Pomes and C. Allen, Nanomedicine-Nanotechnology Biology and Medicine, 2012, 8, 20-36. 51. M. L. Forrest, A. Zhao, C. Y. Won, A. W. Malick and G. S.
Kwon, Journal of Controlled Release, 2006, 116, 139-149. 52. J. B. Liu, Y. H. Xiao and C. Allen, Journal of Pharmaceutical
Sciences, 2004, 93, 132-143.