expression of grasshopper
Oedaleus asiaticus
exposed to
diet stress from plant secondary
compounds
Xunbing Huang
1,2, Jingchuan Ma
1,2, Xinghu Qin
1,2, Xiongbing Tu
1,2, Guangchun Cao
1,2,
Guangjun Wang
1,2, Xiangqun Nong
1,2& Zehua Zhang
1,2We studied the role of plant primary and secondary metabolites in mediating plant-insect interactions by conducting a no-choice single-plant species field experiment to compare the suitability, enzyme activities, and gene expression of Oedaleus asiaticus grasshoppers feeding on four host and non-host plants with different chemical traits. O. asiaticus growth showed a positive relationship to food nutrition content and a negative relationship to secondary compounds content. Grasshopper amylase, chymotrypsin, and lipase activities were positively related to food starch, crude protein, and lipid content, respectively. Activity of cytochrome P450s, glutathione-S-transferase, and carboxylesterase were positively related to levels of secondary plant compounds. Gene expression of UDP-glucuronosyltransferase 2C1, cytochrome P450 6K1 were also positively related to secondary compounds content in the diet. Grasshoppers feeding on Artemisia frigida, a species with low nutrient content and a high level of secondary compounds, had reduced growth and digestive enzyme activity. They also had higher detoxification enzyme activity and gene expression compared to grasshoppers feeding on the grasses Cleistogenes squarrosa, Leymus chinensis, or Stipa krylovii. These results illustrated Oedaleus asiaticus adaptive responses to diet stress resulting from toxic chemicals, and support the hypothesis that nutritious food benefits insect growth, but plant secondary compounds are detrimental for insect growth.
Nearly half of all insect species are herbivores1, 2. Co-adaptations between herbivorous insects and host plants
have been studied in depth. These studies have mainly focused on understanding behavioral, physiological, chemical, genetic, ecological, and evolutionary mechanisms2–6. Herbivorous insects with wide host ranges show
different preferences and adaptation to different host plants7. Some plant species are strongly attractive or are
indispensable to specific herbivorous species, and may contribute to, or even accelerate, population outbreaks8.
For example, Locusta migratoria manilensis (Meyen) population growth is strongly correlated with the grass Phragmites australis (Cav.) Trin., which provides an optimal food source9, 10.
The question of which selective factors have driven the evolution of host adaptability by insect herbivores is of great interest. Ecological factors such as susceptibility to predation and aspects of habitat association are important in selection but plant chemistry is critical and includes nutrition, nutritional barriers, and secondary compounds2, 11, 12. Plant chemistry is an important component of the phenotype that mediates plant-insect
inter-actions. Phenotypic and physiological plasticity of insect individuals, and genetic variability of populations, help herbivorous insects overcome plant defenses and variable diets13. For insect pest species, determining the causal
factors and the insect response to those stresses can be helpful for explaining their population dynamics or spatial distribution, and improving management strategies14, 15.
1State Key Laboratory of Biology of Plant Diseases and Insect Pests, Institute of Plant Protection, Chinese Academy
of Agricultural Sciences, Beijing, 100193, P.R. China. 2Scientific Observation and Experimental Station of Pests in Xilin
Gol Rangeland, Institute of Plant Protection, Chinese Academy of Agricultural Sciences, Xilinhot, 02600, P.R. China. Correspondence and requests for materials should be addressed to Z.Z. (email: lgbcc@263.net)
www.nature.com/scientificreports/
Plants have evolved to resist insect feeding or deter oviposition, while insects have evolved to more effec-tively locate and use suitable host plants for feeding and oviposition. This ongoing evolutionary battle has lasted over 350 million years1, 16. To resist attack by herbivorous insects, many plants have evolved chemical defense
systems, including direct and indirect responses17. For direct responses, plants have created nutritional hurdles,
such as having low available protein or low carbohydrate content. Physical barriers include plant structures such as thorns, trichomes, and cuticles1, 18, 19. Plants also produce secondary metabolites including flavonoids, tannins,
phenols, alkaloids, terpenoids, and glucosinolates, that function as toxins or repellents20, 21. Indirect defenses may
involve volatile organic compounds, induced by insect feeding, and extrafloral nectaries that attract predators and parasitoids of the herbivores2. The “secondary compounds” produced by plants play a dual role in providing an
attraction signal for insects adapted to these plants. Plant adaptations based on these two defense systems have helped plants minimise impacts and survive insect herbivory21, 22.
Conversely, insect herbivores have evolved novel detoxification mechanisms that allow them to consume and develop on toxic plants. This insect feeding continues the selective pressure on plants to develop increased or novel chemical defenses23–27. Insect herbivores have well-defined nutritional requirements for carbohydrates,
lipids, proteins, vitamins, and minerals11, 28, and have adapted to feed on plants with varying nutritional qualities,
and can accurately choose optimal food when given a choice29, 30.
The significant impact of plant nutrition and defensive traits on herbivore performance and population dynamics is well established. The phenotype and population dynamics of insect herbivores depend on the nutri-tive value and defensive traits of their host plants2, 4, 29. Insect survival, fecundity, fitness, and population levels
usually increase when they feed on plants of optimal quality and low toxin concentrations12, 31, 32. The availability
of such plants may increase the probability of pest population outbreaks, whereas reduced access to key nutrients or increased levels of secondary compounds may have the opposite effect14, 28.
Diet stress from plant chemical exposure can also effect herbivore physiology and gene expression. Gene expression and enzyme activity levels in insects can have important roles in nutrient metabolism and detoxifica-tion of secondary plant compounds33–35. For example, diet-dependent metabolic responses of insect herbivores
such as Spodoptera spp., showed that the expression patterns of digestive and detoxifying enzymes, transport-ers, immunity, and peritrophic membrane associated transcript were varied amongst the different Spodoptera strains33. Genetic adaptation has allowed the induction of arrays of broader or more robustly active digestive
and detoxifying enzymes in herbivores36, 37. Furthermore, the evolution of insect diet choices and the enzyme
system is closely related38, and alterations in the expression levels of digestive and detoxifying enzymes are used
by insects to optimize nutrient utilization inside the gut39. The expression of mannosidases, glucosidases, and
alpha amylases, enzymes used to metabolize carbohydrates such as starches, are differentially induced in insect midguts by different food plants33, 39. Rapid synthesis of mixed-function oxidases and detoxifying enzymes occur
after the consumption of toxic plants and lipid-synthesizing enzymes are generated in response to lipid-deficient diets21, 34, 35. These rapid biochemical and gene expression responses to changing plant chemical traits are vitally
important for herbivores.
Phenotypic plasticity, physiological plasticity, and gene expression in response to diet stress are well-documented, but their specific and quantitative relations to plant chemical traits of nutrition and secondary compounds are unclear. We used Oedaleus asiaticus B. Bienko, a common locust of north Asian grasslands14, as
a model species to conduct a field cage trial and study enzyme activity and gene expression. We wanted to deter-mine how diet stress, produced by secondary plant chemicals, influences the gene expression, physiology, and phenotype of O. asiaticus.
Results
Host plant biochemical traits.
The main chemical traits of three nutritive components and five secondary compounds for four food plants were measured by HPLC. The main nutrition and secondary compounds were different in the four plant species (Fig. 1). S. krylovii had the highest starch, and L. chinensis had the highest crude protein and lipid content (Fig. 1A). The lowest values of the three nutritive substances occurred in A. frigida.Figure 1. (A) Percentage nutrition components (crude protein, lipid, starch) and (B) secondary compounds
[image:2.595.159.549.48.188.2]The sum of the three nutritive substances content was, in decreasing order, L. chinensis>S. krylovii>C. squar-rosa>A. frigida (Fig. 1A).
For the five secondary compounds, the total amount of all compounds was, in decreasing order, A. frigida>L. chinensis>C. squarrosa>S. krylovii (Fig. 1B). Additionally, A. frigida had high levels of flavonoids, phenols, alka-loids, and terpenoids, while L. chinensis had the highest level of tannins compared to the other plants.
Grasshoppers growth performance.
The mean survival rate (Fig. 2A), developmental time (Fig. 2B), adult dry mass (Fig. 2C), growth rate (Fig. 2D), and overall performance (Fig. 2E) of O. asiaticus were significantly poorer for insects feeding on A. frigida, compared to L. chinensis, S. krylovi, or C. squarrosa. Feeding on A. frigida provided less benefit for O. asiaticus growth and development, presumably because of poor adaptation to this plant compared to the three grasses. Among the grasses, growth rate and overall performance were significantly higher for O. asiaticus feeding on S. krylovi (Fig. 2A–E).Linear regression analysis (Fig. 3) showed that O. asiaticus mean overall performance had a significant pos-itive relationship to the sum of the three measured nutrpos-itive components of starch, crude protein and lipids (y = 1.0744x + 13.047, R² = 0.86, P< 0.05). In contrast, O. asiaticus overall performance had a significant negative relationship to the sum of five secondary compounds of flavanoids, tannins, phenols, alkaloids and terpenoids (y =−0.046x + 0.7849, R² = 0.87, P< 0.05).
Figure 2. (A) O. asiaticus mean % survival rate from fourth instar to adult ± SD, (B) mean dry mass (mg ± SD) of adults, (C) mean developmental time (days ± SD) from fourth instar to adult, (D) growth rate (mg/day ± SD) and (E) overall performance (±SD) when fed on either L. chinensis, S. krylovii, C. squarrosa, or A. frigida, respectively. Bars marked by different lowercase letters are significantly different based on Turkey’s HSD analysis at P< 0.05.
[image:3.595.98.553.47.264.2] [image:3.595.157.359.351.495.2]www.nature.com/scientificreports/
Grasshopper enzyme activity.
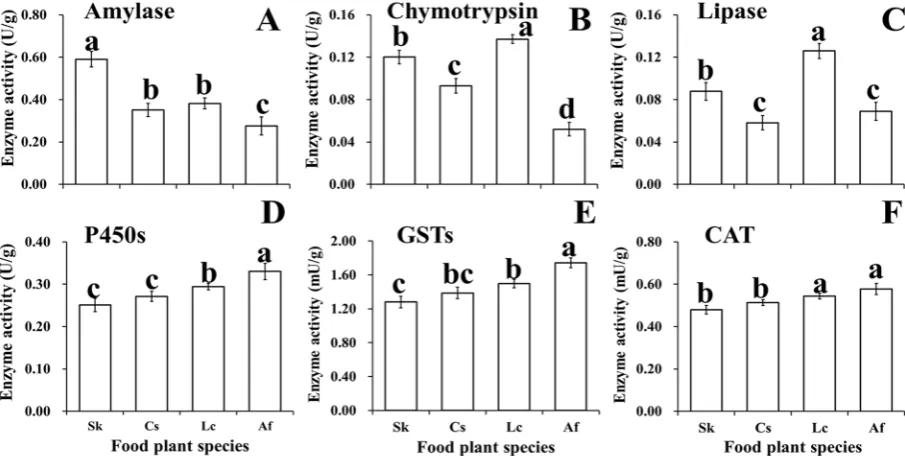
O. asiaticus fed on S. krylovii had the highest amylase activity (Fig. 4A), while O. asiaticus fed on L. chinensis resulted in the highest chymotrypsin (Fig. 4B) and lipase activity (Fig. 4C). Individuals fed A. frigida had the lowest activities of these three digestive enzymes (Fig. 4A–C). The detoxifica-tion activities of P450s, CAT, and GSTs were highest in O. asiaticus fed on A. frigida (Fig. 4D–F), followed by O. asiaticus fed L. chinensis with significant differences observed in P450s and GSTs enzymes. The lowest values were for S. krylovii (Fig. 4D–F).Linear regression analysis (Fig. 5) showed that the activities of amylase (AMY), chymotrypsin (CTP) and lipase had a significant positive relationship to starch (y = 0.0049x − 0.0972, R² = 0.99), crude protein (y = 0.0688x − 0.3755, R² = 0.97), and lipids (y = 0.0255x + 0.0295, R² = 0.93), respectively (P< 0.05) (Fig. 5A). In contrast, the activities of P450s (y = 0.1899x + 0.1796, R² = 0.92), GSTs (y = 1.0711x + 0.8731, R² = 0.87), and CAT (y = 0.2396x + 0.3932, R² = 0.97) were all significantly positively related to the sum of the five secondary compounds (P< 0.05) (Fig. 5B).
Grasshopper gene expression.
RT-qPCR to determine the relative expression of six genes indicated that the genes for cuticle protein 6 (gLCP), TPA_exp: chymotrypsin 2 (gCHY), and alpha-glucosidase (gALP) were most highly expressed in O. asiaticus fed on S. krylovii (Fig. 6A–C). The lowest expression levels for these proteinsFigure 4. The activity (±SD) of the main digestive (amylase, chymotrypsin, lipase) and detoxification (P450s: cytochrome P450s, GSTs: glutathione-S-transferase, CAT: carboxylesterase) enzymes for O. asiaticus when fed on L. chinensis (Lc), S. krylovii (Sk), C. squarrosa (Cs), and A. frigida (Af). Bars marked by different lowercase letters are significantly different based on Turkey’s HSD analysis at P< 0.05.
[image:4.595.100.553.47.275.2] [image:4.595.161.550.354.489.2]were for O. asiaticus fed on A. frigida. In contrast, the genes of UDP-glucuronosyltransferase 2C1(gUDP), cytochrome P450 6K1 (gP450), and CAT (gCAT) were highest in O. asiaticus fed A. frigida, with the lowest expression in O. asiaticus fed S. krylovii (Fig. 6D–F).
Linear regression analysis showed that the mean relative gene expression of gp450 (y = 2.0309x + 0.2062, R² = 0.81) and gUDP (y = 9.8045x − 2.932, R² = 0.82) exhibited a significant positive relationship to the content sum of secondary compounds in the food plant (P< 0.05). Conversely, the relationship between carboxylesterase (gCAT) and the % sum of secondary compounds was not significant.
Discussion
We used single-plant no-choice field cage trials to compare the suitability of four plant species with different chemistry to O. asiaticus. The results demonstrate that A. frigida, with low nutritive value and a high level of secondary compounds, was unsuitable for O. asiaticus compared to the grasses (L. chinensis, S. karylovii, and C. squarrosa). Grasshoppers that fed only on A. frigida had reduced size, growth, development, and survival com-pared to those fed on any of the grass species. Among the grasses, grasshoppers fed on S. karylovii had increased growth and development compared to the other two grass species. From the viewpoint of grasshopper biology, S. karylovii was the most favorable host plant of all plants tested. These results were consistent with previous studies40, 41. S. krylovii is an iconic grass species found in the Eurasian steppe grassland, with a wide geographic
distribution that includes northern China, Kazakhstan, Mongolia, and Siberia42, 43. Due to the close relationship
between S. krylovii and O. asiaticus, we inferred that S. krylovii was a strong driver for the distribution of O. asi-aticus. Those areas of Stipa-dominated grasslands, represent regions for potential expansion of O. asiaticus range, particularly in the context of climate change, which may promote outbreak populations44. Thus, O. asiaticus
mon-itoring and population management should be increased in these regions.
O. asiaticus growth performance was positively related to total nutrition of the food plant, and negatively related to the total amount of secondary compounds. These results follow a tenet of herbivore-plant coevolution in that better nutritional status benefits insect growth whereas a higher level of secondary compounds is generally detrimental11, 21, 22. In addition, the individuals of grass- and A. frigida-fed grasshoppers have significantly
differ-ent phenotypes, could be viewed in the context of insect phenotypic plasticity. Phenotypic plasticity refers to the capacity of a single genotype to change their phenotypes (ie. biochemistry, metabolism, physiology, morphology, development, behavior, or life-history) in response to harmful environmental stresses or conditions, which would be highly beneficial for insects13, 45. It has the great advantage of allowing continuous, on-going adaptation of
individuals in real-time. Indeed, some phenotypic plasticity is instantaneous, and many types are reversible13.
However, we do not know if phenotypic changes observed in this study become fixed in the next generation, or disappear when O. asiaticus is transfered to suitable host grasses.
There was a significant positive relationship between the digestive enzyme (chymotrypsin, amylase, and lipase) activity and food plant nutrition components (crude protein, starch and lipids). In contrast, O. asiaticus detoxification enzyme (CAT, GSTs, and P450s) activity showed a significant positive relationship to total second-ary compounds content. This indicated that the low nutrition and high secondsecond-ary compound levels associated
[image:5.595.103.554.46.277.2]www.nature.com/scientificreports/
with A. frigida resulted in low activity of nutrition digestive enzymes and high activity in detoxification enzymes. In contrast, the high nutrition and low secondary compounds content of S. krylovii resulted in high nutrition digestive enzymes activity and low detoxification enzymes activity. These results support the general view-point that the evolution of food adaptability is tightly correlated with nutrition metabolism and detoxification related enzymes33, 34, 36, 38. For example, enhanced survival and fecundity of Hyposidra infixaria (Lepidoptera:
Geometridae), when larvae were reared on an artificial diet compared to tea leaves, was linked to higher activity of enzymes related to nutrition metabolism46. In addition, the expression of cytochrome P450, GST and CAT are
differentially induced by feeding on the different host plants of herbivorous insects21. When feeding on plants
having low suitability, the expression of detoxification-related enzymes, such as cytochrome P450, and GSTs, may be activated in response to the presence of toxic substances.
Altered gene expression offers additional insights into the biological performance of O. asiaticus. As previ-ously mentioned, insects often up-regulate detoxifying enzymes, such as cytochrome P450, in response to toxin exposure. UDP-glucuronosyltransferase (UDP) is known to be highly inducible and it functions to ameliorate stress21. Up-regulation of both of these genes is clearly beneficial for the grasshoppers, and probably represents
adaptive phenotypic plasticity. The relative gene expression of UDP-glucuronosyltransferase 2C1 (gUDP) and cytochrome P450 6K1 (gP450) exhibited a significant positive relationship to secondary compounds in the host plant. Feeding on A. frigida significantly up-regulated stress-resistance genes regulating UDP, P450s, and CAT. Up-regulating these genes as a result of feeding on A. frigida is unsurprising, given that this plant is not a pre-ferred host40, 41.
O. asiaticus feeding on A. frigida significantly down-regulated the gene expression of cuticle protein 6 (gLCP), TPA_exp: chymotrypsin 2 (gCHY), and alpha-glucosidase (gALP).Those partly represented the decreasing of structural constituent of cuticle pathway, protein digestion and the absorption pathway, and starch and sucrose metabolism pathway, can explain the poorer performance. But, we do not know if the down-regulation of gLCP, gCHY, and gALP is beneficial, detrimental, adaptive, or simply an incidental by-product of diet stress, but may be related to variation in plant nutrition or secondary compounds. However, even seemingly harmful consequences that result from altered genes, may be beneficial. An example is a gene change that delays growth, development, or reproduction. This response may at first appear to be detrimental to the organism, but it may be beneficial if it allows the individual to survive during a period of stress, such as during poisoning or poor nutrition. Conversely, it may make the insect more susceptible to predation, parasitism or unable to complete life history before the onset of unfavourable environmental conditions47.
We offer several conclusions based on this study. First, different food plants can elicit biochemical responses consistent with phenotype plasticity and confirms previous studies linking a changed phenotype to changed envi-ronment33. Second, feeding on suboptimal plant species and the associated diet stress substantially altered gene
expression (i.e. grasshoppers fed A. frigida compared with grass-fed insects), which aligns with conclusions of previous studies showing gene expression changes with increased diet stress48. Third, the quality of nutrition
and levels of toxin in host plants can significantly affect insect growth, physiological enzyme activity, and gene expression. The roles of plant primary and secondary metabolites in mediating plant-insect interactions hence have both ecological and evolutionary consequences42. To decipher the mechanisms of herbivorous insect food
adaptability at the cellular level, we must determine exactly how the terpenoids, flavonoids, and alkaloids present in A. frigida influence physiology and biology as well as regulate insect gene expression in O. asiaticus.
Materials and Methods
Ethics statement.
Oedaleus asiaticus were collected at the Xilin Gol grassland in 2016. Species of the super-family Acridoidea are common agricultural pests and are not on the “List of Protected Animals in China”. No permits were required for the described field studies.Study sites.
The research site (43.968°N, 115.821°E) was located in the Xilin Gol League, Inner Mongolia, northeast China. This region is representative of the Eurasian steppe grassland14. The mean annual temperature inthe study area is 0.3 °C with mean monthly temperatures ranging from −21.6 °C in January to 19.0 °C in July. The mean annual precipitation is 346 mm, more than 80% of that which occurs during the May to September growing season15. Vegetation at the study site is mainly comprised of three grass species Cleistogenes squarrosa (Trin.)
Keng, Leymus chinensis (Trin.) Tzvel, and Stipa krylovii Roshev (all Poaceae), as well as Artemisia frigida Willd (Compositae). The three common grasshoppers species are O. asiaticus, Calliptamus abbreviatus Ikonn., and Dasyhippus barbipes (Fischer-Waldheim). All three species overwinter as eggs with egg hatch occuring between late-May and late-June, with third instars leading to adults appearing in July49. As a major grasshopper pest, O.
asiaticus populations have sometimes reached outbreak densities, producing devastating impacts on grassland ecosystems14, 15.
Field cage study of
O. asiaticus
growth performance in grassland.
During late June, 2016, we stud-ied O. asiaticus growth when nymphs were reared on different host plant species. A field cage study was car-ried out on S. krylovii, A. frigida, C. squarrosa, and L. chinensis grasslands. In each of those four grasslands, we removed all other plants to assure that only one host plant remained. Near the end of June, a total of 20 screen cages (1 m × 1 m × 1 m) were constructed using iron rod frames covered with 1 mm2 cloth mesh. Five cages were used per plant species. We removed all visible spiders and other natural enemies from the field cages before add-ing female fourth instar O. asiaticus. The mesh covering the cages reduced both wind flow and sunlight intensity across all cages equally. Therefore, impacts of these factors on plant growth among the cages and treatments were considered minimal, as was found in previous studies14.dry mass (mg). The body mass increase (mg) was calculated by subtracting the fourth instar body dry mass from the adult body dry mass. Survival rate (%) from fourth instar to adult was calculated by the number of individuals surviving through to adulthood / number of initial fourth instar individuals (n = 16). Development time (days) was calculated by the following formula50:
= ∑= ⁎
DT i N
N ,
i n
i t
1
where i is the number of days from fourth instar to adult; Ni is the number of individuals with the development time corresponding to that value of “i”; and Nt is the number of all grasshoppers surviving to adulthood. Growth rate (mg/day) was calculated by body mass increase/development time, and overall performance calculated from growth rate × survival rate14.
Host plant biochemical traits.
For each treatment, the nymphs were able to feed ad libitum on the plant biomass of the grassland, with the vegetation in the cages providing sufficient vegetation to allow development through to adults. Once the adults were removed, the remaining plants from each cage were cut at ground level, and each species placed in a separate plastic container and returned to the laboratory for chemical analysis. Starch, nitrogen, and lipid content of each plant sample were measured using the Iodine-starch colorimetric method, Kjeldahl method, and Soxhlet extraction method51, 52, respectively. Crude protein content were thencalculated as nitrogen content × 6.2553. Secondary compounds specifically the flavonoids, tannins, phenols,
alka-loids, and terpenoids of each sample were measured by high performance liquid chromatography (HPLC), using the techniques of Ossipov et al.54–58.
Grasshopper enzyme activity.
We analyzed the main digestive enzyme activity of amylase, chymotrypsin, and lipase, and the main detoxifying enzyme activity of cytochrome P450s (P450s), glutathione-S-transferase (GSTs), and carboxylesterase (CAT). One adult was randomly collected from each of the five replicates of the four treatments (20 samples). Each sample was homogenized separately in fresh 0.1 M sodium phosphate buffer, then centrifuged at 10,000 g for 15 min at 4 °C. The supernatant was stored at −20 °C for future use. Protein present in the enzyme suspension was measured using the method by Lowry et al.59. Amylase, chymotrypsin, and lipaseactivity was assayed using methods described by Prasad et al.46, and calculated as units of U/g.
GSTs activity was measured using a modification of the method described by Oppenoorth and Welling60.
After pipetting 100 μL of 1-chloro-2,4-dinitrobenzene (CDNB) (20 mM) or 3,4-dichloronitrobenzene (DCNB) (40 mM), and 100 μL of GSH (40 mM) into microplate wells, we added 50 μL of enzyme solution (for DCNB) or 10 μL of enzyme solution and 90 μL of PBS (for CDNB). The OD values at 340 nm were recorded at 25 s inter-vals for 10 min. The P450s and CAT activities were determined using commercial assay kits (Nanjing Jiancheng, Nanjing, China) according to manufacturer instructions. The P450, GST, and CAT enzyme activities were calcu-lated in units of U/g, mU/g, and mU/g, respectively.
Gene expression study.
We investigated six genes of O. asiaticus to compare their relative expressions when exposed to diet stress from different chemical traits, including the cuticle protein 6 (gLCP) that is a structural constituent of cuticle pathway, TPA_exp: chymotrypsin 2 (gCHY) involved in protein digestion and the absorp-tion pathway, alpha-glucosidase (gALP) involved in the starch and sucrose metabolism pathway, and the UDP- glucuronosyltransferase 2C1 (gUDP), cytochrome P450 6K1 (gP450), and carboxylesterase (gCAT) involved in the xenobiotics metabolism pathway. Their unigene sequences were acquired from our previous transcriptome profiles (RSA accession number SRP072969) and chosen to design gene-specific primers (Table S1).www.nature.com/scientificreports/
annealing temperature), and extension at 72 °C for 40 s. At the end of each reaction, the melting curve was ana-lyzed to confirm the specificity of the primers. Relative gene expressions were normalized by the internal standard of actin, and analyzed using the 2−ΔΔCT Method. Expression values were adjusted by setting the expression of O. asiaticus feeding on S. krylovii to be 1 for each gene. All RT-qPCRs for each gene of 20 samples (five biological replicates for each treatment) used 3 technical replicates per experiment.
Data analysis.
We used one-way analysis of variance (ANOVA) and Turkey’s HSD to compare grasshopper growth variables (body size, survival rate, development time, growth rate, and overall performance), enzyme activity, and relative gene expression when O. asiaticus was confronted with diet stress of different chemicals. Correlation analyses of grasshopper overall performance, enzyme activity, and relative gene expression with food plant nutrition or secondary compounds were also conducted. We used SAS version 8.0 for all analyses.References
1. Gatehouse, J. A. Plant resistance towards insect herbivores: a dynamic interaction. New Phytol. 156, 145–169 (2002). 2. Wu, J. Q. & Baldwin, I. T. New insights into plant responses to the attack from insect herbivores. Annu. Rev. Genet. 44, 1 (2010). 3. Giri, A. P. et al. Molecular interactions between the specialist herbivore Manduca sexta (Lepidoptera, Sphingidae) and its natural
host Nicotiana attenuata. VII. Changes in the plant’s proteome. Plant Physiol. 142, 1621–1641 (2007).
4. Dicke, M. & Baldwin, I. T. The evolutionary context for herbivore-induced plant volatiles: beyond the ‘cry for help’. Trends Plant Sci.
15, 167–175 (2010).
5. Raubenheimer, D. & Simpson, S. J. Nutrient balancing in grasshoppers: behavioural and physiological correlates of dietary breadth. J. Exp. Biol. 206, 1669–1681 (2004).
6. Ibanez, S. et al. Plant functional traits reveal the relative contribution of habitat and food preferences to the diet of grasshoppers. Oecologia 173, 1459–1470 (2013).
7. Scriber, J. M. Evolution of insect-plant relationships: chemical constraints, coadaptation, and concordance of insect/plant traits. Entomol. Exp. Appl. 104, 217–235 (2002).
8. Schutz, S., Weißbecker, B., Klein, A. & Hummel, H. E. Host plant selection of the Colorado potato beetle as influenced by damage induced volatiles of the potato plant. Naturwissenschaften 84, 212–217 (1997).
9. Zhu, E. L. The occurrence and management of Locusta migratoria manilensis in Chinese. (China Agricultural Press, (2004). 10. Ji, R., Xie, B. Y., Li, D. M., Yuan, H. & Yang, H. S. Effects of reed population pattern on spatial distribution of Locusta migratoria
manilensis in Nandagang wetland. Chinese Bulletin of Entomology 46, 830–833 (2007). 11. Behmer, S. T. Insect herbivore nutrient regulation. Annu. Rev. Entomol. 54, 165–187 (2009).
12. Pérez, H. et al. Leaf traits and herbivore selection in the field and in cafeteria experiments. Aust. Ecol. 28, 642–65 (2003).
13. Whitman D. W. & Ananthrakrishnan T. N. Phenotypic Plasticity of insects: Mechanisms and Consequences (Science Publishers, (2009).
14. Cease, A. J. et al. Heavy livestock grazing promotes locust outbreaks by lowering plant nitrogen content. Science 335, 467–469 (2012).
15. Huang, X., McNeill, M. & Zhang, Z. Quantitative analysis of plant consumption and preference by Oedaleus asiaticus (Acrididae: Oedipodinae) in changed plant communities consisting of three grass species. Environ. Entomol. 45, 163–170 (2016).
16. Kessler, A. & Baldwin, I. T. Plant responses to insect herbivory: the emerging molecular analysis. Annu. Rev. Plant Biol. 53, 299–328 (2002).
17. Howe, G. A. & Jander, G. Plant immunity to insect herbivores. Annu. Rev. Plant Biol. 59, 41 (2008).
18. Baldwin, I. T. Jasmonate-induced responses are costly but benefit plants under attack in native populations. Proc. Natl. Acad. Sci. USA. 95, 8113–8118 (1998).
19. Zavala, J. A., Patankar, A. G., Gase, K. & Baldwin, I. T. Constitutive and inducible trypsin proteinase inhibitor production incurs large fitness costs in Nicotiana attenuata. Proc. Natl. Acad. Sci. USA 101, 1607–1612 (2004).
20. Mendelsohn, R. & Balick, M. J. The value of undiscovered pharmaceuticals in tropical forests. Econ. Bot. 49, 223–228 (1995). 21. Després, L., David, J. P. & Gallet, C. The evolutionary ecology of insect resistance to plant chemicals. Trends Ecol. Evol. 22, 298–307
(2007).
22. Wetzel, W. C., Kharouba, H. M., Robinson, M., Holyoak, M. & Karban, R. Variability in plant nutrients reduces insect herbivore performance. Nature 539, 425 (2016).
23. Despland, E. & Simpson, S. J. Food choices of solitarious and gregarious locusts reflect cryptic and aposematic antipredator strategies. Anim. Behav. 69, 471–479 (2005).
24. Helmus, M. R. & Dussourd, D. E. Glues or poisons: which triggers vein cutting by monarch caterpillars? Chemoecology 15, 45–49 (2005).
25. Becerra, J. X. Synchronous coadaptation in an ancient case of herbivory. Proc. Natl. Acad. Sci. USA 100, 12804–12807 (2003). 26. Dussourd, D. E. Chemical stimulants of leaf-trenching by cabbage loopers: Natural products, neurotransmitters, insecticides, and
drugs. J. Chem. Ecol. 29, 2023–2047 (2003).
27. Musser, R. O. et al. Herbivory: Caterpillar saliva beats plant defences-a new weapon emerges in the evolutionary arms race between plants and herbivores. Nature 416, 599–600 (2002).
28. Simpson, S. J., Sibly, R. M., Lee, K. P., Behmer, S. T. & Raubenheimer, D. Optimal foraging when regulating intake of multiple nutrients. Anim. Behav. 68, 1299–1311 (2004).
29. Bernays, E. A., Bright, K. L., Gonzalez, N. & Angel, J. Dietary mixing in a generalist herbivore: tests of two hypotheses. Ecology 75, 1997–2006 (1994).
30. Powell, G., Tosh, C. R. & Hardie, J. Host plant selection by aphids: behavioral, evolutionary, and applied perspectives. Ann. Rev. Entomol. 51, 309–330 (2006).
31. Bernays, E. A. & Chapman, R. F. Host plant selection by phytophagous insects. Contemporary Topics in Entomology 2, 1754–1756 (1994).
32. Unsicker, S. B., Oswald, A., Kohler, G. & Weisser, W. W. Complementarity effects through dietary mixing enhance the performance of a generalist insect herbivore. Oecologia 156, 313–324 (2008).
33. Roy, A. et al. Diet dependent metabolic responses in three generalist insect herbivores Spodoptera spp. Insect Biochem. Molec. 71, 91 (2016).
34. Bishop, N. A. & Guarente, L. Genetic links between diet and lifespan: shared mechanisms from yeast to humans. Nat. Rev. Genrt. 8, 835–844 (2007).
35. Taguchi, A. & White, M. F. Insulin-like signaling, nutrient homeostasis, and life span. Annu. Rev. Physiol. 70, 191–212 (2008). 36. Janz, N. & Nylin, S. The oscillation hypothesis of host-plant range and speciation in Specialization, speciation, and radiation: the
evolutionary biology of herbivorous insects (Ed Tilmon, K. J.) 203–215 (University of California Press, (2008).
47. Poreddy, S. et al. Detoxification of hostplant’s chemical defence rather than its anti-predator co-option drives β -glucosidase-mediated lepidopteran counteradaptation. Nat. Commun. 6, 8525 (2015).
48. Enders, L. S. et al. Abiotic and biotic stressors causing equivalent mortality induce highly variable transcriptional responses in the soybean aphid. G3-Genes Genom Genet. 5, 261–270 (2015).
49. Guo, Z. W., Li, H. C. & Gan, Y. L. Grasshopper (Orthoptera: Acrididae) biodiversity and grassland ecosystems. Insect Sci. 13, 221–227 (2006).
50. Li, H. C., Wang, Z. & Chen, Y. L. Food consumption and utilization by three species of Acridoids in typical steppe. Acta Ecologica Sinica 7, 331–338 (1987).
51. Kjeldahl, J. New method for the determination of nitrogen in organic substances. Anal. Bioanal. Chem. 22, 366–382 (1883). 52. Harwood, L. M., & Moody, C. J. Experimental organic chemistry: Principles and Practice 122–125 (Blackwell Scientific Publications,
(1989).
53. Bawa, S. F. & Yadav, S. P. Protein and mineral contents of green leafy vegetables consumed by Sokoto population. Journal of the Science of Food & Agriculture 37, 504–506 (1986).
54. Ossipov, V. et al. Hplc isolation and identification of flavonoids from white birch betula pubescens, leaves. Biochemical Systematics & Ecology 23, 213–222 (1995).
55. Guo, J. L. Determination of tannic acid in Phyllanthus emblica l. by high performance liquid chromatography. Chinese. Journal of Spectroscopy Laboratory 24, 911–913 (2007).
56. Naczk, M. Extraction and analysis of phenolics in food. J. Chromatogr. A. 1054, 95–111 (2004).
57. Friedman, M., Levin, C. E., Choi, S. H., Kozukue, E. & Kozukue, N. Hplc analysis of catechins, theaflavins, and alkaloids in commercial teas and green tea dietary supplements: comparison of water and 80% ethanol/water extracts. J. Food Sci. 71, 328–337 (2006).
58. Griffin, S., Wyllie, S. G. & Markham, J. Determination of octanol–water partition coefficient for terpenoids using reversed-phase high-performance liquid chromatography. J. Chromatogr. A. 864, 221 (1999).
59. Lowry, O. H., Rosebrough, N. J., Farr, A. L. & Randall, R. J. Protein measurement with the folin phenol reagent. J. Biol. Chem. 193, 265–275 (1951).
60. Oppenoorth, F. J. & Welling, W. Biochemistry and physiology of resistance in Insecticide biochemistry and physiology (ed. Wilkinson, C. F.) 507–551 (Plenum, 1976).
Acknowledgements
We are grateful to the anonymous reviewers for their constructive comments on earlier drafts of this manuscript. We also thank PhD Mary Langsdale (King’s College London) and Prof. Mark McNeill (AgResearch, Canterbury Agriculture and Science Centre, Lincoln, New Zealand) for their invaluable suggestions on manuscript organization and linguistic revision. This study was supported by the National Natural Science Foundation of China, 31672485, the Earmarked Fund for China Agriculture Research System, CARS-35-07, and the Innovation Project of Chinese Academy of Agricultural Science.
Author Contributions
Z.H.Z., X.B.H. designed the experiments. X.B.H., X.H.Q., J.C.M., G.J.W. performed the experiments. X.B.H., X.B.T. analyzed the data. X.B.H., G.C.C., X.Q.N. wrote the paper. All authors reviewed and considered the manuscript.
Additional Information
Supplementary information accompanies this paper at doi:10.1038/s41598-017-09277-z
Competing Interests: The authors declare that they have no competing interests.
Publisher's note: Springer Nature remains neutral with regard to jurisdictional claims in published maps and
institutional affiliations.
Open Access This article is licensed under a Creative Commons Attribution 4.0 International
License, which permits use, sharing, adaptation, distribution and reproduction in any medium or format, as long as you give appropriate credit to the original author(s) and the source, provide a link to the Cre-ative Commons license, and indicate if changes were made. The images or other third party material in this article are included in the article’s Creative Commons license, unless indicated otherwise in a credit line to the material. If material is not included in the article’s Creative Commons license and your intended use is not per-mitted by statutory regulation or exceeds the perper-mitted use, you will need to obtain permission directly from the copyright holder. To view a copy of this license, visit http://creativecommons.org/licenses/by/4.0/.