Source Space Estimation of Oscillatory Power
and Brain Connectivity in Tinnitus
Oliver Zobay1, Alan R. Palmer1, Deborah A. Hall2,3, Magdalena Sereda2,3, Peyman Adjamian1*
1MRC Institute of Hearing Research, University Park, Nottingham, United Kingdom,2National Institute for Health Research (NIHR) Nottingham Hearing Biomedical Research Unit, 113 The Ropewalk Nottingham, United Kingdom,3Otology and Hearing group, Division of Clinical Neuroscience, School of Medicine, University of Nottingham, Nottingham, United Kingdom
Abstract
Tinnitus is the perception of an internally generated sound that is postulated to emerge as a result of structural and functional changes in the brain. However, the precise pathophysiolo-gy of tinnitus remains unknown. Llinas’thalamocortical dysrhythmia model suggests that neural deafferentation due to hearing loss causes a dysregulation of coherent activity be-tween thalamus and auditory cortex. This leads to a pathological coupling of theta and gamma oscillatory activity in the resting state, localised to the auditory cortex where normal-ly alpha oscillations should occur. Numerous studies also suggest that tinnitus perception relies on the interplay between auditory and non-auditory brain areas. According to the Global Brain Model, a network of global fronto—parietal—cingulate areas is important in the generation and maintenance of the conscious perception of tinnitus. Thus, the distress ex-perienced by many individuals with tinnitus is related to the top—down influence of this global network on auditory areas. In this magnetoencephalographic study, we compare resting-state oscillatory activity of tinnitus participants and normal-hearing controls to exam-ine effects on spectral power as well as functional and effective connectivity. The analysis is based on beamformer source projection and an atlas-based region-of-interest approach. We find increased functional connectivity within the auditory cortices in the alpha band. A significant increase is also found for the effective connectivity from a global brain network to the auditory cortices in the alpha and beta bands. We do not find evidence of effects on spectral power. Overall, our results provide only limited support for the thalamocortical dys-rhythmia and Global Brain models of tinnitus.
Introduction
Subjective idiopathic tinnitus (TI) refers to a phantom sound that is consciously perceived without an external physical source. Several large population studies have suggested that the prevalence in adults is between 4.4 and 15.1% [1], and it is estimated that between 1 and 3 per-cent of the population are severely affected [2]. While these numbers clearly indicate the need
a11111
OPEN ACCESS
Citation:Zobay O, Palmer AR, Hall DA, Sereda M, Adjamian P (2015) Source Space Estimation of Oscillatory Power and Brain Connectivity in Tinnitus. PLoS ONE 10(3): e0120123. doi:10.1371/journal. pone.0120123
Academic Editor:Berthold Langguth, University of Regensburg, GERMANY
Received:July 30, 2014
Accepted:February 4, 2015
Published:March 23, 2015
Copyright:© 2015 Zobay et al. This is an open access article distributed under the terms of the
Creative Commons Attribution License, which permits
unrestricted use, distribution, and reproduction in any medium, provided the original author and source are credited.
Data Availability Statement:Although the data is fully anonymised, it is still subject to ethical considerations and the guidelines set by the Medical Research Council data sharing policy.
Funding:This study was entirely funded by the Medical Research Council in the UK.
for research into the condition, studies on TI also hold the prospect, on a more fundamental level, of yielding a better understanding of the workings of the central auditory system and the conscious perception of sounds [3].
The pathophysiology of TI is complex and poorly understood. There is, however, some con-sensus between the neurophysiological models of TI regarding several key mechanisms of its pathogenesis. First, it is assumed that in many cases the root cause of subjective TI is altered input into the auditory pathway due to some damage to the peripheral hearing system [4–6]. Second, consequent changes in neural activity occur at different processing stages resulting in disinhibition and increased synchronicity of groups of neurons in the auditory cortex. Third, at the cortical level, these effects are thought to be specific to certain frequency bands of neuronal oscillation and should therefore present characteristic signatures in spectral analyses (for a re-view, see [7]). According to the influential thalamocortical dysrhythmia (TCD) model [8,9], TI is the consequence of disrupted coherent activity between thalamus and cortex and corre-lates with gamma band activity (>30 Hz). In the healthy brain, the thalamus fires at around 10 Hz in the resting awake state, thus driving the connected parts of the cortex to oscillate at the same frequency. This alpha activity is thought to be consequence of a mechanism of pulsed cortical inhibition [10–12]. During sleep, but also in the deafferented state, the thalamocortical neurons fire in the theta range (4–8 Hz). Thus, oscillatory abnormalities may arise from input deafferentation that causes overinhibition of thalamic neurons, which in turn reduces their ex-citatory drive. This is proposed to result in hyperpolarisation of membrane potentials of tha-lamic neurons and large-scale slow-wave activity that entrains the return thalamocortical pathways into theta oscillatory activity. At the cortical level, the focal slow-wave oscillations of cortico-cortical inhibitory interneurons reduce lateral inhibition and disinhibit gamma oscilla-tions in neighbouring cortical regions. Consequently, abnormal gamma oscillaoscilla-tions appear as an“edge effect”in neurons surrounding the theta-locked areas of the auditory cortex and form the neurophysiological correlate of the conscious TI percept (seeFig. 1A). Thus, according to this model, theta and gamma activity should arise from different but adjacent locations on the auditory cortex. Electroencephalography (EEG) and magnetoencephalography (MEG) do not possess sufficiently high spatial resolution to localise these areas but given their excellent tem-poral resolution, we are able to assess frequency-specific predictions of the model in
more detail.
Building on the neurophysiological TI model of Jastreboff [4], the Global Brain Model (GBM) proposed by Schlee et al. [13] considers two main components, sensory and global, whose interplay results in the TI sound (Fig. 1B). The sensory component essentially comprises the auditory cortices and is again responsible for producing the neuronal gamma oscillations. These oscillations are thought to be due to a decreased alpha rhythm (8–12 Hz) caused by deaf-ferentation and leading to gamma disinhibition. The global component consists of a distributed network of interconnected brain areas. It is hypothesized that this network is connected to the global workspace associated with consciousness, as postulated by Dehaene et al. [14]. Once the neuronal signal enters this workspace, the TI sound is perceived. Crucially, the global level also exerts a top-down influence on the sensory level. In particular, it strongly contributes to the de-crease in alpha thereby perpetuating the perception of TI. The heuristic pathophysiological TI model proposed by de Ridder [15] is based on the TCD model, but describes a specific distress network whose activation brings about the negative emotional consequences of TI. Important nodes in this network are the amygdala, anterior cingulate cortex (ACC), anterior insula, para-hippocampus, and the dorsolateral prefrontal cortex.
oscillations should lead to a power increase in the gamma band. The TCD model also implies higher power in the theta band, whereas the GBM suggests a decrease in alpha power. A further consequence of the GBM is a negative correlation between alpha and gamma power [16].
A number of MEG and EEG studies have compared resting-state oscillatory activity in TI subjects to TI-free control groups, but so far a consistent picture has not emerged. Weisz et al. [17], [18] found increased power in the delta (1–4 Hz) and gamma bands of TI subjects and a reduction in alpha. This pattern was also observed by Adamchic et al. [19]. Although these re-sults indicate slow-wave activity to be increased in the delta rather than the theta band, they can be considered as generally in agreement with the theoretical predictions. However, a num-ber of studies reported different findings. Adjamian et al. [20] observed power increases in delta and theta, but could not detect significant differences for higher frequencies. Conversely, the results of Ashton et al. [21] showed differences only in the gamma band. Moazami-Gou-darzi et al. [22] found increased spectral power for TI participants in the frequency range 2–100 Hz with significant differences in delta, theta and beta (12–30 Hz). Finally, the large-sample EEG study of Weiler and Brill [23] revealed a marked distinction between male and fe-male TI patients with fe-males displaying adecreasein power in delta, theta, alpha and beta (there defined as 14–21 Hz) compared to same-sex controls, and females an increase in theta, alpha, and beta (gamma was not considered). It is not clear whether the discrepancies between the studies are due to methodological differences, sampling error, the composition of the samples or other reasons, but they certainly warrant further investigation.
[image:3.612.38.475.79.297.2]Connectivity analysis [24] provides a further opportunity for exploring the neural correlates of TI. It has been known for some time that the different brain areas do not work independent-ly of each other, but are connected to each other in a variety of long-distance networks (see [25] for a review). This suggests that information processing and cognitive functioning are the result of interactions or communication between distributed brain systems. The basic purpose
Fig 1. Neurophysiological models of tinnitus.(A) Thalamocortical dysrhythmia model [8,9]. In the deafferented region of the auditory cortex, thalamic inputs induce theta activity. Due to decreased lateral inhibition, this region is surrounded by an area of abnormal gamma activity (“edge effect”) leading to the TI percept. (B) Global Brain Model [13]. Decreased inhibition and increased excitability in the auditory cortices result from reduced sensory input. Tinnitus processing involves a globally extended fronto-parieto-cingulate network which amplifies the auditory neural activity by top-down influence. The level of tinnitus-related distress correlates with the extent of top-down amplification.
of connectivity analysis is to uncover relationships between different brain areas by detecting similarity or mutual influence between the corresponding source signals. One broadly distin-guishes between functional and effective connectivity [26,27]. Functional connectivity only as-sesses similarity (e.g. correlation) between signals. Effective connectivity also tries to establish causal relationships, i.e., to determine if one signal can be seen as the cause (or driver) of the other. It is expected that connectivity between areas varies between frequency bands, and con-nectivity measures should therefore be frequency-dependent [28].
The existing neurophysiological models predict TI to affect brain activity mainly in the theta, alpha and gamma bands, so it is plausible to regard connectivity changes in these fre-quency bands as supporting evidence for the TI models. The absence of connectivity changes in these frequency bands or changes inotherregions should not be regarded as evidence
againstthe models as the interplay between power and connectivity changes can be complex. Similarly, more detailed predictions, e.g., regarding specific pairs of nodes or the direction of the change in connectivity (i.e., increase or decrease), would require a solid understanding of the networks in which the auditory cortex is embedded and the various paths between the nodes. Such knowledge is not yet available.
A number of previous studies have investigated TI-related changes to brain networks. Fol-lowing some initial observations by Shulman and Goldstein [29], the first evidence for the exis-tence of a“tinnitus network”was given by Schlee et al. [30] using MEG. Comparing TI subjects and normal-hearing controls, they found abnormal functional connectivity in TI to be widely spread over the brain. In addition, connectivity between the ACC and the right frontal lobe as well as between the ACC and the right parietal lobe strongly correlated with TI intrusiveness. In a follow-up study, Schlee et al. [31] found an increase in functional connectivity for TI subjects in the alpha band and a decrease in gamma. They also showed that the gamma network changed with the duration of TI such that in participants with a TI duration of less than 4 years, the left temporal cortex was predominant in the gamma network, whereas in TI of longer duration, the gamma network was more widely distributed to include frontal and parietal regions. In yet an-other study by the same group, Schlee et al. [32] mapped cortical network hubs using an analysis of effective connectivity. The prefrontal cortex, the orbitofrontal cortex and the parieto-occipital region were among those areas whose connection strength was most strongly affected by TI compared to healthy controls. It was also found that the inflow into the temporal lobes signifi-cantly correlated with TI distress. For a review of related fMRI work, see [33].
In this study, we compare resting-state brain activity between TI participants and healthy controls, based on the analysis of MEG data. Given that a consistent and empirically confirmed picture of TI-related changes of cortical activity has not yet emerged, the motivation of this work is to provide further evidence useful for the assessment and refinement of neurophysio-logical theories of TI. More specifically, the first objective of our study is to perform a spectral analysis of the MEG data. Based on the theoretical TI models, we predict an increase of spectral power for participants with TI in the theta and gamma bands and a decrease in alpha. We ex-pect that any such changes should be particularly pronounced in the auditory cortices. The sec-ond objective is to carry out a connectivity analysis in order to obtain further information about the TI network. The existing theories do not make specific predictions about connectivity changes. However, as any such effects must be related to TI-associated brain activity, we will consider alterations in brain connectivity in the theta, alpha and gamma bands as supporting evidence for the TI models, as discussed above.
within and between these components. Both functional and effective connectivity are consid-ered in order to obtain complementary perspectives. To the best of our knowledge, such a com-bined study of the two types of connectivity has not been carried out so far in the context of TI. To implement the analyses described above, we develop an adaptation of the spatially hierar-chical framework used by Hillebrand et al. [34], as discussed in more detail below. In a second-ary, more exploratory analysis, connectivities are studied for a brain-wide network of localized regions of interest (ROIs). These ROIs underlie our modelling of the GBM as part of the hierar-chical framework (see details of source analysis). These investigations provide a more detailed and fine-grained view of TI-related network changes; however, due to the much larger number of statistical comparisons, the evidence is not as strong as for the primary analyses. Further analysis is carried out to address the correlation between connectivity strength and a beha-vioural measure of TI handicap.
Methods
Participants
Participants with TI were recruited from the Nottingham Ear, Nose and Throat (ENT) clinic, Nottingham Audiology Services and NIHR Nottingham Hearing Biomedical Research Unit. Control subjects were found from the general population. TI subjects had chronic subjective TI for at least six months prior to recruitment. Exclusion criteria were pulsatile TI, Ménière’s dis-ease, stapedectomy and neurological disorders. All participants were right-handed as assessed by the Edinburgh Handedness Inventory [35]. Ethical approval was granted by the Nottingham National Research Ethics Service (National Health Service) (code No. 08/H0408/89) and all participants gave written informed consent prior to enrolment. The cohorts included 28 TI participants (14 males, 14 females) with an average age of 54.7 years, and 19 non-TI controls (10 males, 9 females) with an average age of 39.0 years. The cohorts comprised the same partic-ipants as our earlier study [20], except for the addition of 5 controls and 2 TI subjects and the removal of 4 TI subjects based on the availability of data. The group of participants with hear-ing loss and no TI was not considered due to the low number of people (n = 8) in this group.
The severity of TI symptoms was assessed by the Tinnitus Handicap Inventory (THI) [36]. TI handicap was classified as slight (0–16), mild (18–36), moderate (38–56), severe (58–76), or catastrophic (78–100) [37]. According to these categories, 3 participants reported slight TI, 11 mild, 7 moderate, 5 severe and 2 catastrophic tinnitus. Hypersensitivity to sounds was assessed with a questionnaire where a score of>28 is indicative of hyperacusis [38]. Based on this crite-rion, 3 participants in the TI group were classified with hyperacusis.Table 1summarises the characteristics of the participants.
The Tinnitus Tester software [39,40] was used to measure TI laterality, loudness, dominant pitch, and quality. Further details of this procedure are provided in our previous papers [20,
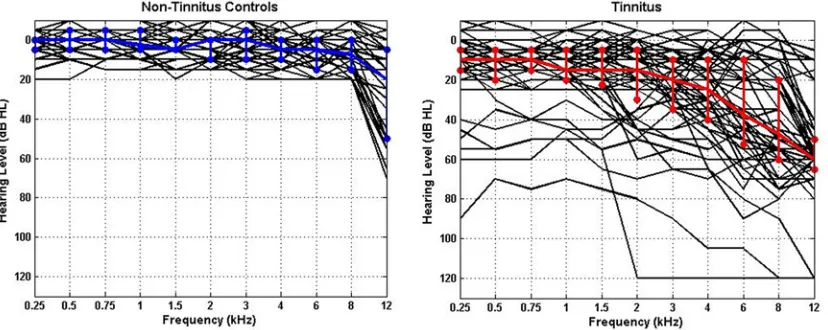
41]. Pure-tone audiometry was collected for each participant for frequencies between 0.25 and 12 kHz. Individual audiograms and the median for each group are shown inFig. 2, which illus-trate the thresholds for all ears in each group. The variability in hearing thresholds for each group is also depicted using the 25% and 75% interquartile ranges. All non-TI controls had clinically normal hearing (i.e., thresholds20 dB between 250 Hz and 8 kHz), but in most cases we found increased thresholds at 12 kHz indicating the existence of hearing loss (and deafferentation) at higher frequencies.
MEG data collection
additional 29 reference gradiometers and magnetometers for ambient noise cancellation. Data was collected at a sampling rate of 600 Hz. Participants were lying in a supine position while three electromagnetic coils were attached to the nasion and left and right preauriculars for con-tinuous head localization. Resting-state data consisting of alternating 1-minute segments of eyes-open and eyes-closed were obtained for a total of eight minutes. Participants were in-structed to open or close their eyes through an earpiece. For each subject, MRI anatomical scans were obtained using a Philips 3T or 1.5T scanner, depending on availability. Images were T1-weighted magnetization prepared rapid gradient echo sequence, with a matrix size of 256x256x256 and a defined voxel size of 1×1×1 mm3. Co-registration with the MEG data was performed using a surface-matching technique [42].
Fig 2. Individual (black lines) and median (coloured lines) audiograms for all ears in each group.(A) Non-TI controls (n = 19), (B) tinnitus participants (n = 28). The median thresholds are shown in blue and red, respectively.
[image:6.612.40.454.506.671.2]doi:10.1371/journal.pone.0120123.g002
Table 1. Characteristics of participant groups.
Variable Metric TI No TI
Gender Male/Female 14/14 10/9
Age Mean yrs (SD) 54.7 (12.8) 39.0 (14.0)
PTA1 Mean left (SD) 25.2 (18.5) 4.5 (6.4)
Mean right (SD) 21.1 (16.5) 4.0 (5.7)
THI2 Mean score (SD) 39.9 (21.1) NA
Hyperacusis3 Mean score (SD) 17.0 (9.4) NA
n4 3 NA
TI Quality Tonal/Hissing/Ringing 19/3/6 NA
TI Laterality Left/Right/Bilateral 10/6/12 NA
TI duration Mean yrs (SD) 12.9 (15.1) NA
1Pure-tone average (0.25–8 kHz). 2Tinnitus Handicap Inventory [36]. 3Assessed by means of questionnaire [38]. 4Subjects with hyperacusis (score>28).
Data pre-processing
Raw MEG data were bandpass-filtered between 0.5 Hz and 48 Hz and downsampled to 150 Hz. The current analysis used the eyes-open periods of the resting-state data as they were con-sidered to be less affected by artefacts after visual inspection. In order to exclude any transient effects, data segments of 5s and 1s length were removed from the beginning and end of the downsampled eyes-open periods, respectively. After applying the bandpass filter described above, the signal was found to still contain very strong line noise at 50 Hz. In addition, for many subjects the power spectrum also showed pronounced technical narrow-band noise around 21 Hz and 34 Hz (and sometimes at further frequencies). The origin of this noise is not known. To avoid confounding of connectivity estimates, the noise was removed using appro-priately chosen notch filters (for further discussion of this approach, seeResultssection andS4 Appendix). All data analyses were performed with Matlab (The MathWorks, Inc., Natick, MA) and the FieldTrip MEG analysis package (http://fieldtrip.fcdonders.nl/start) [43]. Independent Component Analysis (ICA) was applied to remove artefacts such as heart beat and eye blinks [44].
Source analysis
Source-space analyses are usually based on either a grid of voxels or a selection of ROIs. In this study, the ROI approach was chosen as results are more easily related to brain structure and theoretical TI models. We also expect this approach to have higher power for detecting TI-related effects.
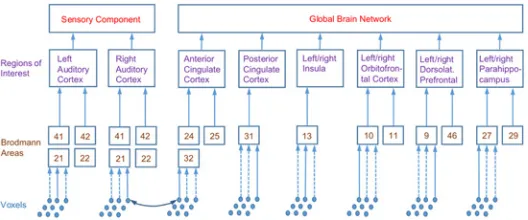
[image:7.612.201.465.516.626.2]One of the guiding principles of the current study was that analyses and computations are performed at various levels of a spatial hierarchy (seeFig. 3). The top level, which is used in the primary analysis, comprises the sensory and global components of the GBM. The second level of the spatial hierarchy consists of localized ROIs which are assumed to underlie the two com-ponents of the top level and which form the basis of our secondary analysis. More specifically, the sensory component is supposed to comprise the left and right auditory cortices (l/rAC). To increase power, the global brain network is modelled to consist of a limited number of ROIs which have been related to the TI network in previous work [15,31,45]. For anatomical identi-fication, the ROIs are broken down into the constituent Brodmann areas (BAs), which form the third level of the spatial hierarchy.
Fig 3. Spatial hierarchies used in source analysis.Diagram shows constituent Brodmann areas (BAs) of ROIs. Anterior and posterior cingulate cortex contain the listed BAs from both left and right hemisphere. Connectivity between two BAs is estimated by averaging over ten random pairs of voxels drawn from BAs, connectivity between ROIs and top-level component is obtained by averaging over respective lower levels. Abbreviations of ROIs used in the text: (l/r)AC: (left/right) auditory cortex, ACC: anterior cingulate cortex, DLPFC: dorsolateral prefrontal cortex, Ins: insula, OFC: orbitofrontal cortex, PCC: posterior cingulate cortex, PHC: parahippocampus.
The spatial hierarchy was motivated by the approach described by Hillebrand et al. [34] who studied brain networks at the level of Brodmann areas. This work computed connectivities between BAs by selecting a representative voxel for each BA, chosen as the grid point with the largest source power. In our framework, we follow a similar approach but add two further lay-ers on top of the BAs, i.e., the localized ROIs comprising several BAs and the top-level sensory and global components (seeFig. 3). These additional averages reduce spatial specificity, but we expect to gain statistical power (as the number of comparisons is reduced) and increase the ro-bustness of results.
To compute a quantity of interest at a given level of this hierarchy, we successively averaged over the underlying lower levels. For example, to compute functional connectivity between the top sensory and global component, we averaged over the connectivities between the underlying ROIs, which in turn are averages over the connectivities of the constituent BAs. To obtain the connectivity between two BAs, we randomly selected one voxel from each BA and computed connectivities between the voxels. This procedure was carried out ten times and BA connectivi-ty estimates were obtained by averaging over repetitions.
Connectivitieswithinthe sensory component were computed by taking the mean over the connectivities within the left and right auditory cortices. These in turn were computed as aver-ages over the connectivities between the respective constituent BAs. Connectivities within the global component were computed from connectivities between and within constituent ROIs (the latter for ROIs consisting of more than one BA).
To localize BAs in the individual subjects’MEG space, the WFU pick atlas (Wake Forest University School of Medicine, Functional MRI Laboratory) [46] was used which contains an atlas of BAs for a Montreal Neurological Institute (MNI) template brain. In the WFU pick atlas, BAs were defined on a cubic grid with 2 mm spacing. Each hemisphere has 42 BAs, and the total number of grid points (voxels) assigned to BAs is 60299. To make the number of grid points more manageable, we increased grid spacing to 4 mm leaving 7619 points. For each sub-ject, the MRI brain image was then spatially normalised to the MNI template brain using SPM8 (Wellcome Department of Imaging Neuroscience, UCL, London) and FieldTrip routines (i.e., a one-to-one transformation between points in the template and the subject headspace was established). Using this normalization and the MEG-MRI co-registration, the BAs were lo-calized in each subject’s MEG space. Spatial group averages were then performed as averages over equivalent ROIs across subjects.
Source time series for virtual electrodes at the grid points defined above were computed using the linearly constrained minimum-variance (LCMV) vector beamformer with unit-noise-gain normalization [47–49] and the regularization parameter [50] set to 5% of the mean of the diagonal of the covariance matrix. Hillebrand et al. [34] provide a description of the technical details of this projection method together with a discussion of its adequacy for the purpose of connectivity analysis. Here, we only note that the LCMV beamformer requires the covariance matrix between sensor signals. In the present analysis, covariance matrices were computed separately for the four different intervals of eyes-open data for each subject.
Spectral analysis
Connectivity analysis
Functional connectivity was computed using the imaginary part of spectral coherency in order to suppress artefacts from source leakage [51]. Averages were computed from the absolute value of imaginary coherency to avoid problems resulting from the arbitrariness of signal po-larity [34]. As a measure of effective connectivity, we employed partial directed coherence (PDC) [28]. The PDC valueπij(f)of the connection from sitejtoidescribes the strength ofj’s
influence onirelative to the total strength ofj’s influence on all sites, including itself, at fre-quencyf. For further details, seeS1 Appendix.
Analyses and statistics
Primary analyses were carried out on the level of the GBM and comprised comparisons be-tween TI and control groups for the following measures: power spectral densities for the senso-ry and global component; functional connectivity (imaginasenso-ry coherency) within the sensosenso-ry component (i.e., within left and right AC), within the global component and between sensory and global component; effective connectivity (PDC) within sensory and global component as well as outflow from the sensory component to the global component andvice versa. In addi-tion, correlations between these connectivities and TI handicap, as measured by the global THI score, were considered for the TI group.
All measures (spectra, connectivities, and correlations) depend continuously on frequency so that each of the comparisons actually presents a multiple-testing problem. To protect against type-I error inflation, we employed a cluster-based permutation test [52]: at each frequency, the two-sample independent t statistic for the comparison between TI and control groups was computed. Clusters were defined as contiguous regions along the frequency axis for which|t|
2. The cluster weight equals the sum of the absolutetvalues within the cluster. The p value of the cluster was computed through a standard permutation procedure by randomly assigning subjects to the patient and control groups. For the correlations, the cluster inclusion criterion was an absolute value of individual correlations above 0.373. This is the critical limit in a stan-dard significance test for a single correlation in a sample with the size of the TI group.
Formally, we consider each of the measures of the primary analysis as giving rise to a sepa-rate planned“family of comparisons”and provide multiple-comparison protection only within these families. Frequency regions containing significant differences between TI and controls are thus given by clusters with p values below 0.05. To provide further exploratory information, we also report clusters with p-values up to 0.1 as indicative of potential differences (note that p-values are not fixed absolute numbers but depend, e.g., on the overall width of the frequency interval examined). In the secondary analyses, connectivities and correlations were examined on the level of the localized ROIs. P-values were again computed for each comparison by means of a frequency-based permutation test. However, due to the vastly increased number of comparisons (e.g., connectivities for each pair of ROIs), the weight of the evidence is strongly reduced and the analyses are more of exploratory character.
Throughout the analyses, frequency is treated as a continuous variable. For descriptive pur-poses and more qualitative discussions, classical EEG frequency bands are assigned to frequen-cy intervals of interest based on overlap: delta (1–4 Hz), theta (4–8 Hz), alpha (8–12 Hz), beta (12–30 Hz), gamma (>30 Hz).
Results
Primary analyses
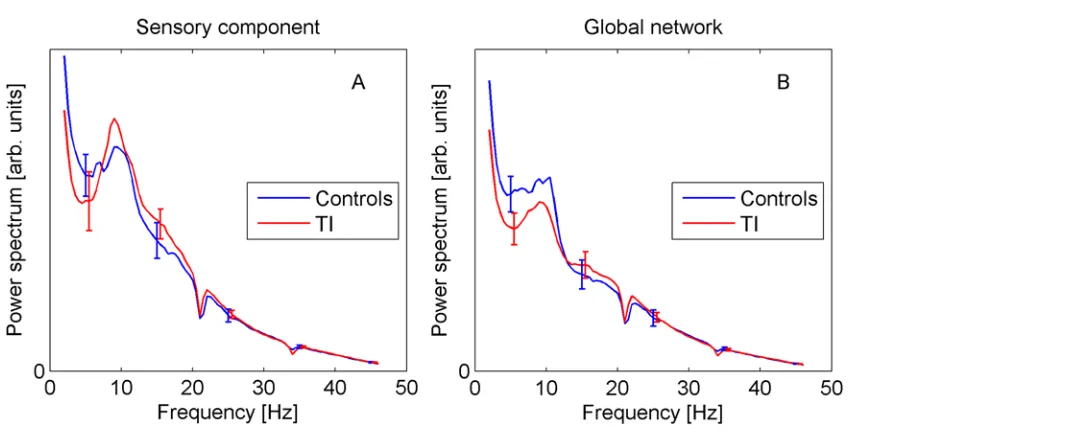
Introduction).Fig. 4shows the group-averaged spectra for the sensory and global components. They display the expected 1/fdecay with superimposed alpha peak. However, there is no statis-tical evidence for differences between TI and controls at any frequency (error bars in all plots show ±standard error). Note that the spectra display small dips around 21 Hz and 34 Hz, which are due to the notch filters applied to eliminate technical noise, as explained in the Methods section.
Functional connectivity (imaginary coherency). Based on the theoretical TI models we expect changes in connectivity in the theta, alpha, and gamma bands, as TI-related activity should occur mainly in these frequency regions. However, a definite prediction remains diffi-cult, and an absence of such changes, or changes in other frequency bands cannot be regarded as evidence against the models, as discussed in the Introduction.
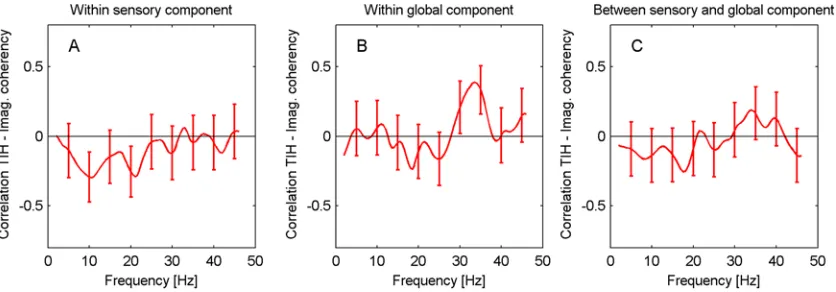
[image:10.612.34.575.70.290.2]Results for imaginary coherency are shown inFig. 5. Generally, the various curves display a peak around 10 Hz, which might perhaps be related to the alpha peak in spectral power. There
Fig 4. Power spectra for sensory (A) and global components (B).Error bars show standard error. doi:10.1371/journal.pone.0120123.g004
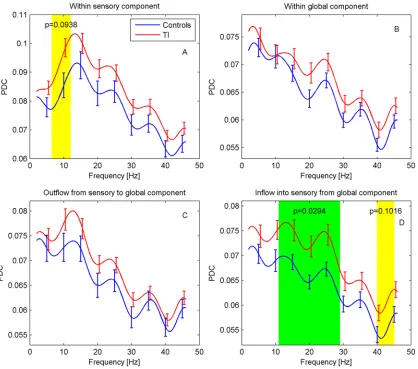
Fig 5. Functional connectivity for sensory and global components.Imaginary coherency is shown (A) within ACs, (B) within global network, (C) between ACs and global network. Frequency regions with significant differences (p<0.05, green) were determined with a cluster-based permutation test, regions with 0.05p0.1 are marked in yellow.
[image:10.612.49.454.517.665.2]is a statistically significant increase in functional connectivity for the TI participants within the auditory cortices in the frequency interval 6–11.5 Hz (p = 0.046). For a very similar frequency interval (6–11 Hz), there is an indication of a difference in connectivity between the auditory cortices and the global network (p = 0.082). No differences are found within the
global network.
Effective connectivity (PDC). For effective connectivity, we again expect any differences to predominantly occur in the theta, alpha, and gamma bands although more specific predic-tions are difficult to make. Results of the PDC analysis are displayed inFig. 6. Overall, PDC shows a gradual decrease with frequency. For the PDC within the sensory component (ACs), a distinct peak around 12 Hz can be recognized. Connectivity for TI participants appears to be generally elevated. In particular, a significant difference is found in the inflow into the auditory cortices from the global network for the frequency interval 11–29 Hz (p = 0.029), together with an indication of a difference at 40–45 Hz (p = 0.102). The PDC within the auditory cortices also shows an indication of a difference in the interval 6.5–12 Hz (p = 0.094).
[image:11.612.40.458.76.445.2]Correlations with TI handicap. The theoretical TI models predict TI-related activity in the theta, alpha, and gamma bands. We therefore expect correlations between connectivities
Fig 6. Effective connectivity for sensory and global components.PDC is shown (A) within ACs, (B) within the global network, and as (C) outflow from and (D) inflow into ACs from global network. Frequency regions with significant differences (p<0.05, green) were determined with a cluster-based permutation test, regions with 0.05p0.1 are marked in yellow.
and behavioural measures of TI to predominantly arise in these frequency regions.Fig. 7shows the correlations between the self-reported TI handicap (as measured by the global THI score, 0–100) and functional connectivity within ACs, within the global component, and between ACs and global component, respectively, for the TI group. In all cases, there are no significant correlations between THI scores and functional connectivity. The same result is found for the correlations between handicap and the different measures of effective connectivity (PDC) dis-cussed above (correlation plots not shown).
Secondary analyses
In the secondary analyses, spectra, connectivities and correlations are explored at the level of the ROIs (level 2 of spatial hierarchy, seeFig. 3).
Spectra. No significant differences between TI participants and controls were observed in the spectra for the individual ROIs. However, since there are many possible ways of statistically assessing the influence of TI on the power spectra, it is conceivable that other analysis ap-proaches might be more sensitive and better suited to detect effects at the sample sizes of this study. With a view to inform future data analysis, we therefore carried out additional explor-atory analyses following previously published methodology.
In a study involving subjects with a variety of neurological disorders related to thalamocorti-cal dysrhythmia, Llinas et al. [9] computed the ratio of aggregate spectral power in the intervals 5–10 Hz and 10–15 Hz. According to the TCD model, one would expect this ratio to be in-creased in the patient group. For our auditory-cortex spectra, the mean ratio across all partici-pants is 1.19 consistent with the overall decrease in spectral power with frequency, but there is no difference in ratios between TI and controls (means 1.18 and 1.20, p = 0.84 from permuta-tion test).
[image:12.612.38.456.77.223.2]Weisz et al. [17] performed a repeated-measures ANOVA with delta, theta and alpha power as levels of the within-subject factor and subject group as between-subject factor. For our AC data, we find neither a significant band x group interaction (F(1.47,66.1) = 1.764, p = 0.19 after Greenhouse-Geisser correction) nor a main group effect (F(1,45) = 0.175, p = 0.68). A further characteristic observation of Weisz et al. [17] that can be assessed even without recourse to the control group is a reduction of alpha power compared to delta in the TI group. For our data, we do not find such an effect in the auditory cortices (t(27) = -0.837, p = 0.41, in a paired t-test of delta-alpha, see alsoFig. 4). Lorenz et al. [16] report pronounced negative correlations be-tween alpha and gamma power in thenormalizedspectra. While we find a similar behaviour in
Fig 7. Correlations between TI handicap score and functional connectivity.Correlations for TI participants are shown (A) within the ACs, (B) within the global network, (C) between the ACs and the global network.
our data, it remains unclear whether this observation describes a real biological effect. Rather, it could also be a mathematical artefact caused by the spectral normalization which unavoid-ably introduces correlations between the different frequencies. In the unnormalized data, the effect is not visible. Further work is necessary to clarify this question, but we note that evidence for the existence of negative alpha-gamma amplitude correlations was provided in a cross-fre-quency coupling study of macaque visual cortex [53].
Functional connectivity. Results of the ROI-based analysis of functional connectivity be-tween the auditory cortices and the global network are displayed inS1 Fig. We find some node pairs with indications of differences (p<0.1) in frequency areas that more or less match the fre-quency intervals in the primary analysis (6–11 Hz) for which a similar difference was found (seeFig. 5). However, there are no nodes to which this difference can clearly be assigned. Its emergence thus appears to be the result of the aggregation over all ROIs in the global network. For the lAC-rOFC connectivity there is also a region in the gamma band that shows a signifi-cant difference (p = 0.030) although this region does not show up in the primary analysis. Within the global network, significant differences were found for the pairs rIns-PCC (39–44 Hz, p = 0.035) and rins-rDLPFC (36–40.5 Hz, p = 0.030).
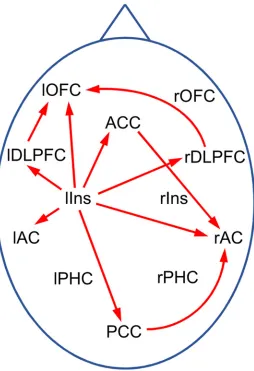
Effective connectivity. The primary analysis discovered significant differences in inflow into the ACs from the global network between TI participants and controls. It is thus of interest to further determine which ROIs in the global networks are responsible for these differences. A corresponding ROI-based analysis revealed the left insula as origin of the differential inflow into the left AC, and left insula, ACC and PCC as sources of inflow into the right AC (seeS2 Fig.). As a further interesting result, it was found that the PDCs from the left insula to several target ROIs show significant differences between TI participants and controls (S3 Fig.) al-though no differences for PDCs within the global network as a whole were detected in the pri-mary analyses. Altogether, the results of the secondary analyses for the effective connectivity suggest the“tinnitus network”shown inFig. 8.
Correlations with TI handicap. A further analysis examined the correlations between the THI scores and individual functional and effective ROI-to-ROI connectivities. The results did not provide any evidence for an association, in agreement with the conclusions from the primary analysis.
Additional analyses
In this subsection, we describe a number of additional analyses that were carried out to validate the results presented in Secs. 3.1 and 3.2. We investigate potential confounding effects of age, hearing loss, and noise contamination in the MEG signals, and compare the random-voxel-picking method used in the source analysis to alternative approaches.
Age
The TI and control groups are not very well matched in age (54.7 vs. 39.0 years). This issue can be traced back to participant recruitment in our earlier study [20] which had groups‘TI with hearing loss’(n = 22, mean age 53.9 years),‘TI with normal hearing’(n = 8, 41.0 years), and
‘No TI with normal hearing’(n = 14, 42.3 years). Pooling the two TI groups and deleting and adding several subjects (seeMethods) leads to the differences in mean age described above.
evidence was found, we concluded that the effects of age are negligible in the present investiga-tion. Details of these analyses are provided inS2 Appendix. However, to further investigate this issue, we have also related our findings to relevant results from other published studies. As ex-plained in the Discussion section, also from this perspective it seems unlikely that the observed effects are due to the influence of age rather than the TI abnormality.
Hearing loss. In order to get an indication of whether the differences in hearing level be-tween the control and TI groups might have a confounding influence on our results, we repeat-ed the analyses of our primary outcome measures including the average binaural hearing level between 0.25 and 4 kHz as a covariate. The calculations were carried out analogously to the analyses for age described above. Again, we did not find any evidence that the conclusions of our original analysis are affected by the differences in hearing level between the control and TI groups. A more detailed description of the analysis is given inS3 Appendix.
[image:14.612.207.461.76.447.2]Noise contamination. As noted in earlier, for a number of subjects the sensor signals were found to be contaminated with narrow-band noise at 21 and 34 Hz and sometimes other fre-quencies. In order to assess the effect of this noise on the analysis results, we compared the
Fig 8. Tinnitus network as obtained from exploratory PDC analysis.Red arrows indicate connections with significant differences (p<0.05) between TI and controls in some frequency window. Abbreviations: AC: auditory cortex, ACC: anterior cingulate cortex, DLPFC: dorsolateral prefrontal cortex, Ins: insula, OFC: orbitofrontal cortex, PCC: posterior cingulate cortex, PHC: parahippocampus; l/r: left/right.
computations of the primary outcome measures with and without applying the corresponding band-stop filters. It was found that the differences in the group averages as well as in the observed t-statistics were minimal (seeS4 Appendix). This observation indicates that the narrow-band noise does not have any substantial influence on the analysis and conclusions and does not pres-ent a serious confounding effect. Also note that the beamformer analysis used in our study has been shown to be a robust technique for removing pronounced noise in the sensor data [55].
Validation of random-voxel-picking approach. To compute the connectivity between two BAs, one would ideally average over the connectivities of all pairs of constituent voxels. However, due to the large number of voxels making up some of the BAs such calculations are too time consuming to be practically feasible. To reduce computation time, it would therefore be useful to base calculations on a small number of representative source signals for each BA. Hillebrand et al. [34] choose the voxel with the largest source power to assign a time series to a BA, as described above. However, there is no compelling reason to use this particular selection method and Hillebrand et al. [34] provide alternative choices. In the present paper, a voxel is selectedrandomlyfrom each BA, and connectivities are computed from this random set of vox-els. After carrying out this procedure ten times, BA connectivity estimates are obtained by aver-aging. As this procedure is not described in Hillebrand et al. [34], we validated it by
systematically comparing our functional connectivity results to computations based on two other methods. In the first method, each BA is represented by the voxel whose signal correlates most strongly with the signals of all other voxels within the BA, as suggested in [34]. For the other approach, we selected 20 voxels in each BA that are spread out evenly across the constitu-ent grid points. For each pair of BAs, the functional connectivity was determined as the average over the connectivities for all 20x20 pairs of voxels. Compared to the original method, we ex-pect this approach to be more accurate as it is based on 20 voxels selected to be spread out across the BA rather than 10 randomly drawn ones, and it uses 20x20 = 400 connectivities rath-er than 10 (each random voxel in one BA is paired with one from the othrath-er BA).
We find that the results from both approaches are in good agreement with the random-voxel calculations, and we thus conclude that our results are reliable and not unduly affected by artefacts of voxel selection. In addition, we also found very good agreement between our re-sults for the spectra and calculations using all voxels in each BA (for details of these analyses, seeS5 Appendix). Altogether, the random voxel-picking approach appears to present a good compromise between assigning a single time series to each BA, which may not completely cap-ture the signal variation within the BA, and methods using a large set of time series per BA which may yield very robust results but carry a high computational cost.
Discussion
The main objective of our investigation was to search for neural correlates of TI by analysing MEG resting-state data obtained from 28 participants with TI and 19 controls and to compare our findings to the TCD and global brain models of TI. The analysis of power spectra did not provide any evidence of significant differences between TI and controls. Functional connectivi-ty was increased for TI within the sensory component (auditory cortices) in the alpha band. A significant increase was also found for the effective connectivity between the ACs and the glob-al network in the glob-alpha and beta band. There was no evidence of correlations between connec-tivities and the score on THI.
Hearing loss
indicating that the clinical audiogram is an insufficient measure of cochlear integrity [56], in the current study we did not—in contrast to our previous work [20]—distinguish between TI with and without hearing loss at clinical frequencies and rather pooled the corresponding sub-jects in the TI group. Combining these participants is justified by the conclusion of this work that a distinction between TI with and without HL is not meaningful since TI is likely associat-ed with some degree of damage to the auditory system. Importantly, pooling TI participants in-creases the power of the statistical analyses.
We did not include the group of subjects with hearing loss and no TI from our previous work [20] in the current analysis as we considered the sample size (n = 8) to be too small. As a consequence, the present study does not allow to separate out the effects of hearing loss and TI.
Power spectra
As described in the Introduction, the current literature does not provide a clear and unambigu-ous empirical picture of how TI affects resting-state spectral power. Different patterns of spec-tral changes have been reported, and observations are not replicated between studies. At the moment the theoretical TI models are neither confirmed nor ruled out.
The present analyses did not find any statistically significant differences in the power spec-trum. Generally, power is expected to decrease with age [45]. Given the difference in mean age between the TI and control groups, we therefore cannot exclude that the lack of evidence for the expected power increase in the delta/theta and gamma bands is due to an age effect (even though the analyses did not find evidence of age effects in the present study). However, the ab-sence of evidence for an alpha power decrease cannot be explained in this way.
The lack of evidence for spectral power differences should not be taken to mean that such effects do not exist, in principle. Rather, based on the theoretical work it still seems reasonable to expect that TI has a measurable effect on cortical power spectra. Providing unambiguous empirical evidence for this effect remains an important stepping-stone towards a better under-standing of the neural mechanisms of TI. However, taken together with the previous inconclu-sive results of the literature, the current findings suggest that the corresponding effect sizes may be quite small. Effect sizes are determined by both the mean TI-induced actual change in spectral power and the variability within the TI population. It seems likely that the latter also considerably contributes to the problem. Recent connectivity studies have demonstrated het-erogeneity between TI subpopulations, e.g., short- and long-duration TI [31], or early and late onset [45]. To observe TI-related spectral changes more clearly, it thus might be advisable to work with larger sample sizes and focus on suitably defined subpopulations, in addition to standardization of data collection and analysis protocols to facilitate comparison and meta-analysis of studies.
We note that in our earlier study [20], we found an increase in spectral power in the delta band which is not replicated here. We can envisage several reasons that could explain this dis-crepancy. First, the subject groups do not coincide with the previous study as in the current analysis there are more controls and some changes in the TI group (seeMethods). Second, there are variations in the analysis methodology, in particular regarding the selection of voxels. Third, the raw datasets used in the analyses are not the same, and the paradigm (resting-state versus silence-masker) is very different. Finally, it is also possible that the variation is simply due to statistical fluctuations.
Functional connectivity
connectivity differences within the ACs is consistent with current theoretical neurophysiologi-cal models of TI. For example, the heuristic pathophysiologineurophysiologi-cal model of de Ridder [15] envis-ages that TI can be caused by hyperactivity in either the lemniscal pathway which projects to the primary AC or the extralemniscal pathway which projects to the secondary auditory cortex. Such a change of activity in one subregion of the AC could then affect connectivity to the other parts thus leading to the differences observed in our analysis.
In addition to the difference in connectivity within the ACs, we also find an indication of an increase in connectivity between the AC and the global network in a similar frequency region. Secondary analyses suggest that the difference cannot be tied to specific ROIs in the global net-work, but rather appears to emerge as an aggregate effect across all global-component ROIs.
Our results show an increase in functional connectivity for the TI group. A comparison of two groups of healthy controls with a difference in mean age of 30 years which was part of the EEG study [45] did not find differences in functional connectivity except for a decrease with age for two pairs of nodes in the gamma band. On the basis of this observation and our ANCOVA analysis, it seems unlikely that the connectivity increase reported here is due to an age effect.
The GBM of Schlee et al. [13] predicts a decrease in alpha activity in the auditory cortices. Our finding of a significant change in functional connectivity within the ACs in the alpha band thus provides support for this model. (Note that due to the complexity of brain dynamics a de-crease in activity can be accompanied by a dede-crease but, alternatively, also an inde-crease in con-nectivity. In the absence of more detailed hypotheses, our observation of an increase is thus consistent with the GBM.) A further study by Schlee et al. [31] found a change in functional connectivity in the alpha band as well; however, there a decrease was reported whereas our study observed an increase. As [31] considered whole-brain connectivity the two findings can-not be compared directly, but, nevertheless, it also is can-not clear whether they are compatible. A further difference is that these authors used the phase-locking value (PLV) [57] as functional connectivity measure which is very similar to absolute coherency. However, the PLV is vulner-able to confounding by source leakage [34].
Schlee et al. [31] also find a negative correlation between alpha and gamma connectivity. In contrast to the corresponding result for the spectra, it was ascertained that this observation is not an artefact from normalization. After normalizing the imaginary coherency at the level of the BAs, we also find negative correlations between connectivities in the alpha (8–12 Hz) and gamma band (40–46 Hz, the upper limit of our analysis). At the top level of our hierarchy and combining all subjects, these correlations range from -0.52 (connectivities between ACs and global component) to -0.59 (within ACs). However, before normalization these correlations range between -0.10 and -0.15.
Since our results show an increase in theta connectivity they provide some supporting evi-dence for the TCD model. However, the primary prediction of this model is an increase in theta activity (spectral power) which is absent in our data. The picture is thus not clear-cut. As confirmed by further analysis the observed connectivity increase is caused by an increase in co-variance (synchronicity) between the nodes in the absence of any significant change in the av-erage spectral power. It is not clear how this observation relates to the theoretical models of TI.
of unilateral (left and right) and bilateral TI participants are needed to achieve adequate statis-tical power. This is an important consideration for future studies.
Effective connectivity
The primary analysis of effective connectivity shows a significant increase of inflow into the ACs in the high-frequency alpha band and the beta band. In their MEG study of age-related changes in effective connectivity, Schlee et al. [58] do not find any evidence of age effects on the inflow into the ACs so that it appears unlikely that our observation is due to a confounding by age.
Fig. 6suggests a general increase in PDC in the TI group, although the statistical analysis only found two further regions with indications of differences between TI and controls, i.e., in the gamma band for inflow into the ACs, and in the alpha band for PDC within the ACs. At present, it is not clear whether this general increase could be confirmed in a study with larger power or whether it is a sampling effect. The significant increase in inflow into the ACs could be interpreted as an indication of the top-down influence of the global onto the sensory com-ponent postulated by the GBM, but it is not obvious how an overall elevation of PDC in the TI group might be explained by this model. Leaving the framework of this model, however, it is conceivable that one contribution to the increase in PDC originates from differences in how tinnitus subjects and controls focus their voluntary attention. As TI participants are aware of their participation in a tinnitus study, they are likely to focus their attention on it their tinnitus, whereas controls might direct their attention in a variety of ways. Our design did not attempt to control for effects of this kind. Behavioural studies have suggested a link between tinnitus and impaired attention [59,60], while brain imaging studies have revealed the involvement of various non-auditory structures in tinnitus that are linked to cognitive processes [61 ](Lock-wood et al., 2001). These findings indicate that attention maybe necessary for conscious aware-ness of tinnitus, or task involvement may suppress the abnormal tinnitus-related activity [62]. Future studies should attempt to delineate the effect of attention at local auditory cortex and at the network level.
The secondary analyses indicate that the left insula as well as ACC and PCC are the main sources of the increased inflow into the ACs. More specifically,S2 Fig. suggests that in the tin-nitus brain the ACC and PCC have an increased influence especially on the rAC, whereas the increased inflow from the left insula significantly affects both ACs, but more strongly lAC. Fur-thermore,Fig. 8suggests the existence of a TI network in which the left insula plays a central role. Schlee et al. [32] conducted a grid-based analysis of effective connectivity in TI partici-pants. In particular, they found one cluster in the orbitofrontal cortex with significantly in-creased inflow, and two clusters around the PCC and the cerebellum with reduced inflow, but no significant changes in inflow around the ACs. In addition, they found several regions with changes in outflow, but none of them involved the left insula. While our findings thus do not confirm the results of Schlee et al. [32], they are also not in obvious contradiction due to the differences in the analysis methods.
Previous studies have shown the insula to be involved in the TI network [45,63–65], but in none of these studies does the insula seem to play as central a role as in the current analysis. We therefore cannot exclude the possibility that our observation is biased by statistical fluctua-tions. However, insular activity is related to feelings of distress [66,67] so that the inclusion in the TI network is not surprising.
also fails to find a significant change in connectivity for the left insula. In order to assess wheth-er our mathematical analyses are consistent we have computed the imaginary cohwheth-erency from the MVAR fit to the MEG data. The MVAR fit forms the basis of the PDC calculation, but can also be used to compute other types of connectivities [68]. As we find good agreement between the MVAR coherency and the nonparametric calculation ofFig. 5we conclude that the MVAR model provides an appropriate description of the data and thus that the PDC calculations are not in any contradiction with the results from the imaginary coherency. The difference be-tween the results for coherency and PDC thus highlights the fact that these measures provide independent views of the general concept of connectivity which cannot easily be related to each other. In view of the above considerations, the observation of significant differences in the beta band should thus not be seen as a direct contradiction to the theoretical TI models.
Association with TI Handicap
Our primary analyses do not show any evidence of correlations between the TI handicap score and the connectivities related to the ACs and the global component. This observation is con-firmed by our secondary analyses which consider connectivities for the individual ROIs. Corre-lations between behavioural TI measures and connectivities have previously been observed in a number of studies. Considering TI distress as measured by a German tinnitus questionnaire [69], Schlee et al. [30] found significant correlations with the PLV between the ACC and a right parietal source, as well as with the coupling between the PCC and a right frontal source. The PDC analysis [32] detected correlations between this distress measure and the inflows into clusters in the temporal cortices. The fMRI study of Ueyama et al. [70] identified a number of regions, e.g., in the cingulate cortex, whose aggregate connectivities correlated with THI. Given the results of these and other studies [65] which all had sample sizes similar to ours, we ex-pected to also find clear evidence of correlations with THI in our data. The lack of significant correlations (seeFig. 7) which would persist even without multiple-comparison corrections (i.e., all individual correlations are below 0.373) is thus not easily reconciled with the existing literature.
Conclusions
Overall, our results are not in contradiction with the theoretical TCD and Global Brain models of TI, but they also provide only very limited support. We find a significant increase in func-tional connectivity for TI in the theta and alpha bands. The TCD and global brain models of TI predict the theta, alpha and gamma oscillations to play a particular role in the generation of TI, so this observation provides some supporting evidence for these models.
We acknowledge that the imperfect matching of our subject groups with respect to age and hearing level represents a potential limitation of our study. To assess the extent of possible con-founding effects, we have conducted auxiliary statistical analyses and related our findings to previous results in the literature. Even though these arguments cannot provide certain proof, they seem to make it plausible that our main conclusions are not severely distorted by confounding.
In spite of the inconclusive results, we believe that our study makes a valuable contribution to the ongoing research into the neuronal origins of TI. A particular problem for testing the theoretical TI models is that they do not provide any quantitative predictions about effect sizes. In the absence of a solid basis for power analysis, it thus appears reasonable to start by conduct-ing studies of moderate size such as the present one. However, the present results as well as the inconsistencies between the results of various similar recent studies suggest that sample sizes need to be increased substantially to obtain clear evidence of effects. In addition, it might be helpful to focus on particular well-defined TI subpopulations in order to reduce variability, and to standardize data analysis protocols to facilitate comparison and meta-analysis [33].
Another possibility for further research is to search for alternative electrophysiological markers that might be more sensitive to TI-related effects. Finally, we mention that our analy-ses point to a special role of the left insula in the TI network. This observation might also war-rant further investigation. Overall, the identification of the neural correlates of TI remains as an important question which remains unresolved and it is hoped that the current results will be useful for informing the design of future, potentially larger, studies.
Supporting Information
S1 Fig. Functional connectivity between left/right AC and ROIs in global brain network.
Frequency regions with significant differences (p<0.05, green) were determined with a cluster-based permutation test, regions with 0.05p0.1 are marked in yellow. Controls are shown in blue and TI subjects in red.
(TIFF)
S2 Fig. Effective connectivity from ROIs in global brain network to left and right AC. Con-trols are shown in blue and TI subjects in red.
(TIFF)
S3 Fig. Effective connectivity from left insula to all other ROIs.Controls are shown in blue and TI subjects in red.
(TIFF)
S1 Appendix. Computation of connectivities.
(DOC)
S2 Appendix. Analysis of age effects.
(DOCX)
S3 Appendix. Analysis of effects of hearing loss.
(DOCX)
S4 Appendix. Analysis of effects of noise contaminations.
(DOCX)
S5 Appendix. Validation of random-voxel-picking approach.
Acknowledgments
This research was funded by the Medical Research Council. MEG data was collected at the Sir Peter Mansfield Magnetic Resonance Centre, University of Nottingham.
Author Contributions
Conceived and designed the experiments: PA MS DAH. Performed the experiments: PA MS. Analyzed the data: OZ PA. Contributed reagents/materials/analysis tools: ARP PA. Wrote the paper: OZ PA MS DAH ARP.
References
1. Møller AR. Epidemiology of Tinnitus in Adults. In: Møller AR, Langguth B, De Ridder D, Kleinjung T, edi-tors. Textbook of Tinnitus. New York Dordrecht Heidelberg London: Springer; 2011. p. 29–37.
2. Davis A, El Rafaie A. Epidemiology of Tinnitus. In: Tyler RS, editor. Tinnitus Handbook. Clifton Park: Delmar, Cengage Learning; 2000. p. 1–23.
3. Norena AJ, Farley BJ. Tinnitus-related neural activity: Theories of generation, propagation, and central-ization. Hearing Res. 2013; 295:161–71. doi:10.1016/j.heares.2012.09.010PMID:23088832
4. Jastreboff PJ. Phantom Auditory-Perception (Tinnitus)—Mechanisms of Generation and Perception. Neurosci Res. 1990; 8:221–54. PMID:2175858
5. Eggermont JJ, Roberts LE. The neuroscience of tinnitus. Trends Neurosci. 2004; 27:676–82. PMID: 15474168
6. Norena AJ. An integrative model of tinnitus based on a central gain controlling neural sensitivity. Neu-rosci Biobehav R. 2011; 35:1089–109. doi:10.1016/j.neubiorev.2010.11.003PMID:21094182
7. Adjamian P, Sereda M, Hall DA. The mechanisms of tinnitus: Perspectives from human functional neu-roimaging. Hearing Res. 2009; 253:15–31. doi:10.1016/j.heares.2009.04.001PMID:19364527
8. Llinas R, Urbano FJ, Leznik E, Ramirez RR, van Marle HJF. Rhythmic and dysrhythmic thalamocortical dynamics: GABA systems and the edge effect. Trends Neurosci. 2005; 28:325–33. PMID:15927689
9. Llinas RR, Ribary U, Jeanmonod D, Kronberg E, Mitra PP. Thalamocortical dysrhythmia: A neurological and neuropsychiatric syndrome characterized by magnetoencephalography. P Natl Acad Sci USA. 1999; 96:15222–7. PMID:10611366
10. Lehtela L, Salmelin R, Hari R. Evidence for reactive magnetic 10-Hz rhythm in the human auditory cor-tex. Neurosci Lett. 1997; 222:111–4. PMID:9111741
11. van Dijk H, Nieuwenhuis ILC, Jensen O. Left temporal alpha band activity increases during working memory retention of pitches. Eur J Neurosci. 2010; 31:1701–7. doi:10.1111/j.1460-9568.2010.07227.x PMID:20525083
12. Mazaheri A, Jensen O. Rhythmic pulsing: linking ongoing brain activity with evoked responses. Front Hum Neurosci. 2010; 4:177. doi:10.3389/fnhum.2010.00177PMID:21060804
13. Schlee W, Lorenz I, Hartmann T, Müller N, Schulz H, Weisz N. A Global Brain Model of Tinnitus. In: Møller AR, Langguth B, De Ridder D, Kleinjung T, editors. Textbook of Tinnitus. New York Dordrecht Heidelberg London: Springer; 2011. p. 161–9.
14. Dehaene S, Changeux JP, Naccache L, Sackur J, Sergent C. Conscious, preconscious, and subliminal processing: a testable taxonomy. Trends Cogn Sci. 2006; 10:204–11. PMID:16603406
15. De Ridder D. A Heuristic Pathophysiological Model of Tinnitus. In: Møller AR, Langguth B, De Ridder D, Kleinjung T, editors. Textbook of Tinnitus. New York Dordrecht Heidelberg London: Springer; 2011. p. 171–97.
16. Lorenz I, Müller N, Schlee W, Hartmann T, Weisz N. Loss of alpha power is related to increased gamma synchronization-A marker of reduced inhibition in tinnitus? Neurosci Lett. 2009; 453:225–8. doi:10.1016/j.neulet.2009.02.028PMID:19429040
17. Weisz N, Moratti S, Meinzer M, Dohrmann K, Elbert T. Tinnitus perception and distress is related to abnor-mal spontaneous brain activity as measured by magnetoencephalography. Plos Med. 2005; 2:546–53.
18. Weisz N, Müller S, Schlee W, Dohrmann K, Hartmann T, Elbert T. The neural code of auditory phantom perception. J Neurosci. 2007; 27:1479–84. PMID:17287523
20. Adjamian P, Sereda M, Zobay O, Hall DA, Palmer AR. Neuromagnetic Indicators of Tinnitus and Tinni-tus Masking in Patients with and without Hearing Loss. Jaro-J Assoc Res Oto. 2012; 13:715–31. doi: 10.1007/s10162-012-0340-5PMID:22791191
21. Ashton H, Reid K, Marsh R, Johnson I, Alter K, Griffiths T. High frequency localised "hot spots" in tem-poral lobes of patients with intractable tinnitus: A quantitative electroencephalographic (QEEG) study. Neurosci Lett. 2007; 426:23–8. PMID:17888572
22. Moazami-Goudarzi M, Michels L, Weisz N, Jeanmonod D. Temporo-insular enhancement of EEG low and high frequencies in patients with chronic tinnitus. QEEG study of chronic tinnitus patients. Bmc Neurosci. 2010; 11:40. doi:10.1186/1471-2202-11-40PMID:20334674
23. Weiler EW, Brill K. Quantitative electroencephalography patterns in patients suffering from tinnitus. Int Tinnitus J. 2004; 10:127–31. PMID:15732509
24. Schoffelen JM, Gross J. Source Connectivity Analysis With MEG and EEG. Hum Brain Mapp. 2009; 30:1857–65. doi:10.1002/hbm.20745PMID:19235884
25. Bressler SL, Menon V. Large-scale brain networks in cognition: emerging methods and principles. Trends Cogn Sci. 2010; 14:277–90. doi:10.1016/j.tics.2010.04.004PMID:20493761
26. Friston KJ. Functional and effective connectivity: a review. Brain Connect. 2011; 1:13–36. doi:10.1089/ brain.2011.0008PMID:22432952
27. Horwitz B. The elusive concept of brain connectivity. Neuroimage. 2003; 19:466–70. PMID:12814595
28. Baccala LA, Sameshima K. Partial directed coherence: a new concept in neural structure determina-tion. Biol Cybern. 2001; 84:463–74. PMID:11417058
29. Shulman A, Goldstein B. Quantitative electroencephalography: preliminary report—tinnitus. Int Tinnitus J. 2002; 8:77–86. PMID:14763215
30. Schlee W, Weisz N, Bertrand O, Hartmann T, Elbert T. Using Auditory Steady State Responses to Out-line the Functional Connectivity in the Tinnitus Brain. Plos One. 2008; 3:e3720. doi:10.1371/journal. pone.0003720PMID:19005566
31. Schlee W, Hartmann T, Langguth B, Weisz N. Abnormal resting-state cortical coupling in chronic tinni-tus. Bmc Neurosci. 2009; 10:11. doi:10.1186/1471-2202-10-11PMID:19228390
32. Schlee W, Mueller N, Hartmann T, Keil J, Lorenz I, Weisz N. Mapping cortical hubs in tinnitus. Bmc Biol. 2009; 7:80. doi:10.1186/1741-7007-7-80PMID:19930625
33. Husain FT, Schmidt SA. Using resting state functional connectivity to unravel networks of tinnitus. Hear Res. 2014; 307:153–62. doi:10.1016/j.heares.2013.07.010PMID:23895873
34. Hillebrand A, Barnes GR, Bosboom JL, Berendse HW, Stam CJ. Frequency-dependent functional con-nectivity within resting-state networks: An atlas-based MEG beamformer solution. Neuroimage. 2012; 59:3909–21. doi:10.1016/j.neuroimage.2011.11.005PMID:22122866
35. Oldfield RC. The Assessment and Analysis of Handedness: The Edinburgh Inventory. Neuropsycholo-gia. 1971; 9:97–113. PMID:5146491
36. Newman CW, Jacobson GP, Spitzer JB. Development of the tinnitus handicap inventory. Arch Otolar-yngol. 1996; 122:143–8. PMID:8630207
37. McCombe A, Baguley D, Coles R, McKenna L, McKinney C, Windle-Taylor P. Guidelines for the grad-ing of tinnitus severity: the results of a workgrad-ing group commissioned by the British Association of Otolar-yngologists, Head and Neck Surgeons, 1999. Clinical otolaryngology and allied sciences. 2001; 26:388–93. PMID:11678946
38. Khalfa S, Dubal S, Veuillet E, Perez-Diaz F, Jouvent R, Collet L. Psychometric normalization of a hyper-acusis questionnaire. Journal for Oto-Rhino-Laryngology and Its Related Specialties. 2002; 64:436–42. PMID:12499770
39. Roberts LE, Moffat G, Baumann M, Ward LM, Bosnyak DJ. Residual inhibition functions overlap tinnitus spectra and the region of auditory threshold shift. Journal of the Association for Research in Otolaryn-gology. 2008; 9:417–35. doi:10.1007/s10162-008-0136-9PMID:18712566
40. Roberts LE, Moffat G, Bosnyak DJ. Residual inhibition functions in relation to tinnitus spectra and audi-tory threshold shifts. Acta Otolaryngolica. 2006; 126:27–33.
41. Sereda M, Hall DA, Bosnyak DJ, Edmondson-Jones M, Roberts LE, Adjamian P, et al. Re-examining the relationship between audiometric profile and tinnitus pitch. International Journal of Audiology. 2011; 50:303–12. doi:10.3109/14992027.2010.551221PMID:21388238
![Fig 1. Neurophysiological models of tinnitus. (A) Thalamocortical dysrhythmia model [8,9]](https://thumb-us.123doks.com/thumbv2/123dok_us/8677479.377821/3.612.38.475.79.297/fig-neurophysiological-models-tinnitus-thalamocortical-dysrhythmia-model.webp)