NANOMATERIALS FOR ENERGY STORAGE
Graham Armstrong
A Thesis Submitted for the Degree of PhD at the
University of St Andrews
2007
Full metadata for this item is available in Research@StAndrews:FullText
at:
http://research-repository.st-andrews.ac.uk/
Please use this identifier to cite or link to this item:
http://hdl.handle.net/10023/355
Nanomaterials for Energy Storage
A Thesis presented for the degree of Doctor of Philosophy
In the Faculty of Science of the University of St. Andrews By Graham Armstrong
January 2007 School of Chemistry
Declaration
I, Graham Armstrong, hereby certify that this thesis, which is approximately 28900 words in length, has been written by me, that it is the record of work carried out by me and that it has not been submitted in any previous application for a higher degree.
Date …… signature of candidate ………
I was admitted as a research student in October 2003 and as a candidate for the degree of Doctor of Philosophy in September 2004, the higher study for which this is a record was carried out in the University of St Andrews between 2003 and 2007
Date …… signature of candidate ………
I hereby certify that the candidate has fulfilled the conditions of the
Resolution and Regulations appropriate for the degree of Doctor of Philosophy in the University of St Andrews and that the candidate is qualified to submit this thesis in application for that degree.
Library Declaration
In submitting this thesis to the University of St Andrews I wish access to it to be subject to the following conditions: for a period of 1 year from the date of submission, the thesis shall be withheld from use. I understand, however, that the title and abstract of the thesis will be published during this period of restricted access; and that after the expiry of this period the thesis will be made available for use in accordance with the regulations of the University Library for the time being in force, subject to any copyright in the work not being affected thereby, and a copy of the work may be made and supplied to any bona fide library or research worker, that my thesis will be electronically accessible for personal or research use, and that the library has the right to migrate my thesis into new electronic forms as required to ensure continued access to the thesis. I have obtained any third-party copyright permissions that may be required in order to allow such access and migration.
Date …… signature of candidate ………
In submitting this portfolio to the University of St Andrews I understand that I am giving permission for it to be made available for use in accordance with the regulations of the University Library for the time being in force, subject to any copyright vested in the work not being affected thereby. I certify that I have obtained permission of all copyright holders for this action. I also understand that the title and abstract will be published, and that a copy of the work may be made and supplied to any bona fide library or research worker.
Abstract
Nanotubes (inner diameter of 8nm and outer diameter of 10nm with a length of up to several hundred nm) and nanowires (diameter 20 –50nm
and up to several μm in length) of TiO2-B have been synthesised and
characterised for the first time. These exhibit excellent properties as a host for lithium intercalation and are able to accommodate lithium up to a
composition of Li0.98TiO2-B for the nanotubes and Li0.89TiO2-B for the
nanowires. Following some irreversible capacity on the first cycle, which could be reduced to 4% for the nanowires, capacity retention for the nanowires is 99.9% and for the nanotubes is 99.5% per cycle. In both cases, the cycling occurs at ~1.6V versus lithium. The cycling
performance was compared with other forms of bulk and nano TiO2, all
of which were able to intercalate less lithium.
Nanowires of VO2-B (50 – 100nm in diameter and up to several μm in
length) were synthesised by a hydrothermal reaction and characterised.
By reducing the pressure inside the hydrothermal bomb, narrower VO2-B
nanowires with a diameter of 2 – 5nm and length of up to several hundred nm were created - some of the narrowest nanowires ever made by a
hydrothermal reaction. These materials are isostructural with TiO2-B and
were also found to perform well in rechargeable lithium ion batteries, being able to intercalate 0.84Li for the ultra-thin nanowires and 0.57Li
for the standard nanowires. The standard VO2-B nanowires have a
Macroporous Co3O4 (pore size 400nm with a surface area of 208m2/g) was prepared and cycled in rechargeable lithium cells with capacities of 1500mAh/g being achieved. The structure was found to break down on
the first cycle and after this the material behaved in the manner of Co3O4
nanoparticles.
Finally a new candidate for next generation rechargeable lithium batteries
was examined; Li/O2 cells. The cathode is composed of porous carbon in
which Li+, e- and O2 meet to form Li2O2 on discharge. The reaction is reversible on charge. Capacities of 2800mAh/g can be achieved when
5%mole of αMnO2 nanowires catalyst is used. Fade is high at 3.4% per
Index
Chapter 1 – Introduction p7
Chapter 2 – Techniques p32
Chapter 3 – TiO2-B Nanomaterials
- Synthesis and Characterisation p50
Chapter 4 – Cycling Performance of TiO2-B Nanomaterials p66
Chapter 5 – Electrochemistry of TiO2-B Nanomaterials p89
Chapter 6 – Cycling Performance of Anatase Nanomaterials p117
Chapter 7 – Titanate Nanotubes and Nanowires p132
Chapter 8 – VO2-B Nanomaterials p147
Chapter 9 – Macroporous Co3O4 p175
Chapter 10 – Li/O2 Cells p189
Chapter 11 – Summary and Conclusions p207
Chapter 12 – Acknowledgements p213
Chapter 1 - Nano-Materials and Rechargeable
Lithium Batteries
One of the major challenges facing the world today is the supply and storage of energy. Climate change caused by global warming is now
almost universally accepted as the greatest threat to humanity in the 21st
century. Part of the solution may be rechargeable lithium ion batteries. These devices provide a high energy density and have resulted in a huge size reduction of hand held electronic devices (laptops, mobiles, etc). If their power capabilities can be improved then they could act as ‘green’ energy stores in devices such as hybrid vehicles. This literature review will give a brief overview of rechargeable lithium battery developments, focussing in particular on inorganic nano and porous materials, the subject of this thesis.
Figure. 1.1 – Picture of the Mars Explorer robot; powered by lithium batteries.
1.1 – Overview of Lithium Batteries
The rechargeable lithium ion battery has not changed significantly since its introduction in 1990. The motivation for the development of lithium batteries was that lithium is the most electropositive and lightest metal. This allowed the possibility of very lightweight cells with a high energy density. Primary cells were first used in watches and other consumer
goods in the 1970s1. Exxon developed the first reversible cells; they used
TiS2 as a positive electrode and lithium as the negative. These cells had
disadvantages that included an explosion hazard due to lithium dendrite
growth2. The first commercial cells were known as ‘rocking chair’ cells
due to the constant forward and back motion of the lithium ionsii. They
represented a huge advance for energy storage devices, exhibiting more than twice the energy of conventional rechargeable batteries. These cells are constructed in the discharged state and then are charged before use. They work by having two intercalation electrodes; an anode (negative
electrode) of graphite and a cathode (positive electrode) of LiCoO2 and a
plastic separator soaked in an electrolyte. On charging, lithium ions are
removed from LiCoO2 and pass thought the electrolyte and are inserted
between the carbon layers in the graphite. Discharging reverses this
process3, as can be seen in figure 1.2. The relevant number of electrons
going around the external circuit balances the charge. These cells have an average potential of 3.6V, which is thrice that of the normal nickel cadmium battery, thus allowing fewer cells to be used for electronic
devices and facilitating more portable appliances4. Since this beginning,
lithium ion cells have become almost universal, with billions being sold every year5.
11 H. Ikeda, T. Saito and H. Tamura, Process of Manganese Dioxide Symposium, 1975, 1, 1. 2 B. Rao, R. Francis and H. Christopher, Journal of the Electrochemical Society, 1977, 124, 1490. 3 P. Bruce, Chemical Communication, 1997, 1817.
Figure 1.2 - Diagrammatic form of a lithium ion battery on discharge together with a photo of commercial lithium ion batteries
1.2 – Electrolytes for Rechargeable Lithium Batteries
Lithium batteries have three main components. Considered first is the electrolyte. In an ideal electrolyte, several things are required over the operating range of –20 to 50°C. These include high mobility for lithium ions, good chemical and thermal stability, a non-harmful environmental
effect and no side-reactions with the electrodes6. The electrolyte in most
common use is composed of lithium salts dissolved in an organic solvent.
The most common electrolyte is LiPF6 dissolved in ethylene carbonate
and dimethyl carbonate (EC/DMC). This system has several drawbacks including the reaction with trace amounts of water to form HF, which
often dissolves the electrodes7. The high melting EC is responsible for
poor performance at lower temperatures and LiPF6 is thermally unstable,
resulting in lower performance at higher temperatures. Many electrolyte salts have been examined to address these difficulties. One that has received much interest is lithium bis(oxalato)borate in EC/DMC. Several problems exist including low solubility; lower ionic conductivity than
LiPF6 based electrolytes8. Difficulties in obtaining the pure salt have also led to this material not being used commercially to date. Recently, ionic liquids have been examined due to their low volatility, high flash point and hence superior safety, but, so far, cost and reaction with the electrodes is a problem9.
The problems with liquid electrolytes have led the drive to develop a true solid, ceramic or polymer electrolyte. Ceramics introduce the problems of ceramic/ceramic interfaces at the electrolytes which can lead to cracking during discharge and poor conductivity. Polymer electrolytes, on the other hand, are soft solids and have good interfaces and have the advantage of allowing batteries to be made into any size or shape. They stop any possibility of leaks and are safer than traditional liquid electrolytes. The original material was amorphous. However, it has recently been shown that some crystalline polymer electrolytes also exhibit high conduction at room temperature. This conduction is caused by ion transport through the mobility of the cations, rather than both ions moving as in amorphous polymers. Adding impurities and thus redistributing the ions in the material, can improve conduction in these systems10. One such is crystalline PEO6:LiAsF611, as can be seen in figure 1.3. This has led to research aimed at obtaining plastic crystal polymer electrolytes, which, it is felt, are the way forward. Although true solid polymer electrolytes are not yet used, gel electrolytes, composed of a liquid electrolyte trapped in a polymer matrix are in use. However, these suffer many of the disadvantages of liquid electrolytes. Another class of material that is currently being investigated relates to crystalline polymer
8 K. Xu, S. Zhang, U. Lee, J. allen and T. Jow, Journal of Power Sources, 2005, 33(10), 1366. 9 A. Diaw, A. Chagnes, B. Carre, P. Willmann and D. Lemordant, Journal of Power Sources, 2005, 146(1-2), 682.
electrolytes as plastic crystals. The development of these materials as electrolytes is still in its infancy.
Figure 1.3 – Structure of the conducting crystalline polymer PEO6:LiAsF6.
1.3 – Anode Material for Rechargeable Lithium Batteries
In present rechargeable lithium cells graphite is used as the anode material. It can give 370mAh/g compared to 3600mAh/g for lithium, but the problems of reactive dendrites, plating/stripping of lithium and possible reaction with the atmosphere if the cell is damaged, make the use of lithium undesirable. On charging, lithium is intercalated into graphite at less than 100mV ensuring a high overall potential. However, this is
also a significant disadvantage because there is proximity to the Li+/Li
potential, which means there is a danger of plating lithium on graphite.
Graphite can also be exfoliated by Li+ as its associated solvent sheath
enters the sheets during charging. In fact, lithium ion batteries only work
because the CLix reacts with the electrolyte to form a solid electrolyte
consumes charge during its formation and hence is a ‘necessary evil’ to
permit the use of graphiteiii. A variety of processes such as pyrolytic
processing and milling are being employed on certain carbons, making
them capable of reaching reversible capacities of up to 450mAh/g12.
However, the problems of possible lithium plating and exfoliation of the graphite layer and SEI layer formation means that other materials are being examined as potential replacements.
There are a great number of materials that have been examined as possible materials for the negative electrode in rechargeable lithium batteries. They can belong to different categories, including intercalation,
alloy formation and displacement reactions13. Considering first
intercalation, a number of transition metal nitrides have been examined
including Li3-xCoxN. This material has a larger discharge capacity than
graphite, but it is air sensitive14, leading to processing problems. A
variety of transition metal oxides have been examined with a range of success. The most common are vanadium and especially titanium oxides. The most studied is Li4Ti5O12, a defect spinel (Li[Li0.33Ti1.66]O2), into
which three lithiums per Li4Ti5O12 may be reversibly inserted15. Other
materials investigated as intercalation anodes include LiFeSnO416
amongst many others. An important effect of moving the potential higher is that nano-particular anodes may be used, thus increasing the rate
capability and often the capacity of the material17.
12 D. Aurbach, Journal of Power Sources, 2000, 89(2), 206.
13 M. Winter, J. Besenhard, M. Spahr and P. Novak, Advanced Materials, 1998, 10, 725.
14Y. Takeda, M. Nishijima, M. Yamahata, K. Takeda, N. Imanishi and O. Yamamoto, Solid State
Ionics, 2000, 130, 61.
The second option is that of using alloys. These work by having the lithium react with the other elements that are present to form an alloy. This offers a much greater potential capacity than that of the carbon based electrodes. The most common materials that have been examined for this process are tin oxides. Capacities of over 1000mAh/g are achieved and the voltage is generally 1.5V versus lithium. Such a voltage avoids reaction with the electrolyte and provides a large buffer before lithium plating. These materials work by first reducing the tin oxide to tin metal
and oxidising lithium to Li2O. Once this has happened then the tin metal
can alloy reversibly with lithium to give large capacities. There are several problems with these materials. The first is that of an irreversible capacity on the first cycle due to the reduction of the tin oxide and the
second is the presence of non-reacting materials such as Li2O, which
lowers the capacity18. The realisation that irreversible capacity loss on the
first cycle is due to oxide formation led to the direct use of metals, such
as tin, iron and manganese.19 The final problem that these materials have
is a large volume expansion during cycling, which results in significant fade over time. Fujifilm have developed an electrode based upon nanoparticles inside a matrix that would appear to be more able to cope with the changes in volumeii.
There has also been considerable interest in anode materials that work through processes other than those discussed above. One of the most noticeable recent additions to this field was the development by Tarascon
of several copper vanadates that work via a copper extrusion process20.
Even more surprisingly, this process can be conducted reversibly. This
was shown by the cycling of Cu2.33V4O11. Copper dendrites, on lithium
18 B. Scrosati, Electrochemica Acta, 2000, 45, 2461.
intercalation, could be seen by TEM in figure 1.4. It is thought that the
lithium ions occupy the sites in between the V4O11 layers occupied by the
copper ions, which are more mobile after having been reduced from 2+ to
1+. These could then be extracted to give the copper dendrites, without
significant change to the structure. The material exhibited a capacity of
270mAh/g20. It has proved difficult to find other compounds that act
similarly, except for a silver vanadate.
A similar displacement process has also been investigated showing that transition metal oxide nanoscale powders can reversibly form lithium oxide nanoparticles without any significant fade occurring during cycling.
It has been shown by Tarascon21 that lithium can react usefully with
transition metal oxides (e.g. Co3O4 + Li → Li2O + Co). On reaction,
particles of nanoscale cobalt metal form in a Li2O matrix. On lithium
extraction, CoO and lithium metal are formed and the system does not
return to Co3O4. Reversible capacities of 1000mAh/g are possible. It has
also been shown that a polymer layer forms on the electrode and that this is also reversible. Other metal oxide powders have also been shown to
exhibit this behaviour, as have various metal fluorides22.
20 M. Morcrette, P. Rozier, L. Dupont, E. Mugnier, L. Sannier, J. Gray and J. Tarascon, Nature
Materials, 2003, 2, 755.
Fig. 1.4 – TEM picture of Cu dendrite created through cycling of Cu2.33V4O11
1.4 – Cathode Material for Rechargeable Lithium Batteries
An ideal cathode will have a voltage of above 3V in comparison to that of
lithium metal (Li+/Li). Electrodes of this type work generally through the
process of intercalation and, in conventional commercial cells, the cathode is a compound that starts in the discharged state, i.e. with lithium ions intercalated inside the structure. These ions are then repeatedly removed and inserted as the cell cycles. The most common cathode, at
present, is LiCoO2, which has layers of CoO6 octahedra with the lithium
ions in between23, as can be seen in figure 1.5. Alternate sheets of
octahedral sites are occupied by the transition metal and lithium ions. The extraction of lithium is easily performed in electrochemical cells with cobalt being oxidised from 3+ to 4+. There are several problems
associated with LiCoO2, which make it desirable to replace it with
another material that is more environmentally friendly, but yet has equal
or better performance. LiNiO2 has the same structure as LiCoO2 and is
cheaper. Unfortunately, it also has problems with cyclability due to disorder caused by lithium and nickel exchange between the layers and
safety concerns due to rapid removal of oxygen at elevated temperatures
and higher charge24. Doping of this material has been examined with
some encouraging results, including partial substitution of this material
with aluminium, which has given encouraging performance25.
LiNi0.8Co0.2O2 has been examined as it gives the best performance of the
Li(Ni1-xCox)O2 solid solutions. However, safety remains an issue in these
solid solutions although they give high capacities of around 180mAh/g26.
LiNi0.5Co0.5O2 can deliver a capacity of 150mAh/g and is more stable
than most Li(Ni1-xCox)O2 solid solutions and thus may be suitable for
applications requiring a long lifetime from the battery27. Manganese or
iron oxides would be attractive, being cheap and safe, but the pure materials suffer from structural change. Layered materials, such as
Li(Co0.33Mn0.33Ni0.33)O2 and Li(Mn0.5Ni0.5)O2, are receiving much
attention. Li(Mn0.5Ni0.5)O2 has been shown to have a discharge capacity
of around 200mAh/g with no obvious loss of capacity until at least thirty
cycles are over28. However, it suffers from structural disorder with
manganese in the lithium layers after cycling. LiNi0.33Mn0.33Co0.33O2 has
been found to have discharge capacities of up to 160mAh/g (at C rate, when defined as 200mAh/g up to 4.2V upper cut-off voltage) and very
little fade during cycling29. This and other materials of the form Li(M
0.5-xMn0.5-xCox)O2 are expected to be used in the next generation of lithium
batteries such as the MEXILION by Sony, due to the lower cost and slightly higher capacities.
24 T. Amriou, A. Sayede, B. Khelifa, C. Mathieu, H. Aourag, Journal of Power Sources, 2004, 130(1-2), 213.
25 T. Ohzuku, A. Ueda and M. Kouguchi, Journal of the Electrochemical Society, 1995, 142, 4033. 26 J. Ying, C. Wan, C. Jiang and Y. Li, Journal of Power Sources, 2001, 99, 78.
27 I. Belharouak, H. Tsukamoto and K. Amine, Journal of Power Sources, 2003, 119, 175. 28 Y. Makimura and T. Ohzuku, Journal of Power Sources, 2003, 119, 156.
The spinel LiMn2O4 and other solid solutions (e.g. Li(Li0.1Mn1.9)O2) are attractive because of their lower cost, lower toxicity and better safety. Recent interest has been due to their superior rate capability compared to the layered materials, making them the best available choice for
high-powered systems30. The main problems with the spinels are their lower
capacity (~120mAh/g) and dissolution in the electrolyte at 85°C31.
Several years ago, a new class of cathodes based on oxyanions was
introduced by Goodenough32. The most promising is LiFePO4, with the
olivine structure. It is cheap, safe and the voltage is 3.5V versus lithium.
The synthesis requires reducing conditions to ensure no Fe3+ is present.
This and the phosphate groups results in poor intrinsic conductivity. The performance can be improved by making nanoparticles and by coating
with the appropriate carbon33 and significant efforts are being made to
commercialise the material34. LISICON materials, such as Li2FeSiO4, are
a new class of oxyanion materials, with a capacity of 165mAh/g on the first cycle being reported. Capacity is stable after a phase transition on
the first cycle35, but again, the electronic conductivity is low and hence
rate performance is poor.
30 C. Fonseca and S. Neves, Journal of Power Sources, 2004, 135 (1-2), 249.
31 Y. Shin and A. Manthiram, Journal of the Electrochemical Society, 2004, 151(2), A204.
32 A. Padhi, K. Nanjundaswamy and J. Goodenough, Journal of the Electrochemical Society, 1997, 144 (4), 1188.
33 R. Dominko, M. Bele, M. Gaberscek, M. Remskar, D. Hanzel, S. Pejovnik and J. Jamnik, Journal of
the Electrochemical Society, 2005, 152(3), A607.
34 S. Yang, Y. Song, K. Ngala, P. Zavalij and M. Whittingham, Journal of Power Sources, 2003, 119,
239.
35 A. Nyten, A. Abouimrane, M. Armand, T. Gustafson and J. Thomas, Electrochemical
Figure 1.5 - Structure of Lithium Cobalt Oxide
1.5 – Overview of Nano-Materials
Nanomaterials with at least one dimension in the nanoscale are not new; Faraday discovered colloidal gold over 150 years ago. The field achieved a new level of interest following the discovery of the first, carbon
nanotube by Iijima in 199136. He was the first to call these structures
nanotubes, thus introducing this area of science. Since 1991 many inorganic nanomaterials have been discovered.
Nanomaterials can be classified into four forms according to the number of dimensions that are not in the nanoscale. Nanoparticles are 0D, nanowires and nanotubes are examples of 1D nanomaterials, and nanosheets are examples of 2D nanoparticles. Mesoporous materials that are made from nanoparticles would be examples of 3D materials. Nanomaterials are of considerable interest because their reduced dimensions often amplify the properties of the bulk materials. A description of some of the existing materials is given below.
1.6 – Nanoparticles
Nanoparticles are by far the most common of all nanomaterials. Some materials may be reduced to the nanoscale by milling, but this can induce sheers, phase changes or reactions. Many more elegant opportunities for the preparation of nanomaterials have been developed including low temperature, sol-gel methods, electrospray and hydrothermal synthesis.
Such nanoparticles have a high surface area, typically 40 – 100m2/g, and
they have a large range of applications such as in gas sensors, where the larger surface area gives a higher sensitivity and thus a lower detection limit37.
1.7 - Nanotubes
Figure 1.6. Tube and Scroll Nanotubes
Boron nitride nanotubes were first synthesised soon after the carbon nanotubes due to the isoelectronic nature of the boron-nitrogen bond to
the carbon-to-carbon bond38. These nanotubes are formed with the same characteristic hexagonal building unit that is present in the carbon
nanotubes. This was first predicted using modelling techniques in 199439
before the scroll like tubes were first synthesised in 199540.
The first inorganic nanotube was MoS2 and was initially discovered just a
year later than carbon nanotubes by Tenne and his group41. These are a
form of the dichalogenides. Inorganic nanotubes can exist in one of two forms: the first is that of a continuous tube, which is formed when the
sides join together, like the carbon nanotubes42. The second, and more
common type, is the scroll, which is formed when layers of the material roll up to give higher stability. The layers of these materials are unstable, thus initiating the scroll formation as a way of stabilising the compounds.
MoS2 nanotubes can be made by laser ablation, by arc discharge or even
by electron bombardment43. The most effective and most common
process would appear to be the reduction of the metal oxide in the
presence of hydrogen sulphide at high temperatures44. Another common
method is by the decomposition of the trisulphide or triselenide in a
hydrogen atmosphere45. All these preparation methods produce
nanotubes that may have many uses.
More recently, interest in oxide nanotubes has also increased rapidly. To date, nanotubes of vanadium, silicon, aluminium, magnesium, titanium
38 C. Rao and M. Nath, Dalton Transactions, 2003, 1. 39 M. Cohen, Solid state Communications, 1994, 92, 45.
40 N. Chopra, R. Luyken, K. Cherrey, V. Crespi, M. Cohen, S. Louie and A. Zettl, Science, 1995, 269,
966.
41 R. Tene, L. Margulis, M. Genut and G. Hodes, Nature, 1992, 360, 444. 42 P. Ajayan, Chemistry Reviews, 1999, 99, 1787.
43 M. Hershfinkel, L. Gheber, V. Voglterrea, J. Hutchison, L. Margulis and R. Tenne, Journal of the
American Chemical Scoiety, 1994, 121, 8234.
and tungsten oxides have been produced amongst many others46. Different methods are used for the synthesis including; templates, sol-gel and hydrothermal methods. Given below is a more detailed account of some of those that have been made.
This group includes nanotubes of V2O5, which has two sheets of VO5
pyramids pointing in opposite directions and connected by VO4
tetrahedra47, as seen in figure 1.7. V2O5 nanotubes were one of the
earliest oxide nanotubes to be synthesised. They have been prepared by
two methods, the first being the use of a conventional template48. This is
generally achieved by coating the internal surface of carbon nanotubes with the metal oxide and then heating to remove the carbon template. The second involves using a ‘soft-chemistry’ synthesis with amines as an
agent directing the morphology of the resulting material49. Most of the
nanotubes produced by synthetic means are open-ended and have a scroll like morphology. These nanotubes can also be produced by hydrothermal
means quickly and cheaply50.
46 G. Patzke, F. Krumeich and R. Nesper, Angewandte Chemie International Edition,2002, 41, 2446. 47 G. Patzke, F. Krumeich and R. Nesper, Angewandte Chemie International Edition,2002, 41, 2446. 48 P. Ajayan, O. Stephen, P. Redlich and C. Colliex, Nature, 1995, 375, 564.
49 M. Spahr, P. Bitterli, R. Nesper, F. Muller, F. Krumleich and H. Nissen, Angewandte Chemie, 1998, 37, 1263.
50 F. Krumeich, H. Muhr, M. niederberger, F. Bieri, B. Schnyder and R. Nesper, Journal of the
Figure 1.7 - Structure of V2O5
Carbon nanotubes have been used as templates in order to form several other metal oxide nanotubes. A similar process to that given above has
also been used to make zirconium nanotubes51 as well as molybdenum
oxide nanotubes52. There would appear to be no reason why this method
could not be applied to make most metal oxides.
Al2O3 nanotubes have been prepared by electrochemical methods. This
involves anodisation of an aluminium film on a silica substrate. This results in the growth of individual aluminium oxide nanotubes from the film. This method produced true tubular structures with an inner
diameter of 12nm and up to 650nm in length53. Several metal nanotube
arrays have also been produced in this way. This method opens the possibility of the production of a great number of nanomaterials through an electrochemical route.
51 C. Rao, B. Satishkumar and A. Govindaraj, Chemical Communications, 1997, 1581.
52 B. Satishkumar, A. Govindaraj, M. Vogl, L. Basumallick and C. Rao, Journal of Materials Research,
1997, 12(3), 604.
Nanotubes of complicated oxides, e.g. perovskites, have also been synthesised. Lead and barium titanate have been prepared from a solution of metal acetate in titanium isopropoxide and then coating onto
an anodic aluminium grid, thus using this as a hard template54. This
mixture was then calcined at high temperature to form the perovskite, before dissolving the template away in concentrated sodium hydroxide. This method produces aligned nanotubes of considerable length (up to 500nm is not uncommon), but with a larger diameter. These compounds are of considerable interest due to their ferroelectric properties. A similar method has also been used to make indium and gallium oxide
nanotubes55. Anodic aluminium oxide membranes have also been used as
a template to produce copper oxide nanotubes. However, in this instance chemical vapour deposition was used to deposit the copper oxide film. This produced a freestanding array of nanotubes with a diameter of
around 200nm56.
Titanium dioxide nanotubes are of great interest. These materials were
first reported by Kasuga and his group in 199857 and were synthesised by
a simple hydrothermal method. Initially these nanowires were thought to have anatase crystal structure. However, further work has shown them to
be hydrogen titanates58. Nanotubes with anatase and rutile structure have
since been produced by small variations on the synthesis59. Recently
Peng and his group have done studies to shown how the nanotubes are formed and conclude that titanate layers form, which peel off and form
54 B. Harnandez, K. Chang, E. Fisher and P. Dorhout, Chemistry of Materials, 2002, 14, 480. 55 B. Cheng and E. Samulski, Journal of Materials Chemistry, 2001, 11, 2901.
56 G. Malandrino, S. Finocchiaro, R. Nigro, C. Bongiorno, C. Spinnela and I. Fragla, Chemistry of
Materials, 2004, 16(26), 5559.
57 T. Kasuga, M. hiramatsu, A.Hoson, T.Sekino and K. Niihara, Langmuir, 1998, 14, 3160. 58 Y. Suzuki and S. Yoshukawa, Journal of Materials Research, 2004, 19(4), 982.
59 X. Gao, Y. Lan, H. Zhu, J. Liu, Y. Ge, F. Wu and D. Song, Electrochemistry and Solid State Letters,
nanotubes due to hydrogen deficiency60, as can be seen in figure 1.8. This is possibly the first paper to show the formation mechanism of any of these nanomaterials. These titanium dioxide nanotubes are thought to be of considerable commercial value and are being examined for use in many applications, including pigments, catalysts, solar cells and gas sensors. Much work has been done on these materials, as can be seen in later chapters.
Fig. 1.8 – Diagram showing the formation mechanism of titanate nanotubes.
Metal oxide nanotubes are a new and expanding field. They have considerable potential for use in a great number of industrial applications from catalysis to pigments. Many methods have been used to produce such materials, but, for commercialisation, materials must be synthesised cheaply and simply, probably by hydrothermal means, as these give high quality and high quantity of the material.
1.8 - Nanowires
[image:26.595.223.374.214.328.2]Nanowires are solid cylinders and are similar in size to nanotubes. As there is no need to create a hollow centre, they are easier and simpler to synthesise. Given below are a few examples of metal oxide nanowires complete with some general rules as to their synthesis.
Fig. 1.9 – SEM image of ZnO nanowires.
The first, and perhaps most common of these is the vapour growth mechanism, where the nanowires are formed during a reaction between a gas and a solid. Other methods involve growth at a gas/liquid or liquid/solid interface. These interactions in specific situations prompt
growth of nanowires instead of larger crystals61. There are also several
other mechanisms including oxide-assisted growth. Metal nanoparticles are subjected to a laser ablation method and produce nanowires by having metal oxide vapour form on the metal nanoparticulate which then builds
up in the same way as before to form the nanowires62. Carbothermal
reactions can also be used to produce nanowires such as GaN63. More
common, however, are solution-based reactions. This generally involves the use of a templating agent. These involve soaking a hard or soft template with the desired morphology in a precursor solution. The desired compound is then formed inside the pores, before the template is
61 Y. Wu and P. Yang, Journal of the American Chemical Society, 2001, 123, 3165.
removed through heating or another method. This has become a very common and successful technique with nanowires of most metal oxides being able to be produced by this method. Elemental nanowires have been made by this method and by chemical vapour deposition and pulsed laser ablation, including copper, gallium, indium, molybdenum and zinc. As for other forms of nanowires, semiconductors, carbides, nitrides and
dichalogenides have all been made using the above methods64.
Hydrothermal synthesis has played an important part in the synthesis of nanowires. A great number of nanowires have been produced in this
way. This includes various vanadium oxides65, several manganese
oxides66 and ZnO67 nanowires. A common theme in these syntheses is
reduction of the metal ions inside the hydrothermal bomb to form seed crystals, which then grow into nanowires.
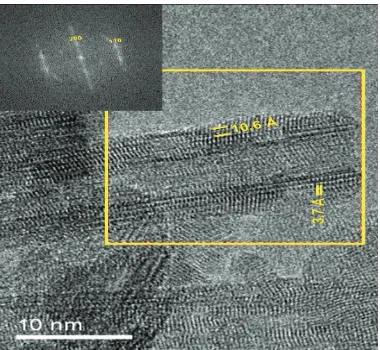
Figure 1.10 - TEM picture of titanate nanowires
1.9 - Nanosheets
Nanosheets are an example of 2D nanoparticles and have a large surface area due to the paper–like morphology. In general, these materials have one dimension of 50nm or less and the other two dimensions can vary
64 G. Patzke, F. Krumeich and R. Nesper, Angewandte Chemie International Edition,2002, 41, 2446. 65 Z. Gui, R. Fan, W. Mo, X. Chen, L. Yang, S. Zhang, Y. Hu, Z. Wang and W. Fan, Chemistry of
Materials, 2002, 14, 5053.
largely. These materials are generally formed through the exfoliation of a layered material or by decomposition reactions. A large number of
materials can be found with this morphology, including TiO2, ZnO,
Al2O3, NiO and MnO268. These materials often are formed in an
intermediate stage during the formation of nanotubes and nanowires.
1.10 – Micro, Meso and Macro-Porous Materials
The field of porous materials is huge and may be subdivided into several sections; microporous with pore size less than 2nm, mesoporous with a pore size of between 2 and 50nm and macroporous material with pores
that are greater than 50nm in diameter69. These porous materials are
attractive as electrode materials for lithium batteries due to their very high surface area, which is due to the internal network of pores. This should give high discharge capacities. Otherwise, commercially these materials have a large number of uses including catalysis and as drug supports70.
Zeolites were developed in the 1980s and are a well-known success story in the development of porous solids with small pores. Zeolites and many other microporous and mesoporous materials can be made in a number of ways. These include hydrothermal synthesis and the use of hard and soft templates. Most materials can be made to have these morphologies and therefore these materials have a large commercial usage in applications as
diverse as washing powder and electronic sensors71.
68 Y. Omomo, T. Sasaki, L. Wang and M. Watanabe, Journal of the American Chemical Society, 2003, 125(12), 3568.
69 K. Sing, D. Everett, R. Haul, L. Moscou, R. Pierotti, J. Rouquerol and T. Siemiemiewska, Pure
Applied Chemistry, 1985, 57, 603.
In this thesis, the focus is on the synthesis of macroporous electrodes. The most common method of synthesis involves forming arrays of identically sized spheres of polystyrene, silica, gold or silver. The particles are allowed to settle and then used as a scaffold around which the desired material can form. Although all of the above particles mentioned can be used, polymers such as polystyrene and polymethylmethacrylate are the most common. This is due to the ease with which spheres with differing average diameters can be produced thus allowing the pore size of the resultant material to be tuned to individual requirements. Such compounds also have a relatively low
melting point thus allowing the template to be removed easily72. These
compounds are much like natural opals, which have a three dimensional array with pores which are shiny due to having a cell constant of a comparable length to that of natural light73.
Figure 1.11 - SEM image of a macroporous inverse opal.
Although this field has been around for some time and materials such as
macroporous carbon are no longer unique74, many inorganic materials
have recently been made for the first time. Andreas Stein and his group have been pioneers in this field. They have reported the synthesis of
many inorganic oxides, including SnO2, LiNiO275 and LiCoO276, amongst
72 Y. Xia, B. Gates, Y, Yin and Y. Lu, Advanced Materials, 2000, 12(10), 693. 73 J. Sanders, Acta Crystallographica, 1968, A24, 427.
74 H. Take, H. Kajii and k. Yoshino, Synthetic Materials, 2001, 121(1-3), 1313.
75 H. Yan, S. Sokolov, J. Lytle, A. Stein, F. Zhang and W. Smyrl, Journal of the Electrochemical
others, by soaking a polystyrene template in a precursor solution and then heating to form the desired compound and to remove the template. These papers have led to many other materials being made, including that of the
commercial cathode material of lithium manganese oxide77.
1.11 – Nano-Materials for Use in Rechargeable Lithium Batteries
Nanomaterials are becoming increasingly important in the storage of electrochemical energy and have several potential advantages and disadvantages associated with them. Advantages include greater reactivity compared to the bulk material, shorter pathways for ionic and electronic conductance and better ability to deal with material expansion during cycling. Disadvantages include more complicated synthesis,
increased surface electrolyte interactions and low energy density78. The
advantages are such that higher capacity and less fade may be exhibited; therefore these materials have been investigated.
Nanotubes of V2O5 made by Sakamoto and Dunn showed that the
nanotube morphology gave high specific capacity and showed little fade
during cycling79. Nordlinger also looked at scroll V2O5 nanotubes,
prepared by template synthesis. They noted high specific capacity and that it corresponded to more than one electron being exchanged per vanadium atom. However, the results obtained were found to be highly dependant upon the electrolyte used and also a significant drop in
76 N. Ergang, J. Lytle, H. Yan and A. Stein, Journal of the Electrochemical Society, 2005, 152 (10),
A1989.
77 A. Eftekhari, Solid State Ionics, 2003, 161(1-2), 41.
capacity after one hundred cycles was noted80. Sider also tried several metal oxide nanotubes, all made by template synthesis using porous anodic aluminium and having diameters of around fifty nanometres. These all performed well with high capacities and little fade during
cycling81. Nanotubes of tin82 and nickel83 oxide have also been prepared
and both of these materials show high capacity combined with little fade. However, both of these materials were prepared by a complicated template method, which makes it unlikely that they will ever be used
commercially. Nanotubes of LiNi0.8Co0.2O2 have also been prepared by a
template synthesis84. These materials perform better than the
corresponding bulk material in lithium cells and better than the corresponding nanoparticles, with higher capacity and less fade. Relatively few studies of nanowires have been undertaken, perhaps because of nanotubes and nanoparticles having a higher surface area than
nanowires. However, VO2 nanowires have been synthesised and can be
shown to have higher capacity then the bulk material85. Most of the
studies of nano-electrodes have focussed on nanoparticles including Co3O486, TiO287, LiFePO488, MnO289 and Fe2O390. In general, these nanoparticles give a higher initial discharge capacity, but often produce greater fade as surface effects are greatly magnified.
80 S. Nordlinder, K. Edstrom and T. Gustafsson, Electrochemical and Solid-State Letters, 2001, 4(8),
A129.
81 C. Sides, N. Li, C. Patrissi, B. Scorsati and C. Martin, MRS Bulletin, August 2002, 604. 82 Y. Wang, H. Zeng and J. Lee, Advanced Materials, 2006, 18(5), 645.
83 S. Needham, G. Wang, H. Liu and L. yang, Journal of Nanoscience and Nanotechnology, 2006, 6(1),
77.
84 X. Li, F. Cheng, B. Gao and J. Chen, Journal of Physical Chemistry B, 2005, 109(29), 14017. 85 W. Chen, J. Peng, L. Mai, H. Yu and Y. Qi, Chemistry Letters, 2004, 33 (10), 1366.
86 Z. Fu, Y. Wang, Y. Zhang and Q. Qin, Solid State Ionics, 2004, 170(1-2), 105.
87 I. Exnar, L. Kavan, S. Huang and M. Graetzel, Journal of Power Sources, 1997, 68(2), 720. 88 P. Prosini, M. Carewska, S. Scaccia, P. Winiewski and M. Pasquli, Electrochimica Acta, 2003, 48(28), 4205.
89 S. Kobayashi, Y. Uchimoto and M. Wakihara, Electrochemistry, 2004, 72(6), 395.
90 S. Kanzaki, T. Inada, T. Matsumara, N. Sonoyama, A. Yamada, M. Takano and R. Kanno, Journal of
TiO2 materials are of great interest in this case as potential anode materials for lithium batteries. This is because they do not plate lithium and are not bothered by SEI layer formation. There are several polymorphs. Most, including rutile and brookite, do not intercalate lithium. Anatase can act as a lithium host and has a maximum content of 165mAh/g. The method has been investigated and shows a two phase
reaction occurring91. Making anatase nanoparticles has also been shown
to improve capacity compared to the bulk material and higher capacities
can be reached92. Li4Ti5O12 is being commercialised and can deliver
capacities of up to 175mAh/g when cycled in rechargeable lithium ion
cells93. This material has also been prepared in nanowire morphology
and is shown to increase performance. TiO2-B is an open polymorph
with a theoretical capacity of 330mAh/g94, which is higher than other
TiO2 based materials and therefore work has focussed on this material.
These results have prompted much study into the above materials as commercial prospects and work is being done to optimise the usage of
these materials in ‘real-life’ batteries95 with the hope that the next
generation of lithium cells is powered by nanomaterials. Some of this is elaborated in the following chapters.
91 V. Luca, T. Hanley, N. Roberts and R. Howe, Chemistry of Materials, 1999, 11, 2089. 92 I. Exnar, L. Kavan, S. Huang and M. Graetzel, Journal of Power Sources, 1997, 68 (2), 720. 93 G. Amatucci, F. Badway, A. Pasquier and T. Zheng, Journal of the Electrochemical Society, 2001, 148, A930.
94 R. Marchand, L. Brohan and M. Tournoux, Materials Reseach Bulletin, 1980, 15,1129
95 J. Christensen, V. Srinivasan and J. Newman, Journal of the Electrochemical Society, 2006, 153 (3),
Chapter 2 – Techniques
Characterisation of transition metal oxides of nano-dimensions requires the use of a battery of techniques to understand the shape, nanostructure, composition and electrochemical properties. The techniques used are described below.
2.1 – XRD
X-rays were discovered in 1895 by Roentgen and since then they have been used for a wide variety of applications in medicine and elsewhere. X-rays are a form of electromagnetic radiation with a wavelength of the
order 10-10m, which is similar to the distance between most atoms. This
makes them particularly useful in crystal structure determinationi.
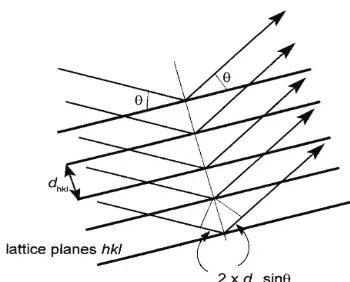
Figure 2.1- Diagrammatical explanation of Bragg’s law, showing the path of x-rays through a material.
nλ = 2dsinθ
Equation 2.1 – Bragg’s law.
When the x-rays, hit the material, they are diffracted. Von Laue was the first to recognise this process. The x-rays are diffracted from the sample according to Bragg’s law, equation 2.1, and in the manner shown in figure 2.1. This states that, in order to obtain constructive interference, the difference between the path lengths of the beams diffracted from two adjacent lattice planes must be equal to an integer of the wavelength.
Otherwise destructive interference is obtainedi.
In powder x-ray diffraction, the x-rays hit a powder that will have randomly orientated crystals. As a result, all sets of planes are able to diffract, resulting in a series of concentric cones. These are separated out by the d-spacings between the planes and not by specific sets of planes (unlike crystal diffraction, where each set of planes gives rise to diffraction spot). As a result of the degeneracy of sets of planes with the same d-spacing, it is difficult to extract detailed structural information
from powder diffraction96.
In this work, X-rays generated from copper and iron have been used. This is because in some cases, these metals produce radiation that has a similar wavelength to that required to excite electrons to higher energy states in the material under examination. When this happens, fluorescence occurs, which results in a higher background count and thus lower peak to background ratio.
Samples for powder X-ray diffraction were prepared by two methods. Firstly by placing a powder tightly and flatly into an aluminium holder
and then collecting data in reflection mode (Philips Xpert system (CuKα
= 1.5418Å)). This was the preferred method for titanium samples, which would fluoresce with iron and copper sources. No cobalt source was available, so the best approach was to use a copper source and an analysing monochromator to remove the fluorescence. The advantage is that a primary beam monochromator can be used, which gives a higher resolution. The second method involved sandwiching a small amount of the material between two polystyrene disks and transmitting the X-rays through the sample in transmission mode. This was done on STOE
STADIP machines; one with an iron anode (FeKα = 1.936Å) and one
Figure 2.2 – Photograph of STOE STADIP.
2.2 – Raman Spectroscopy
Raman spectroscopy is also used as a finger print technique and is often useful as it can detect short order interactions. Laser light from the visible range of the spectrum impinges on the sample. The photons are in-elastically scattered. There is a difference in energy between the incident light and the emitted light. This difference, as shown in figure 2.3, is equal to the vibrations of molecules in the sample. This energy is then focussed onto a detector, as shown in figure 2.4, and a Raman spectrum
plot of the scattered light versus the energy difference is observed97.
Figure 2.3 – Diagram showing Raman scattering.
Figure 2.4 – Diagrammatical representation of Raman spectrometer.
Samples were prepared by pressing a pellet (0.3cm diameter) of the material to be studied and then investigating on a Perkin-Elmer system 2000 FT-IR Raman spectrometer with a diode pumped Nd:YAG laser (wavelength = 1064nm).
2.3 – TEM and Electron Diffraction
Transmission electron microscopy (TEM) is a powerful tool with which to determine the morphology of solids. Electron diffraction can also be performed to examine the local crystal structure.
Ruska and Knoll made the first electron microscope in 1931. This was a significant advance due to the high amount of local detail that can be seen. The limit of resolution of a normal microscope is roughly 100nm, whereas for an electron microscope the theoretical maximum resolution is 0.8Å. This is possible due to the short wavelength of electrons (at 200kV = 0.0251Å). It is also one of the few methods that allows two-dimensional information to be gathered.
In a transmission electron microscope, a beam of electrons is generated
then accelerated up to high speed by passing it across a potential difference; here 200kV. This beam is then focussed onto the sample. The sample is held on a holey carbon grid. The remaining beam, that is not absorbed by the sample, is focussed onto a screen and an image is obtained, figure 2.5. Electron diffraction is obtained in a similar manner. However, the beam is much more highly focussed onto a small area of the sample, which then diffracts the beam giving a diffraction pattern. This is
a Fourier transform of the image that would have been obtained98.
Electron Gun
Anode
Condenser Lens
Specimen
Objective Lens
Diffraction Plane Intermediate Image Objective
Aperture
Projector Lens
Viewing Screen
Figure 2.5 – Diagrammatical representation of the workings of an electron microscope.
Samples are typically prepared by dispersing a small amount of the material in acetone, sonicating and then transferring this onto a holey carbon grid. Importantly, as this is a transmission technique, samples up to several micrometers in length can be examined in detail. The sample was then examined using a JEOL JEM-2011FX microscope, shown in figure 2.6. Many particles must be examined to ensure that the images are representative of the powder as a whole.
Figure 2.6 – Photograph of JEOL JEM-2011FX microscope.
2.4 – SEM and EDX
Scanning electron microscopy (SEM) is a complementary technique to TEM to examine the morphology of samples. This has a lower maximum magnification so is often used to determine overall morphology of a sample. Energy dispersive x-ray spectroscopy (EDX) can be combined with both SEM and TEM to provide the local chemical composition of a material.
In SEM, a beam of electrons is again generated from a tungsten wire filament or a field emission gun. The beam of electrons is then accelerated to high speed by passing it across a potential difference (30kV) and is then focussed upon the sample. This causes radiation in the form of secondary electrons to be emitted. The radiation is then focussed onto a detector and shown as a two-dimensional image. A
Electron gun
Focusing Lens
EDX Detector
Collector
Amplifier Computer
Final lens
Specimen
Figure 2.7 – Diagram of the working of a scanning electron microscope.
With EDX, the electrons ejected from the core energy levels by the incident electron beam permit higher energy electrons to drop down to the core energy levels thus emitting X-ray radiation, figure 2.8. The resultant radiation is representative of the atoms present and therefore the
E=0
M
L K
Lα
Kα
Kβ
(a)
(b) EKα=E(L shell) - E(K shell)
Figure 2.8 – Diagram showing the generation of x-rays.
Samples are prepared by using sticky fixers to attach a small amount of sample onto a copper stud. In the case of non-conducting samples, these must be sputtered with gold to obtain a conducting layer on top of the sample, therefore avoiding sample charging and thus improving the image. Samples were examined with SEM and EDX using a JEOL JSM-5600 scanning electron microscope with a resolution of up to 3.5nm, figure 2.9.
2.5 – TGA-MS
Thermo-gravimetric analysis combined with mass spectrometry (TGA-MS) is a powerful tool with which to study the thermal decomposition of materials, providing information about the chemical composition of the gases emitted at the temperature at which the decomposition occurs. A powder sample is located on an accurate balance and is subjected to heating at a specified rate. Weight loss versus temperature is recorded and the gasses emitted are analysed insitu by a mass spectrometer.
In this case, samples were run as a powder. They were run on a Netzch STA 449C machine with an argon atmosphere, because the system is sealed, specific heat capacity can also be measured versus temperature.
2.6 – BET
The Brunauer-Emmett-Teller (BET) method was used to obtain information on the surface area of the materials. This uses nitrogen absorption from liquid nitrogen to obtain data from which the surface area can be calculated. Measurements are taken with varying amounts of nitrogen being put into the sample and the partial pressure of each being measured. From this an isotherm can be plotted, from which the surface area can be calculated.
2.7 – ICP
Inductively coupled plasma mass spectrometry (ICP) was used to obtain the chemical composition of the material.
The sample is prepared as a pellet (1.3cm2) with teflon and is then ablated
with a laser (Nd:YAG) and the evolved species are carried by the carrier gas (Ar) to an argon plasma flame, which atomises the sample and allows mass spectrometry to be conducted. This is then compared against a blank teflon pellet to remove the background. An average of eight readings was taken. An Agilent 7500 series was used.
2.8 – Neutron Diffraction
Neutron diffraction was carried out at the Rutherford-Appleton lab near Oxford. Like X-rays, this technique gives information about the crystal structure of a material as the wavelength is similar to the dimensions of interatomic distances. There are differences, however, these include the ability to sense lighter elements, allowing neighbouring elements in the periodic table to be identified and isotopes of the same element to be identified.
bombarding the sample with neutrons while collecting the data at a fixed angle and determining the wavelength from the time the radiation takes to travel the total flight path to the detector via the sample99.
Figure 2.10 – Diagram showing neutron diffraction time of flight reactions.
Powder samples were contained in 5mm cylindrical vanadium cans and then run on GEM, figure 2.11, at the Rutherford-Appleton labs. GEM has an incident path length of 17m, maximum beam dimensions of 40 by 20mm and zinc sulphide detectors that allow scattering to be measured from 5 to 170°. Models were obtained by a Rietveld refinement method using the program ‘Prodd’ based on the Cambridge Crystallographic Subroutine Library (CCSL). Scattering lengths of -0.19, -0.3438, and
0.5803 (all x 10-12 cm) were assigned to Li, Ti, and O respectively100.
The data was corrected for absorption. The published structure of TiO2
-B101 was used as a starting point for the refinement.
99 A. Hannon, Neutron Diffraction, Oxford, 2005. 100F. Sears, Neutron News, 1992, 3(3), 26.
Figure 2.11 – Diagram and photograph of GEM.
2.9 – EXAFS and XANES
Extended x-ray absorption fine structure (EXAFS) and x-ray absorption near-edge studies (XANES) were used to find information about the structural environment around the atoms.
The technique involves generating a monochromatic beam of x-rays from a synchrotron that is focussed on the sample and then increasing in energy until it crosses an absorption edge of the element of interest. The absorption edge indicates where the sample has started to absorb the radiation and thus is different for each sample. Small differences in absorbance provide information about the structural environment of the atoms surrounding the element of interest. This generates a pattern with the XANES region being up to 40eV after the absorption edge and
everything else being the EXAFS pattern, shown in figure 2.12102.
Figure 2.12 – Diagram showing XANES and EXAFS spectrum.
Samples were made into pellets with teflon and were then run on station 7.1 at the Daresbury laboratory. Titanium was the element of interest.
2.10 – Cell Fabrication
Cell fabrication provides a viable tool with which to study the properties of intercalation compounds as well as assessing the potential such materials may have as electrodes in rechargeable lithium batteries The materials were prepared in cells, as detailed below, so that techniques, including a.c. impedance, galvanostatic and potentiostatic cycling could be performed.
onto a metal foil (Cu or Al) or glass (for self-supporting disks) using a doctor blade, which allowed the thickness to be set. Disks of 13mm were then cut from the cast films.
Cells were prepared in three different ways, but, all used the same inner workings. The active material was prepared and run as the cathode and a disk of lithium (in excess) was used as the anode. A disk or pellet containing the material under study was separated from the lithium metal electrode by a glass fibre pad (or cell guard pad) soaked in the electrolyte
(normally 1M LiPF6 in ethylene carbonate/dimethyl carbonate). This was
then sealed into a coin cell (National Research Council of Canada) shown in figure 2.13. Three-electrode measurements were carried out using the same electrodes as described above, but with the addition of a lithium metal wire reference electrode in a Teflon cell. The differences between the coin cells and the Teflon cells are shown in figure 2.13. For studies of
the Li/O2 battery, a diffusion cell based on a swagelok design was used,
figure 2.14. Again, lithium metal was used as the electrode and the other electrode consisted of a cast film of active material, carbon and binder. These were separated by a glass fibre pad soaked in electrolyte (1M
LiPF6 in propylene carbonate). The cell was operated in an O2
Figure 2.13 – Diagram showing teflon and coin cells.
Figure 2.14 – Diagram of Swagelok cell. 2
3
5 4
1
6
2
3 4
5
1 current collector
2 active material
3 lithium pellet
4 separator
5 active material
2.11 – AC Impedance
AC impedance was used to investigate the existence of a solid electrolyte interfacial layer on the electrode surface.
In this technique a sinusoidal voltage is applied across the cell and the resulting sinusoidal current is measured. From this the phase difference
(θ) between the current and voltage and the opposition to the flow of
charge (Vmax/Imax), figure 2.15, are extracted as a function of frequency.
The second is similar to resistance in other systems. These two parameters represent the impedance of the cell. Impedance is a vector quantity and points are plotted with the magnitude represented by the length of the line from the origin to the point and the phase difference by the angle from the x-axis, figure 2.16. The data normally exhibits one or
more semi-circles followed by a straight line103.
Figure 2.15 – Diagram of a sinusoidal voltage and current wave.
This method was conducted using a teflon cell on the Biologic macpile II multichannel cycler.
Figure 2.16 – Nyquist plot of an A.C. impedance run.
2.12 – Cell Cycling
Galvanostatic cycling was used extensively in this project and materials were evaluated for performance in rechargeable lithium ion cells by galvanostatic or potentiostatic cycling on either a Biologic macpile II multichannel cycler or a Maccor series 4000 test system at 30°C. All types of cell constructions were tested on the machines.
This involves applying a constant current to the cell and measuring the potential as a function of time. The amount of charge passed per cycle is often recorded in mAh/g. This charge passed, per unit mass of electrode material, is given by equation 2.2. The derivative of the charge with respect to voltage is often plotted with plateaux on load curves appearing as peaks by this method, permitting easier identification of the plateaux.
C = It/m
Equation 2.2 – C= specific charge passed, I = Current, t= time and m = mass.
Potentiostatic cycling involves a constant potential being applied to the
cell and the current being monitored104.
Chapter 3 - TiO
2-B Nanomaterials – Synthesis and
Characterisation
3.1 - Background
Titanate Nanotubes (Na2-xHxTinO2n+1) were first discovered by Kasuga
and his group in 1997 and were made by a simple hydrothermal
synthesis105. This initial work to develop titanate nanotubes generated a
great deal of interest. These nanotubes were initially thought to be
composed of anatase106. However, further study107 made this assumption
look uncertain108. Chen et. al. suggested that these nanotubes may be
formed from H2Ti3O7109. Work by a variety of groups, as well as the
studies reported in chapter seven, have confirmed that these tubes are titanates, although not necessarily H2Ti3O7. As a result of this discovery,
the goal of synthesising nanomaterials with a TiO2 structure was possible.
This opens up a large resultant range of commercially important applications, such as photovoltaic cells, semiconductors and gas-sensors, amongst others110.
It has been known for some time that the layered Na2-xHxTinO2n+1 material
can, by acid treatment, undergo hydrogen ion exchange for sodium ions111. The resulting H2TinO2n+1 material is known to be reduced to form
the fifth polymorph of TiO2, namely, TiO2-B112. We reasoned that a
105 T. Kasuga, M. Hiramatsu, A. Hoson, T. Sekino and K. Niihara, Langmuir, 1998, 14, 3160. 106 T. Kasuga, M. Hiramatsu, A. Hoson, T. Sekino and K. Niihara, Advanced Materials, 1999, 11,
1307.
107 J. Yang, Z. Jin, X. Wang, W. Li, J. Zhang, S. Zhang, X. Guo and Z. Zhang, Journal of the
Chemical Society. Dalton Transactions, 2003, 2003, 3898.
108X. Sun and Y. Li, Chemical European Journal, 2003, 9, 2229
109 Q. Chen, W. Zhou, G. Du and L. Peng, Advanced Materials, 2002, 14,2160.
110 P. Wang, S. Zakeeruddin, J. Moser, M. Nazeerruddin and M. Gratzel, Nature Materials, 2003, 2,
402.
111 T. Feist and P. Davies, Journal of Solid State Chemistry, 1992, 101, 275.
simple post hydrothermal treatment might lead to the first synthesis of
TiO2 nanowires and so it is reported here. Subsequently, anatase
nanotubes have been prepared by hydrolysing TiF4113. However, no
reports of nanotubes with a TiO2 composition have appeared prior to the
present work. We report the first synthesis of TiO2-B nanotubes, by a
simple hydrothermal method and, more recently, we and others114 have
succeeded in preparing anatase nanotubes by a hydrothermal route.
3.2 – Synthesis
The synthesis of titanate and TiO2 nanomaterials is summarised in the
table below (table 3.1). Focussing on the topic of this chapter, the
synthesis of TiO2-B nanowires and nanotubes is described below.
Titanium dioxide (Aldrich, 6g, anatase), sodium hydroxide (4.95g) and
H2O (33ml) were stirred together for one hour. This was then placed in a
hydrothermal bomb and heated for three days at 170°C. This procedure
gave nanowires. To create nanotubes, titanium dioxide (Aldrich, 6g,
anatase), sodium hydroxide (4.2g) and H2O (28ml) were stirred together
for one hour. This was then heated in a hydrothermal bomb for 3 days at
150°C. Both products were then washed in distilled water to remove
residual sodium and stirred in a hydrochloric acid solution (0.01M) to exchange the structural sodium. These materials were then heated for 4
hours at 400°C to give the TiO2-B polymorph (nanowires = 5.7g, 95+%
yield and nanotubes =5.4g, 90+% yield).
Examination of small differences in the above synthesis has illustrated a
few traits that hold for the hydrothermal synthesis of TiO2-B
113 S. Liu, M. Gam, H. Liu, D. Zhang and C. Zeng, Chemistry of Materials, 2002, 14(3), 1391. 114 X.P. Gao, Y. Lan, H.Y. Zhu, J.W. Liu, Y.P. Ge, F. Wu and D.Y. Song, Electrochemistry and Solid
nanomaterials. In the nanowire synthesis, the hydrothermal temperature could be varied to a certain extent, which resulted in the diameter of the
nanowires changing, with 170°C being the optimum temperature to
produce nanowires with the smallest diameter. For the nanotubes, 150°C
had to be used, as otherwise nanowires were created. Pressure is also important in these syntheses. This can be varied by changing the amount of water used. Even small changes in this variable caused the syntheses to be unsuccessful.
In order to create anatase nanotubes or wires, a different final heat
treatment was used, heating at 600°C rather than 400°C, thus resulting in
the formation of anatase rather than TiO2-B. Similar yields were obtained
as for the TiO2-B materials.
Material Volume of
NaOH used. (ml) Hydrothermal Heating Conditions. Heat Treatment. Kasuga’s titanate nanotubesii
33 170°C for 72
hours
None
TiO2-B Nanowires
33 170°C for 72
hours
400°C for 4
hours TiO2-B
Nanotubes
25 150°C for 72
hours
400°C for 4
hours Anatase
Nanowires
33 170°C for 72
hours
600°C for 2
hours Anatase
Nanotubes
25 150°C for 72
hours
600°C for 2
hours