BACHELOR’S THESIS
THE NEEDLE IN THE
HAYSTACK: A
COMPARATIVE
EVALUATION OF NEW
METHODS TO EXTRACT
ELECTRODERMAL
RESPONSES IN APPLIED
SETTINGS
Christian Utzerath (s1002767)
FACULTY OF BEHAVIORAL SCIENCES HUMAN FACTORS AND MEDIA (HFM)
Abstract
In applied settings, experimental control is usually low, whereas inter- and
intra-individual variability in response characteristics is high. In deception, many cognitive
processes that may elicit slow electrodermal responses (EDR) occur at an unknown
timing or may even occur simultaneously. This facilitates superposition of EDR,
making them harder to study. Two recent computational approaches - continuous
decomposition analysis (CDA) and area under the curve (AUC) have been proposed
to extract superposed EDR. They were tested with empirical data from a deception
detection experiment against traditional through-to-peak analysis (TTP). In general,
we hypothesized that tonic and area measures would be more sensitive than phasic
measures.
While AUC appeared to be least sensitive, CDA and TTP indexed deception
with similar sensitivity, although CDA provided a tonic estimate that was most
sensitive. Moreover, within CDA, ISCR (an area measure) was more sensitive than
sum of amplitudes and frequency of NS-SCR. The results thus support the hypothesis
regarding the temporal characteristics of deceptive EDR. With the measures used,
indices of both actual lying and the intention to lie were found, the latter of which was
reliably indexed by CDA tonic activity. Moreover, there were physiological markers
in phasic EDA when subjects switched from intending to lie to actual lying.
Since it is expected that these results translate to similar applications,
recommendations are given on research on electrodermal activity in applied sciences
Samenvatting
In toegepaste onderzoeksomgevingen is er vaak een laak aan experimentele controle
dat gepaard gaat aan hoge inter- en intra-individuele variabiliteit van de verkregen
responsen. In leugendetectie-onderzoek, waarbij electrodermale activiteit (EDA) bij
de polygraaf-test gebruikt wordt, zullen bijvoorbeeld veel cognitieve processen in
onvoorspelbare orde of zelfs tegelijkertijd aflopen. Dit draagt bij aan superpositie van
electrodermale responsen (EDR) waardoor deze harder te detecteren vallen. Nieuwe
computationele modellen – continuous decomposition analysis (CDA) en area under
the curve (AUC) – zijn geïntroduceerd om overlappende EDR te extraheren en
worden in dit onderzoek met empirische data van een leugendetectie-experiment
vergeleken met klassieke through-to-peak analyse (TTP). We verwachtten vooral dat
tonische en oppervlaktematen gevoeliger zouden zijn dan klassieke fasische maten.
Uit de resultaten blijkt dat AUC niet zeer gevoelig was terwijl CDA en TTP
ongeveer vergelijkbaar gevoelig waren, waarbij CDA een zeer gevoelige tonische
maat opleverde. Binnen CDA was ISCR (een oppervlaktemaat) de meest gevoelige
maat. De resultaten steunen dus deels de hypothesen omtrent de temporele
eigenschappen van deceptieve EDR. Er zijn indices van zowel daadwerkelijke
leugens als de intentie om te leugen gevonden. Het laatste werd het meest
betrouwbaar door CDA tonische activiteit geïndexeerd en door fasische maten op het
moment dat proefpersonen de intentie om te leugen in daadwerkelijke leugens
omzetten.
Omdat deze resultaten waarschijnlijk op vergelijkbare settings toepasbaar zijn,
worden aanbevelingen voor electrodermaal onderzoek in het algemeen en
Table of Contents
Introduction ... 2
EDA in applied fields and deception detection ... 2
Electrodermal responses and issues in applied settings ... 3
Earlier solutions for the problem of superposed EDR ... 4
Recent approaches to extract superposed EDR ... 7
In applied field, EDR characteristics favor tonic and area measures ... 8
Testing environment and expectations ... 9
Method ... 10
Participants ... 10
An ecologically valid experimental design in deceit detection ... 10
Procedure of the experiment ... 11
Computational operationalization of the effects of deceit ... 12
Instruments ... 13
Pre-processing and parameters ... 14
Continuous Decomposition and through-to-peak analysis. ... 14
Spontaneous Fluctuations area under the curve. ... 14
Statistical processing ... 14
Results ... 15
Increased cognitive demands manifest in increased electrodermal activity ... 15
Deception effects on EDA ... 15
Comparison of measure sensitivity ... 18
Indices of the intention to deceive ... 19
Distribution and specificity of effects ... 19
Discussion ... 22
Cognitive demands and deception manifest in EDA ... 22
Varying sensitivity of measures and temporal characteristics of deception ... 24
New questions and recommendations ... 25
General conclusion ... 26
Acknowledgements ... 27
References ... 28 Appendix A: Tables and Figures
Introduction
This paper addresses different computational approaches to correct for superposed
responses in electrodermal activity (EDA) in applied contexts. Electrodermal activity has
been studied since the late 19th century. It is thought to reflect sudomotor activity of the sweat
glands (e.g., Benedek and Kaernbach, 2010) and to index activity of the sympathetic nervous
system, or physiological arousal (Dawson et al, 2007; Benedek and Kaernbach, 2010). This
physiological arousal is regarded as potential correlate of a variety of psychological
phenomena such as orienting reflexes, responses to emotional stimuli and cognitive demands
(Dawson et al, 2007). Thus, EDA can be regarded as a rather direct and therefore elegant
measure of physiological arousal.
EDA in applied fields and deception detection
Today, EDA is a prevalent measure in various psychological applications. For
example, researchers try to relate EDA responses to deception. Polygraphs use EDA in an
attempt to detect deception. It is assumed that deception results in increased stress and
cognitive demands, which are reflected by skin conductance (Zuckerman, De Paulo and
Rosenthal, 1981; DePaulo, Lindsay, Malone, Muhlenbruck, Charlton and Cooper, 2003; Vrij,
Ennis et al, 2010). For example, liars have to monitor their own responses as well as the
reactions of the one they are deceiving; they have to select what information to give and what
to withhold (Vrij, 2008, pp. 39-45) and they have to plan their responses far in advance (Vrij,
2008, p. 74). Because cognitive efforts such as information processing and orienting reflexes
manifest in electrodermal responses (EDR; Boucsein, 2012, chap. 3.1.3.1), EDA thus
indirectly measures attempts at deceiving others (Boucsein, 2012, chap. 3.5.2). However, the
sensitivity and specificity of this approach is rather lacking (Vrij, 2008, chap. 11; Wolpe et al,
2005). Studies have shown that the use of mental and physical countermeasures (such as
Honts et al, 1994; Vrij, 2008, pp. 314-5 ). Moreover, if a lie actually produces deviating EDR
depends on several factors, among which are the motivation of the liar and the effort that is
needed to “make up the story” compared to telling the truth (Vrij, Mann & Fisher, 2006;
DePaulo, Kashy, Kirkendo et al, 1996; Vrij, 2008, chap. 3). Despite its possible pitfalls,
techniques for the detection of deception still receive much attention since such technology is
highly relevant to many societies (cf. Wolpe et al, 2005; Vrij, 2008).
Electrodermal responses and issues in applied settings
Typically, EDA is recorded as skin conductance (SC, in µSiemens) by applying a
direct current to the skin via two silver electrodes (exosomatic method). The central concept
of this approach is the electrodermal response (EDR, or skin conductance response: SCR),
which is usually defined as a sharp rise in SC that is followed by a slow recovery.
Psychophysiological research can use the EDR in event-related or evoked paradigms (cf.
Dawson, Schell and Fillion, 2007). In such paradigms, several seconds after a stimulus such
as a noise burst, an EDR occurs that is even visible in the raw data. With enough repetitions, a
statistical relationship between stimulus and EDR can be established. Moreover, both tonic
and phasic activity contribute to EDA. Tonic activity, also referred to as skin conductance
level (SCL), is the rather steady level of arousal and changes only slowly over time. Tonic
activity is usually not characterized by distinct responses to stimuli such as noise burst in
event-related paradigms. Phasic activity, then, refers to skin conductance fluctuations that
deflect from the tonic activity. That is to say, phasic activity is much more closely related to
experimental manipulations in event-related and evoked paradigms than tonic activity. SCR
that can be related to events are specific SCR. SCR are non-specific (NS-SCR) if they cannot
be related to any (observable or controllable) event, and the frequency of these responses in
Often however, evoked and event-related paradigms do no to justice to applied settings.
Cognitive processes that are relevant in applied fields such as deception detection occur with
much intra-individual variability and do not follow an algorithm that can be controlled
experimentally. Instead, one has to assume that the cognitive processes that contribute to the
EDA-signal occur in an unknown temporal order and may even occur simultaneously. For
example, a suspect may at the same time think about his alibi, experience distress, and try to
apply countermeasures. Because of this lack of controllability, deception and similar
processes cannot holistically be studied in an event-related paradigm that presupposes
experimental control. Accordingly, skin conductance responses in such paradigms must be
regarded as non-specific (NS-SCR).
This issue is worsened by the fact that SCR can superpose. When SCRs overlap, they
tend to mask each other (partly). Grings and Schell (1969) note that the degree to which an
EDR is distorted depends on both proximity and amplitude of the previous EDR.
Additionally, even in event-related paradigms, many EDR are non-specific (Dawson, et al,
2007) and may occur spontaneously or as reflection of movement, deep breathing or even
temperature (Boucsein, 2012, chap. 2.3). Thus, EDR can be distorted by previous EDR that
are elicited by the experimental environment, by the subject’s spontaneous autonomous
responses and environmental conditions. Since researchers obviously cannot control
spontaneous responses, it is necessary to estimate and correct for the amount of distortion
caused by superposed EDR. This problem is especially relevant in real-world applications
such as the detection of deceit. Since participants respond rather freely in such environments
their responses cannot be regarded as evoked but must instead be thought of as non-specific.
Earlier solutions for the problem of superposed EDR
The extraction of superposed EDR has received widespread scientific attention.
would inspect the responses visually and then choose the appropriate technique to determine
the properties of the two superposed responses (Boucsein, 2012, pp. 154-5). This technique,
also called through-to-peak analysis (TTP), can be automated by using computer software.
Such software would determine the onset and peak of an EDR by finding samples in the
record where the first derivate of EDA exceeds a given threshold value (e.g., Edelberg, 1967;
Foerster, 1984; Boucsein, 2012, chap. 2.3.1.3). Thom (1988; see also Boucsein, 2012, chap.
2.3.1.3) suggested to take into account the rise time of the EDA signal for evaluating whether
or not an increase in SC signals an electrodermal response. Since the decline of an SCR is
rather slow and gradual, the point where such a response terminates is less clear to determine.
Darrow (1973b; in Boucsein, 2012, chap. 2.3.1.3) proposed to mathematically describe the
decline of n SCR similar to the half-life of isotopes. That is to say, an EDR is considered to
have ended once the SC has arrived at half the peak value. Through-to-peak analysis, even
when one takes into account the abovementioned technical suggestions, suffers from three
problems. First, onset, peak and decline of an EDR are determined by a set of mathematical
rules with limited neurophysiological validity. Second, approaches that model EDR by such
mathematical definitions are likely to be unable to appropriately handle superposed EDR,
since these do not conform to these mathematical definitions. Third, in part because of the
second reason, automated through-to-peak scoring still requires the researcher to control and
asses the responses that the software has found. During the last decades then, approaches have
emerged that aim to eliminate these problems.
Lim et al (1997) proposed to mathematically derive a stereotypical SCR for each
subject. Decomposing SC would yield phasic and tonic parameters for a mathematical model
that could then describe stereotypical SCR for each subject. By fitting these onto the SC data,
researchers could reveal superposed SCR. However, Boucsein (2012, p. 167) argues that SCR
are not generally stereotypical and that a single mathematical model does not account for all
identify each peak during analysis. Despite this drawback and the assumption of stereotypical
EDRs, this method found to increase the amplitude of peaks (Lim et al, 1997) and was further
validated by Lim et al (1999) and Williams et al (2004), where different forms of stimuli
could still be discriminated by the SCRs they elicited, despite short temporal succession.
Alexander et al (2005) were striving to overcome the manual visual inspection needed
in Lim et al (1997) by implementing an automated scoring procedure for SCRs. The authors
hypothesized that the slow EDR are the result of rapid sudomotor nerve bursts. Thus, they
developed an impulse response function (IRF) that was meant to model the actual sudomotor
nerve bursts. From these nerve bursts, the actual EDR could then be reconstructed. Davis et al
(2009) applied this automated procedure in a category learning task and found that SCRs
obtained with this method predicted successful learning even in relatively short
stimulus-response intervals. However, as Benedek and Kaernbach (2010) note, this approach assumes
IRF to be stable or stereotypical, which would be an assumption unsupported by actual data.
Arguing that Lim et al (1997) as well as Alexander et al (2005) make untestable
assumptions about the shape of SCRs, Bach et al (2009) developed a technique that compares
observed to predicted SCR that are obtained by general linear convolution. In their model, an
SCR time series is the output of a Linear Time Invariant (LTI) filter that processes a series of
input impulses (that might stem from experimental events). This reflects the assumption that
distinct sudomotor nerve bursts generates temporally extended electrodermal responses. If the
input functions are weighed with a certain coefficient and then convolved with the response
function, a predicted time series of electrodermal responses can be obtained that ultimately
Recent approaches to extract superposed EDR
Two recent approaches to deal with superposed EDRs have been proposed by Bach,
Friston and Dolan (2010) and Benedek and Kaernbach (2010; 2010a). Bach, Friston et al
(2010) provided an approach to estimate spontaneous fluctuations in skin conductivity. The
authors argue that the time integral of an SC time series consists “of SCL, plus the number of
responses n, scaled by their amplitude a, and multiplied by a constant c” (pp. 52-3). The
constant c reflects a time-invariant response function that reflects the shape of an EDR. A
detailed discussion of this response function is beyond the scope of this thesis (cf. Bach,
Friston and Dolan, 2009). Adding error to the model, the area under an EDR is then described
as ∫SC t (dt) = SCL + cna + e; that is, the area under the response within a time window is
skin conductance level plus the product of, number of responses, their amplitude, and a
response function, plus error. This measure thus integrates the area under the EDR and is
hence called area under the curve (AUC). Bach, Friston et al (2010) validated AUC with
empirical data from an experiment in which participant experienced anxiety due to
anticipating a public speech. According to Bach, Friston et al (2010), their approach provides
a more accurate picture of sudomotor activity than other estimates. However, the authors also
note that although their approach is less noisy than other approaches, spontaneous fluctuations
might not be the best quantification of autonomic arousal for every case. Furthermore, Bach,
Friston et al (2010) assume that the electrodermal responses of interest behave quite
uniformly, which is controversial (e.g. Benedek and Kaernbach, 2010; 2010a; Boucsein,
2012, p. 167). However, because AUC has been validated with empirical data from an
anxiety-experiment with low experimental control and emphasizes the temporal course of
EDR, it may very well be suited for applied contexts and is therefore of interest for this thesis.
Benedek and Kaernbach (2010; 2010a), as mentioned above, criticize the approaches
of Bach et al (2009) and Alexander et al (2005) on the basis that both approaches assume a
argue that this assumption most likely does not hold true. Furthermore, if IRFs were very
slow, these mathematical model would produce a negative driver function – reflecting
implausible “negative” sudomotor activity (Benedek and Kaernbach, 2010; 2010a). By letting
go the idea of stereotypical IRF and instead adjusting them inter-individually, the problem of
“negative sudomotor activity” would be solved. The authors propose to first estimate tonic
EDA (such as SCL) by deconvolution of the SC-data. The tonic EDA would then implicitly
return the phasic activity that underlies the skin conductance data. By means of integrating
these data, the magnitude of a phasic response can be obtained. This method, called
continuous decomposition analysis (CDA), would further “establish a continuous measure
that reflects more closely the original properties of the underlying sympathetic nervous
system activity” (Benedek and Kaernbach, 2010). CDA thus accounts for both tonic and
phasic activity. The authors suggest that their approach is superior to classic through-to-peak
methods and furthermore resembles sudomotor activity more closely than the approach of
Alexander et al. (2005). Moreover, as opposed to the aforementioned approaches, Benedek
and Kaernbach’s (2010; 2010a) approach would be able to analyze differently shaped EDR.
Finally, the authors regard their method as being more easily applicable than other
approaches. For these reasons, continuous decomposition analysis will be included in this
thesis.
In applied field, EDR characteristics favor tonic and area measures
As is explained above, cognitive processes such as deception occur with little
experimental control and much variability, they may occur in close succession or even
simultaneously. Intentionally or unintentionally, interviewees may spread internal processes
that would manifest in EDA (cf .Vrij, 2008, chap. 3). Moreover, even during deception, not
all processes will be deceptive, which makes it important to identify physiological indices of
contribute to EDA cannot be controlled and may overlap, bringing the slow SCR into
superposition. In such cases, slow, consistent changes in arousal may be more characteristic
of the physiological indices of deception than concentrated peaks at distinct moments (cf.
Boucsein, p. 166). For example, Bach, Daunizeau, Kuelzow, Friston and Dolan (2010) and
Boucsein (chap. 3.2.2) state that emotional states such as stress are better characterized by
tonic than by phasic activity. Thus, rather than scoring the amplitude or frequency of
NS-SCR, it might be more advisable to evaluate the area under the SCR and tonic changes in SC.
Therefore, when reviewing the recent approaches, area measures and tonic measures will be
taken into account, too.
Testing environment and expectations
Since EDR superposition is a problem that is especially apparent and prevalent in
applied settings with little experimental control, the various applications of EDA such as
deception detection would greatly benefit from sensitive techniques to extract SCR. In this
thesis, AUC and CDA will be compared to TTP with empirical data from a deception
experiment that let participants respond in a relatively free manner, which is thought to
improve ecological validity.
We expect that as the rationale of deception detection, increased cognitive engagement
will manifest in increased EDA. Moreover, because deception involves such cognitive
demands, deception should result in electrodermal responses as well. Finally, as deception is
likely to involve many overlapping, prolonged and / or simultaneous processes, area or tonic
measures should index these processes more sensitively than the frequency of NS-SCR and
Method
Participants
Originally, 103 participants from the population of the students of the University of
Twente were recruited for the experiment. However, 16 participants’ data were removed for
technical reasons, leaving 87 participants. Their mean age was 21.2 years and 41.4% were
male, reflecting the approximate demographics of the faculty’s subject pool. Participants
were given course credit for the completion of the experiment. Additionally, a prize – 100 and
50€, respectively - was promised to those who would show the weakest physiological
indicators of deceit. This incentive was thought to increase motivation by increasing the
relevance of the deception attempts.
An ecologically valid experimental design in deceit detection
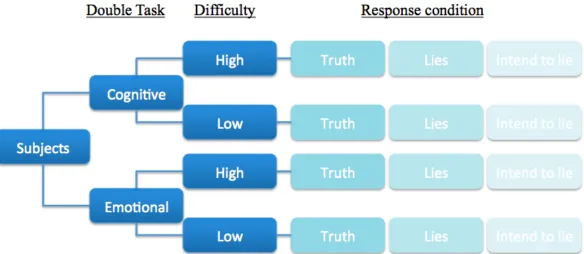
In the experiment, participants had to tell the truth or deceive while performing a
double task. The experimental design contained three factors: the sort of the double task, the
difficulty of the task and the response condition (figure A1).
In all conditions, participants were shown pictures of faces as stimuli and had to
respond verbally to the stimulus features. The demanded response depended on the nature of
the double task: in the emotional task, participants had to evaluate the emotional expression of
the displayed faces. In the cognitive task, participants had to count the number of dots that
were ‘printed’ onto these facial stimuli. The sort of the task was varied between subjects.
Moreover, both double tasks also had a difficult version. The difficult emotional task involved
faces whose expression was ambiguous and therefore hard to evaluate. The difficult cognitive
task required participants to perform arithmetic while reporting on the stimuli. Difficulty was
varied between subjects. It was expected that difficult stimuli would impose more cognitive
load onto the participants and thereby increase the necessary efforts to deceive (cf. Vrij, 2008,
Trials of six stimuli, or trials, constituted a block. During each block, participants had
to either respond truthfully to all six subsequent stimuli (truth condition), untruthfully (lies
condition) to all stimuli, or had to respond truthfully to the first four stimuli and lie about the
last two stimuli (intention to lie). This last condition was included for two reasons: first, it
increases the cognitive load of the participant because he or she has to remember when to tell
the truth or to lie. Second, this condition resembles real-world scenarios, since in reality,
people have to plan ahead in order to successfully deceive others (cf. Vrij, 2008, p. 74). For
example, a criminal has to carefully monitor on which details of a crime he or she has to
deceive the investigators. In other words, the involvement of prospective memory should
make deceiving more difficult and therefore more visible as well as enhance ecological
validity.
Thus, the experiment contained 2x2x3 factors (Task X Difficulty X Condition) and it
is expected that increased cognitive load lead to increased effort when lying, which in turn
should become apparent in stronger EDR (assuming Boucsein 2012, chap. 3.1.1.1).
Stimuli
The stimulus pool consisted of 66 portraits (figure A2). Additional features were
edited onto several faces so that the participants could give more detailed reports. The facial
expressions for the easy emotional double task were derived from Ekman’s universal
emotions (Ekman & Friesen, 1969; Ekman, 1999), whereas the expressions of the difficult
emotional double task were more complex. Both cognitive double tasks used the same stimuli,
but in the difficult version, participants performed additional arithmetic.
Procedure of the experiment
After signing informed consent, each participant was seated comfortably in an isolated
recording equipment and the experimental task was explained. To increase motivation,
participants were told that an expert in lie detection would observe their responses via a
webcam. The experimenter then practiced the task with the participant. When the participant
had mastered the task, the experimenter left the room and the experiment began.
The experiment consisted of 12 blocks with 6 stimuli each. Thus, each participant responded
to a total of 72 stimuli. As stated above, during each block, participants had to either report
truthfully, lie, or plan to lie. The order of blocks varied with three versions of the experiment
to which the participants were randomly assigned. Each trial lasted for 20 seconds that
included stimulus, response and pause (see figure 2.1).
Computational operationalization of the effects of deceit
Because SC was recorded while participants were either telling the truth or deceiving,
knowing what participants actually did is a given. Second, it was argued that deceiving would
manifest itself in a change in electrodermal activity (most likely as a reflection of cognitive
efforts; cf. DePaulo et al, 2003) relative to a baseline. This baseline may be conceived as the
truth condition (since here, there were no additional, deception-related efforts). Therefore, an
effect of deception can be operationalized as the difference in SC between lying and telling
the truth, both of which are empirically known because of the experimental design. On the
[image:15.595.83.504.327.489.2]SC(truth)). Thus, the hypotheses translate to the expectation that subtracting trials with rather
low cognitive load (truth) from trials with high cognitive load (lying) yields a positive value
that can be seen as index or effect of deceit.
Although the amplitude and frequency of NS-SCR are the most common measures in
deceit experiments (Boucsein, 2012, chap. 3.5.2), we argued that because of the possible
intra- and inter-individual variability in deception, area and tonic measures may as well or
even better suited to reflect the psychophysiology of deception. Therefore, these measures
will be subjected to the same logic as mentioned above. That is, the effect of deceit is
operationalized as the difference between a truth and a lying condition for each respective
measure.
Instruments
Skin conductance was measured exodermally using Thought Technology skin
conductance sensors (Thought Technology Ltd., 2012), attached to the distal phalanx of the
right index and ring fingers. The signal was amplified using ProCompInifiniti (Thought
Technology Ltd., 2012). The experiment itself was carried out on desktop PCs using e-Prime
(Psychology Software Tools, 2012) to run the experiment. Since the amplifier did not have a
dedicated interface for e-Prime, analogue experimental markers were created: for each
experimental event, e-Prime sent a signal via the serial port to the ProCompInifiniti amplifier,
which in turn reduced the resistance of the VI-channel. Thus, fluctuations on the VI-channel
marked experimental events.
Pre-processing and statistical analyses were performed using MATLAB (Mathworks,
2012) and SPSS 16 (IBM SPSS, 2012). Continuous Decomposition analysis and automated
through-to-peak analysis were executed using MATLAB custom code from Ledalab
(Benedek & Kaernbach, 2010a) whereas the area under the curve technique was provided by
Pre-processing and parameters
Continuous Decomposition and through-to-peak analysis.
Since we did not use a prevalent setup for recording skin conductance data, we wrote custom
code that converted the recorded skin conductance data into a format that could be processed
by Ledalab. 87 Files were successfully converted. Data were neither transformed nor filtered
because Ledalab requires raw data. In a batch mode operation, these data were subjected to
continuous decomposition analysis and automated through-to-peak analysis (which Ledalab
implemented as scanning the first derivate of SC for signum changes). Because of the large
body of data and to warrant comparability with other approaches, no artifact rejection was
applied. The response window was set from 5 to 15s after stimulus presentation so that
electrodermal activity in the between-trial breaks could not distort the SCR. As a minimum
criterion for SCR, .01 µS was chosen. The parameter optimization iterated 3 times, which is
one above the author’s default recommendation. Moreover, although the authors state that
improvements of results are insignificant above 11Hz, we chose to sample the data at 256Hz
for more fidelity.
Spontaneous Fluctuations area under the curve.
Using MATLAB, skin conductance raw data were extracted from the raw files and imported
into SCRalyze. All trials were then defined as epochs in a separate file, ranging from 5 to 15s
after trial onset. Data were sampled at 256Hz.
Statistical processing
All dependent variables were extracted from the data that Ledalab and SCRalzye
provided. Among the continuous decomposition analysis (CDA)-measures were frequency of
NS-SCR in the event-window (CDA nSCR), the integrated area under the curve of the scr
skin conductance level within the event-window (CDA Tonic). For through-to-peak analysis
(TTP), Ledalab provided the frequency of NS-SCR (TTP nSCR) and the sum of amplitudes
within the event-window (TTPAmpSum). SCRalyze provided the area under the curve
measure for spontaneous fluctuations (AUC).
These dependent variables were extracted by averaging the trial-positions across all six
blocks. For example, the first trials of all lying-blocks were averaged (see figure A3).
Furthermore, means of all conditions were computed. Effects were then obtained by
subtracting the data from the truth condition from the conditions of lying and intending to lie,
respectively (e.g. nSCR-effect of lying = nSCR_Lying – nSCR_Truth). These effects were
computed both for the averaged trials as well as for the whole conditions. Statistical tests were
then performed using SPSS 16.
Results
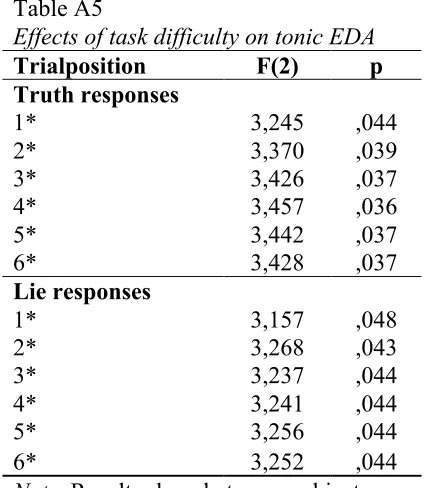
Increased cognitive demands manifest in increased electrodermal activity
We hypothesized that as a basic assumption of physiological deception detection,
increases in cognitive demands would be measurable as increases in EDA. MANOVA with
difficulty and experiment version showed that that cognitive load, operationalized as double
task difficulty, indeed had a significant main effect on tonic EDA (Table A5) on all trial
positions within a block. Thus, the assumption that cognitive activity is associated with
increased electrodermal activity is met.
Deception effects on EDA
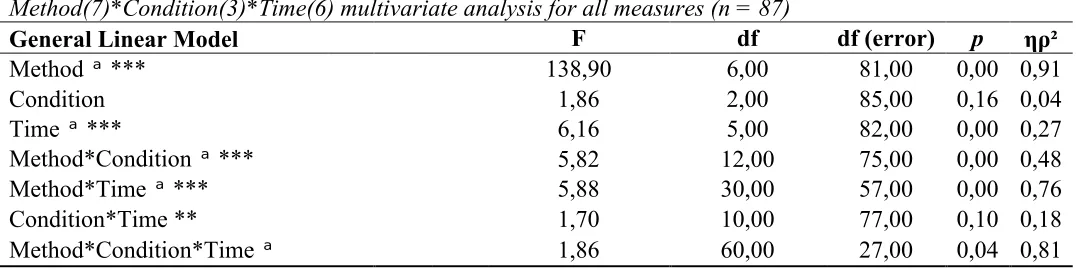
Just as task difficulty, deception effects on EDA were expected. A repeated measures
MANOVA with the factors method(7), condition(3) and time(6) was conducted on
untransformed raw data. Transformations were postponed to a later stage of analysis in order
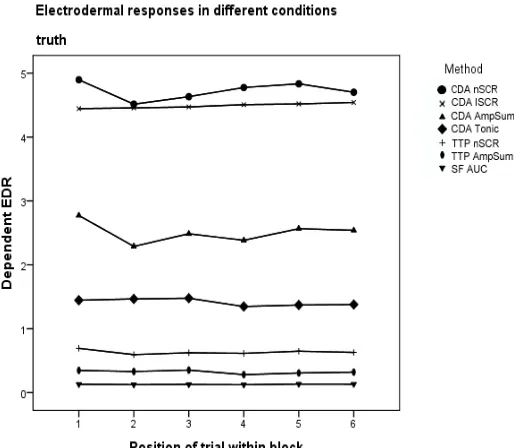
Figure 3.1. The raw data of the truth-condition. As can be seen, different techniques measure different levels. However, the pattern is rather stable, suggesting that this condition can serve as a baseline.
sphericity assumption, Pillai’s Trace values are reported. Significant main effects on EDR
were time (F(5,82) = 6.163, p < .001, ηρ² =.273) and measurement method (F(6,81) = 138.9,
p < .001, ηρ² = .911) but not condition (F(2,85) = 3,143, p = .162, ηρ² = .042). Furthermore,
method*condition (F(12,75) = 5,823, p < .001, ηρ² = .482) and method*time (F(30,57) =
5.881, p < .001, ηρ² = .756) interactions were observed (also refer to Table A1). These results
indicate that different measurement methods generally found different electrodermal
responses and that these further varied with trial positions within a block. Moreover, whether
or not EDR differed from the baseline condition seemed to also depend on the interaction
between method and condition. The physiological indices of deception will later be described
in detail using t-tests.
Figure 3.1 shows the general distribution of the different measures across six
(averaged) trials in the baseline condition (truth); Figure A4 shows how the different
techniques measured different effects per condition. For descriptive statistics on the effects of
deception, refer to Table 3.1. Overall, the interactive patterns found by the MANOVA suggest
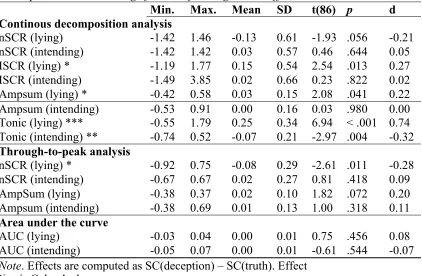
[image:19.595.72.329.497.721.2]T-tests against 0 were performed to test if the measures provided significant
physiological indices of deception. CDA ISCR and CDA AmpSum were both significantly
increased during lying (Table 3.1). CDATonic was not only able to index lying but also the
only measure that indexed the intention to. TTP nSCR was significant when subjects lied. The
effect sizes of the indices varied correspondingly. Note that the number of SCR decreased
during lying and that TTP measured a significant effect on nSCR, whereas CDA did not.
Finally, tonic skin conductance as measured by CDA, too, decreased significantly during the
intention to lie. The tests also showed that AUC did not yield any significant effects of deceit.
Effect sizes of AUC were also small (Table 3.1). Given the differences in significance and
effect size, some measures seem to be more sensitive than others.
Table 3.1
Descriptive statistics and significance of average deceit effects
Min. Max. Mean SD t(86) p d
Continous decomposition analysis
nSCR (lying)
-1.42 1.46 -0.13 0.61 -1.93 .056 -0.21 nSCR (intending) -1.42 1.42 0.03 0.57 0.46 .644 0.05 ISCR (lying) *
-1.19 1.77 0.15 0.54 2.54 .013 0.27 ISCR (intending)
-1.49 3.85 0.02 0.66 0.23 .822 0.02 Ampsum (lying) *
-0.42 0.58 0.03 0.15 2.08 .041 0.22 Ampsum (intending) -0.53 0.91 0.00 0.16 0.03 .980 0.00 Tonic (lying) ***
-0.55 1.79 0.25 0.34 6.94 < .001 0.74 Tonic (intending) **
-0.74 0.52 -0.07 0.21 -2.97 .004 -0.32
Through-to-peak analysis
nSCR (lying) *
-0.92 0.75 -0.08 0.29 -2.61 .011 -0.28 nSCR (intending)
-0.67 0.67 0.02 0.27 0.81 .418 0.09 AmpSum (lying) -0.38 0.37 0.02 0.10 1.82 .072 0.20 Ampsum (intending) -0.38 0.69 0.01 0.13 1.00 .318 0.11
Area under the curve
AUC (lying)
-0.03 0.04 0.00 0.01 0.75 .456 0.08 AUC (intending)
-0.05 0.07 0.00 0.01 -0.61 .544 -0.07
Note. Effects are computed as SC(deception) – SC(truth). Effect Size is Cohen’s d.
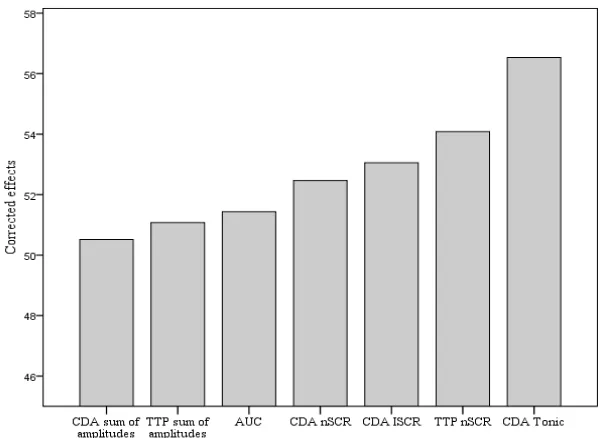
[image:20.595.75.497.401.677.2]Comparison of measure sensitivity
It was expected that some measures would be more sensitive than others. Since the
measures differed regarding their distribution and variance and were therefore not
immediately comparable, mean effects have been standardized across measurement methods
for comparison. Measures that produced negative effects were inverted by multiplication with
-1. All means were then T-transformed to a mean of 50 with a standard deviation of 10. This
procedure yielded an effect sizes that is distributed relative to the measures used in this
analysis. Paired t-tests were used to estimate difference in effect size between methods.
Because there was only one significant index of intentions to lie, only the lying-condition was
included in this comparison. The results indicate that the effects of lying were strongest for
CDA Tonic, with the other measures differing insignificantly from each other (Figure 3.2;
Table 3.2). Thus, it seems that the measures indeed differed in sensitivity.
[image:21.595.54.353.439.658.2]Table 3.2
Selected comparison of effects
Comparison Δ Δ-SD Error t(86) p
CDA Tonic - TTP nSCR * 2.45 10.61 1.14 2.15 0.03 TTP nSCR - AUC * 2.65 11.05 1.18 2.23 0.03 CDA ISCR - CDA AmpSum * 2.54 11.40 1.22 2.07 0.04 AUC - CDA AmpSum * 0.92 3.24 0.35 2.65 0.01
Note. The Table shows selected comparisons between measures along the series of Figure 3.2. Reported are the first significant differences between measures along that series. Because reported data are relative effect size, report of distinct effect sizes
report of distinct effect sizes is omitted.
* p < .05
Indices of the intention to deceive
It was also hypothesized that because of the temporal characteristics of deceiving
others, tonic and / or area measures would be more suited than other measures to index the
intention to lie. It was possible to find some but not many indices of the intention to deceive.
As has been stated earlier, CDA Tonic was generally decreased during blocks when
participants prepared lies (t(86) = -2.968, p < .01; also refer to Figure 3.3 and Table 3.1).
Since Figure A4 suggested that the intention to lie is associated with movements in the data
from trial 3 to trial 4, the difference between these has been tested using a paired t-test.
Significantly changed EDR were found using CDA ISCR (t(86) = -2.02, p <. 05, r2 = .21) and
TTP AmpSum (t(86) = -2.14, p < .05, r2 = .22; also see Table A4). Thus, supporting the
hypothesis, the most sensitive measure for the intention to deceive seems to be tonic EDA.
Distribution and specificity of effects
The distribution of effects was studied by analyzing the frequency distribution of
scores across the sample. Figure 3.3 shows the CDA sum of amplitudes as well as the
estimated tonic activity per trial in the lies and truth condition for one subject. Whereas
stable. Moreover, a steady increase in tonic activity over the course of the experiment can be
seen, which can also be interpreted as an undesirable covariate.
Additional Figures that depict standardized and transformed mean responses for the
whole sample suggest that there is much inter-individual variability in the physiological
responses to deception (Figure A5). That is, the effects seem to vary greatly across the
sample. This impression is supported by the fact that the standard deviation of the effects is
generally larger than the mean effects (Table A2), whereas this is not the case for the raw
data. Thus, the distribution of effects indicates that these effects did not occur consistently and
reliably.
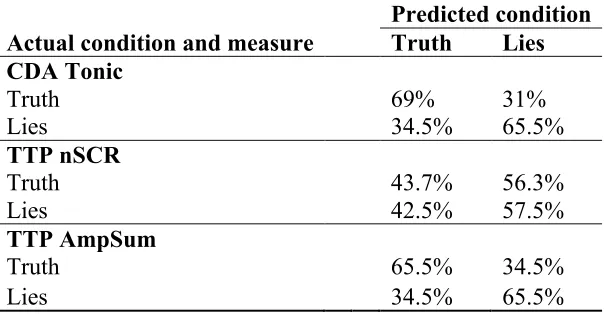
The two traditional measures TTP nSCR, TTP sum of amplitudes as well the measure
with the strongest effect size, CDA Tonic, were tested for specificity in deception detection.
Specificity was calculated by determining what proportion of the sample, in a given condition,
would be classified as belong to another condition if the obtained group effects were handled
as criterion (Table 3.3). Because neither TTP nSCR nor TTP sum of amplitudes could obtain
an index for the intention to lie, only the truth- and lying conditions were included. Whereas
TTP nSCR is biased towards classifying participants as lying, both CDA Tonic and TTP
AmpSum perform better than chance, although not impressively so. Overall, these results
might support the hypothesis that tonic EDA provided a more suitable index for the detection
Table 3.3
Specificity of selected measures
Actual condition and measure
Predicted condition Truth Lies CDA Tonic
Truth
69% 31%
Lies 34.5% 65.5%
TTP nSCR
Truth
43.7% 56.3%
Lies 42.5% 57.5%
TTP AmpSum
Truth
65.5% 34.5%
[image:24.595.92.394.615.772.2]Lies 34.5% 65.5%
Discussion
Cognitive demands and deception manifest in EDA
The premise of deception detection is that deception involves increased cognitive
demands and arousal that manifest in EDA (e.g. Zuckerman et al, 1981; DePaulo et al, 2003).
We found that increases in cognitive load, operationalized as differences in difficulty, were
related to increases in tonic activity. Furthermore, independent of difficulty, there were,
among others, moderate to strong effects of lying on tonic activity. Therefore, it seems
reasonably defendable that in this experiment, deception was indexed by measured
physiological responses.
Several effects of deception could be identified by comparing EDR when participants
told the truth or deceived. For lying, significant deflections from baseline were found for
CDA ISCR, CDA sum of amplitudes, CDA Tonic, and TTP nSCR. SF AUC did not reach
significance. Effect sizes were distributed correspondingly and ranged from weak to almost
strong in the case of CDA Tonic.
Whereas tonic activity increased strongly during lying, effects on nSCR/NS-SCR were
negative. This is unexpected and not accounted for by the literature (Boucsein, 2012, chap.
3.5.2), where deception is linked to an increase in EDR in mock crime experiments. This
pattern can have several reasons. While increases in tonic activity could reflect enhanced
information processing (Boucsein, 2012, p. 316-24), this does not explain decreases in phasic
activity. Technically, increases in phasic EDA such as NS-SCR may have been masked by
increases in tonic activity. Similarly, EDR could have been so strongly superimposed that
they appeared as increases in tonic activity. Moreover, it is possible that the chosen
event-windows (5 to 15s after trial onset) missed the onset of the electrodermal response and
therefore, phasic activity might have been misclassified as tonic activity. However, other
habituation (cf. Boucsein, 2012, p. 324) is an unlikely cause because this should then have a
global effect on measures, which is not the case. All of these tentative explanations remain out
of the scope of this research and in the domain of future research.
During intending to lie, tonic activity was significantly decreased, which has been
found in earlier mock crime experiments (Leal, Vrij and Fisher, 2008). While other indices
had insignificant mean effects, significant decreases in CDA ISCR and TTP sum of
amplitudes could be observed when participants were switching from truth-telling to lying.
On the one hand, it is possible that this EDA-decrease reflects a sudden drop in cognitive load
and/or prospective memory as well as associated stress, because participants did not have to
plan ahead anymore (cf. Vrij, chap. 3). On the other hand, Leal et al (2008) found that
cognitive demands could reduce tonic arousal and suspected that tonic arousal suppression
may be a reflection of executive functioning. While the causal mechanisms behind this pattern
cannot exhaustively be explained with the present data, their existence should be an
encouragement for other research to investigate electrodermal indices of deceptive intentions.
Overall, the data suggest that there are physiological indices both of actual and
intended deception. However, the practical use of these indices is limited since the great
variability of effects undermines their specificity. Therefore, group effects should not be used
as a criterion to classify individual responses as either truthful or deceptive. Artifact rejection,
transformation procedures and inter-individual effect adjustments were omitted as far as
possible during the course of our analysis in order to achieve high degrees of standardization
and comparability among methods. It is to be expected that since such steps reduce unwanted
variability significantly (e.g., Boucsein, chap. 2.3.3.4), they would also increase the
specificity and predictive validity of the obtained effects. Future research should test this
Varying sensitivity of measures and temporal characteristics of deception
It was expected that deception may involve prolonged cognitive processes that have
temporal characteristics that rather manifest in tonic than phasic activity. Consequently then,
different measures should vary in sensitivity. The fact that tonic activity, as estimated by
CDA, was the most sensitive measure shows that deception may in fact be an activity that is
characterized by slow and steady changes in SC. Similarly, ISCR, an area measure, was the
most sensitive phasic measure provided by CDA. This supports the hypothesis that deception
is a process that is characterized by a large degree of internal variability that would be
considered ‘noise’ if specific, phasic SC peaks were taken as its only index. If this is correct,
then these results should translate well to other settings where similar responses occur.
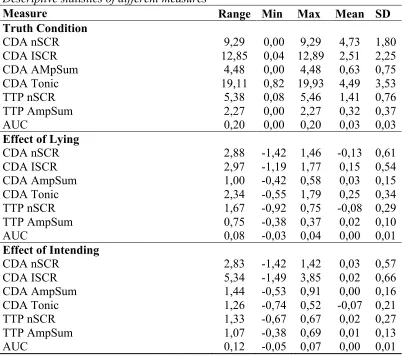
Surprisingly, AUC for spontaneous fluctuations was relatively insensitive, compared
to ISCR and tonic activity (table A2). Both AUC and ISCR integrate the area under SCR,
while AUC in particular assumes these to be resulting from spontaneous fluctuations. Either
the differences between AUC and ISCR result from different technical and theoretical
backgrounds, or spontaneous fluctuations are not a suitable dependent measures in the first
place. This question lies beyond the scope of this thesis.
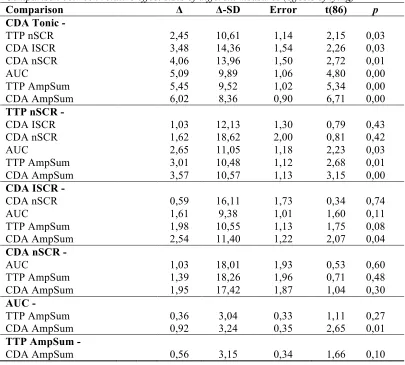
Comparisons across methods with standardized, transformed data revealed that CDA
Tonic had the strongest effect size, followed by TTP nSCR. Then, in descending order of
effect size, came CDA ISCR, CDA nSCR, AUC, TTP and CDA sum of amplitudes. When
nSCR and sum of amplitudes of both CDA and TTP were compared with raw data, no
significant difference was observed. This suggests that for classical phasic measures (NS-SCR
and sum of amplitudes), CDA was not more sensitive than TTP. But since TTP did not
provide a comparable tonic estimate, we are unable to know whether CDA Tonic’s superior
sensitivity exists due to CDA providing better tonic estimates, or due to tonic estimates being
CDA, but tonic measures were even more sensitive than phasic measures – which would
further support our expectations. Thus, what can then be concluded is that CDA is not
necessarily better than TTP and that the increased sensitivity of CDA Tonic may have been
caused by the temporal characteristics of the measured response. For a final evaluation, CDA
Tonic should be compared with a TTP-derived tonic estimate.
The sensitivity comparison among measures that has been made here, is valuable for
other applied research as well. Among the fields of study that profit from such information,
are clinical settings (e.g. Picard, 2009; Hirstein, Iversen and Ramachandran, 2001),
psychophysiology in traffic (e.g., Healeay and Picard, 2005; Engström, Johansson and
Östlund, 2005), or social interaction between humans (el-Sheikh, Ballard and Cummings,
1994; Bethel, Member, Salomon, Murphy and Burke, 2007). Given that researchers in these
fields often measure responses that have characteristics that are similar to those in this
deception detection experiment, it is likely that our methodological considerations and the
results of our analysis generalize to these areas. This expectation requires empirical testing.
New questions and recommendations
This thesis has generated several new research questions. First, we found that the
deceptive intention was indexed by a decrease in tonic EDA (cf. Leal et al, 2008). Future
research should further isolate this index and the mechanisms that cause it. Second, our
custom code did not offer a way to compare tonic activity estimated by CDA to tonic activity
estimated by TTP. To complete the evaluation of CDA and TTP, such a comparison would be
very informative. Third, although it is likely that our results are generalizable to other data
with similar response characteristics, this expectations must be put to the test.
Fourth, besides CDA and AUC, there is another approach to analyze skin conductance
2010a) is a technique that uses neurophysiological assumptions to infer sudomotor activity
from observed skin conductance. Then, EDR, which are pre-supposed to be formed rather
uniformly, are placed at the sudomotor nerve bursts. Although the assumption of uniform
EDR has been criticized (Bach et al, 2012, p. 167; Benedek and Kaernbach, 2010), DCM has
been used to account for spontaneous fluctuations (Bach, Daunizeau, et al, 2010) as well as
anticipatory responses (Bach, Daunieau et al, 2010a). Because DCM relies on complex
assumptions and requires vast processing power, it has remained out of the scope of this
thesis. However, the technique performed favorably when validated with empirical data
(Bach, Daunizeau et al, 2010; 2010a) and should thus be tested in future research.
In this research, transformations, filtering and other manipulations were omitted in order
to retain a high degree of standardizations across methods. Similarly, effects have not been
adjusted for inter-individual differences between participants. Finally, figure 3.3 suggests that
time may act as a covariate on tonic EDA; time should thus be controlled for. Any researcher
who wants to use the compared computational approaches is encouraged to take these steps in
order reduce variance and thereby increase sensitivity and specificity (cf. Boucsein, 2012,
chap. 2.3.3.3-4).
General conclusion
This research evaluated several computational approaches to quantify autonomic
arousal in applied settings, where there is low experimental control, while responses are often
non-specific and have a high likelihood of superposition. In particular, we expected that tonic
and area measures would be the most sensitive in such an applied setting and tested this
hypothesis with a dataset from a deception experiment.
As was hypothesized, we were able to show that EDA was influenced by cognitive
compared techniques indeed provided several indices of deception, which varied in
sensitivity. The most sensitive index for deception, both intended and actual, was tonic
activity, which is in accordance with our hypothesis. AUC, however, was not more sensitive
than phasic activity measures. Besides tonic activity as estimated by CDA, we could not show
that CDA is generally better than TTP; the data suggest that phasic activity is better estimated
by TTP.
Taken as a premise that many other applied settings may have similar response
characteristics as deception as is outlined in the introduction, we conclude that our results will
likely generalize to these responses and settings as well. However, since this premise cannot
be verified a priori, further supporting evidence is needed to draw this conclusion.
Acknowledgements
The author would like to thank Marije Hogeboom who conducted the original experiment and
References
Alexander, D. M., Trengove, C., Johnston, P., Cooper, T., August, J. P., & Gordon, E. (2005). Separating individual skin condoctance responses in short interstimulus-interval
paradigm. Journal of Neuroscience Methods, 146, 116-123. doi:10.1016/j.jneumeth.2005.02.001
Bach, D R, Flandin, G., Friston, K. J., & Dolan, R. J. (2009). Time-series analysis for rapid event-related skin conductance responses. Journal of Neuroscience Methods, 184, 224-234. doi:10.1016/j.jneumeth.2009.08.005
Bach, Dominik R, Daunizeau, J., Friston, K. J., & Dolan, R. J. (2010). Dynamic causal modelling of anticipatory skin conductance responses. Biological psychology, 85(1), 163-70. Elsevier B.V. doi:10.1016/j.biopsycho.2010.06.007
Bach, Dominik R, Daunizeau, J., Kuelzow, N., Friston, K. J., & Dolan, R. J. (2010). Dynamic causal modeling of spontaneous fluctuations in skin conductance. Psychophysiology, 48, 252-257. doi:10.1111/j.1469-8986.2010.01052.x
Bach, Dominik R, Friston, K. J., & Dolan, R. J. (2010). Analytic measures for quantification of arousal from spontaneous skin conductance fluctuations. International journal of psychophysiology: official journal of the International Organization of
Psychophysiology, 76(1), 52-5. Elsevier B.V. doi:10.1016/j.ijpsycho.2010.01.011
Barry, R. J., Feldmann, S., Gordon, E., Cocker, K. I., & Rennie, C. (1993). Elicitation and habituation of the electrodermal orienting response in a shortstimulus interbal paradigm.
International Journal of Psychophysiology, 15, 247-253.
Ben-Shakhar, G., & Dolev, K. (1996). Psychophysiological Detection Through the Guilty Knowledge-Technique: Effects of Mental Countermeasures. Journal of Applied Psychology, 81(3), 273-281.
Benedek, M., & Kaernbach, C. (2010). Decomposition of skin conductance data by means of nonnegative deconvolution. Psychophysiology, 47, 647-658.
doi:10.1111/j.1469-8986.2009.00972.x
Benedek, M., & Kaernbach, C. (2010). A continuous measure of phasic electrodermal activity. Journal of Neuroscience Methods, 190, 80-91.
doi:10.1016/j.jneumeth.2010.04.028
Bethel, C. L., Member, S., Salomon, K., Murphy, R. R., & Burke, J. L. (2007). Survey of Psychophysiology Measurements Applied to Human-Robot Interaction. 16th IEEE International Conference on Robot & Human Interactive Communication (pp. 732-737). Jeju, Korea.
Darrow, C. W. (1937). The equation of the galvanic skin reflex curve: I. The dynamics of reaction in relation to excitation-background. Journal of General Psychology, 16, 285-309.
Davis, T., Love, B. C., & Maddox, W. T. (2009). Anticipatory emotions in decision tasks: Covert markers of value or attentional processes? Cognition, 112, 195-200.
doi:10.1016/j.cognition.2009.04.002
Dawson, M. E., Schell, A. M., & Filion, D. L. (2007). The electrodermal system. In J.
Cacioppo, L. G. Tassinary, & G. G. Berntson (Eds.), Handbook of psychophysiology (pp. 159-181). Cambridge: University Press.
DePaulo, B M, Kashy, D. a, Kirkendol, S. E., Wyer, M. M., & Epstein, J. a. (1996). Lying in everyday life. Journal of personality and social psychology, 70(5), 979-95. Retrieved from http://www.ncbi.nlm.nih.gov/pubmed/8656340
DePaulo, Bella M., Lindsay, J. J., Malone, B. E., Muhlenbruck, L., Charlton, K., & Cooper, H. (2003). Cues to deception. Psychological Bulletin, 129(1), 74-118. doi:10.1037/0033-2909.129.1.74
Edelberg, R. (1967). Electrical properties of the skin. In C. C. Brown (Ed.), Methods in psychophysiology (pp. 1-53). Baltimore: Williams & Wilkins.
Ekman, P., & Friesen, W. V. (1969). The repertoire of nonverbal behavior: Categories, origins, usage, and coding. Semiotica, 1, 49-98.
Ekman, Paul. (1999). Basic Emotions. In T. Dalgleish & M. Power (Eds.), Handbook of Cognition and Emotion (pp. 45-60). Sussex: John Wiley & Sons.
el-Sheikh, M., Ballard, M., & Cummings, E. M. (1994). Individual differences in preschoolers’ physiological and verbal responses to videotaped angry interactions.
Journal of abnormal child psychology, 22(3), 303-20. Retrieved from http://www.ncbi.nlm.nih.gov/pubmed/8064035
Engström, J., Johansson, E., & Östlund, J. (2005). Effects of visual and cognitive load in real and simulated motorway driving. Transportation Research Part F: Traffic Psychology and Behaviour, 8(2), 97-120. doi:10.1016/j.trf.2005.04.012
Foerster, F. (1984). Computerprogramme zur Biosignalanalyse. Berlin: Springer.
Grins, W. W., & Schell, A. M. (1969). Magnitude of electrodermal response to a standard stimulus as a function of intensity and proximity of a prior stimulus. Journal of Comparative and Physiological Psychology, 67(1), 77-82. doi:10.1037/h0026651
Healey, J. a., & Picard, R. W. (2005). Detecting Stress During Real-World Driving Tasks Using Physiological Sensors. IEEE Transactions on Intelligent Transportation Systems,
6(2), 156-166. doi:10.1109/TITS.2005.848368
Hirstein, W., Iversen, P., & Ramachandran, V. S. (2001). Autonomic responses of autistic children to people and objects. Proceedings. Biological Sciences / The Royal Society,
Honts, C. R., & Kircher, J. C. (1994). Mental and physical countermeasures reduce the accuracy of polygraph tests. Journal of Applied Psychology, 79(2), 252-259. doi:10.1037/0021-9010.79.2.252
IBM SPSS. (2012). IBM SPSS software. Retrieved from http://www-01.ibm.com/software/analytics/spss/
Leal, S., Vrij, A., Fisher, R. P., & van Hooff, H. (2008). The time of the crime: cognitively induced tonic arousal suppression when lying in a free recall context. Acta psychologica,
129(1), 1-7. doi:10.1016/j.actpsy.2008.03.015
Lim, C. L., Gordon, E., Rennie, C., Wright, J. J., Bahramali, H., Li, W. M., Clouston, P., et al. (1999). Dynamics of SCR, EEG, and ERP activity in an oddball paradigm with short interstimulus intervals. Psychophysiology, 36, 543-551.
Lim, C. L., Rennie, C., Barry, R. J., Bahramali, H., Lazzaro, I., Manor, B., & Gordon, E. (1997). Decomposing skin conductance into tonic and phasic components. International Journal of Psychophysiology, 25, 97-109.
Mathworks. (2012). Mathworks. Retrieved from http://www.mathworks.com
Paulhus, D. L., & Williams, K. M. (2002). The Dark Triad of personality: Narcissism, Machiavellianism, and psychopathy. Journal of Research in Personality, 36, 556-563.
Picard, Rosalind W. (2009). Future affective technology for autism and emotion
communication. Philosophical transactions of the Royal Society of London. Series B, Biological sciences, 364(1535), 3575-84. doi:10.1098/rstb.2009.0143
Psychology Software Tools, Inc. (2012). Psychology Software Tools. Retrieved from http://www.pstnet.com/
Thom, E. (1988). Die Hamburger EDA-Auswertung. Appendix. In W. Boucsein (Ed.),
Elektrodermale Aktiviät. Grundlagen, Methoden und Anwendungen (pp. 501-514). Berlin: Springer.
Thought Technology, Ltd. (2012). Thought Technology, Ltd. Retrieved from http://www.thoughttechnology.com/
Vrij, A. (2008). Detecting Lies and Deceit. Pitfalls and Opportunities (2nd ed.). West Sussex: John Wiley & Sons, Ltd.
Vrij, Aldert, Ennis, E., Farman, S., & Mann, S. (2010). People ’ s Perceptions of Their Truthful and Deceptive Interactions in Daily Life. Open Access Journal of Forensic Psychology, 6-49.
Wallisch, P., Lusignan, M., Benayoun, M., Baker, T. I., Dickey, A. S., & Hatsopoulos, N. G. (2009). Matlab for Neuroscientists. An Introduction to Scientific Computing in Matlab. Burlington: Academic Press.
Williams, L. M., Brown, K. J., Das, P., Boucsein, W., Sokolov, E. N., Brammer, M. J., Olivieri, G., et al. (2004). The dynamics of cortico-amygdala and autonomic activity over the experimental time course of fear perception. Cognitive Brain Research, 21, 114-123. doi:10.1016/j.cogbrainres.2004.06.005
Wolpe, P. R., Foster, K. R., & Langleben, D. D. (2005). Emerging Neurotechnologies for Lie-Detection: Promises and Perils. The American Journal of Bioethics, 5(2), 39-49.
doi:10.1080/15265160590923367
Zuckerman, M., De Paulo, B. M., & Rosenthal, R. (1981). Verbal and nonverbal
Appendix A: Tables and Figures
Table A1
Method(7)*Condition(3)*Time(6) multivariate analysis for all measures (n = 87)
General Linear Model F df df (error) p ηρ²
Method ᵃ *** 138,90 6,00 81,00 0,00 0,91
Condition 1,86 2,00 85,00 0,16 0,04
Time ᵃ *** 6,16 5,00 82,00 0,00 0,27
Method*Condition ᵃ *** 5,82 12,00 75,00 0,00 0,48 Method*Time ᵃ *** 5,88 30,00 57,00 0,00 0,76 Condition*Time ** 1,70 10,00 77,00 0,10 0,18 Method*Condition*Time ᵃ 1,86 60,00 27,00 0,04 0,81
Note. Because most factors violate the Sphericity assumption, Pillai's Trace
values are reported. The factor time refers to trial positions within blocks of stimuli.
hp2 = SSbetween / SStotal + SSerror
ᵃ this factor violates Sphericity
Table A2
Descriptive statistics of different measures
Measure Range Min Max Mean SD
Truth Condition
CDA nSCR 9,29 0,00 9,29 4,73 1,80 CDA ISCR 12,85 0,04 12,89 2,51 2,25 CDA AMpSum 4,48 0,00 4,48 0,63 0,75 CDA Tonic 19,11 0,82 19,93 4,49 3,53 TTP nSCR 5,38 0,08 5,46 1,41 0,76 TTP AmpSum 2,27 0,00 2,27 0,32 0,37 AUC 0,20 0,00 0,20 0,03 0,03
Effect of Lying
CDA nSCR 2,88 -1,42 1,46 -0,13 0,61 CDA ISCR 2,97 -1,19 1,77 0,15 0,54 CDA AmpSum 1,00 -0,42 0,58 0,03 0,15 CDA Tonic 2,34 -0,55 1,79 0,25 0,34 TTP nSCR 1,67 -0,92 0,75 -0,08 0,29 TTP AmpSum 0,75 -0,38 0,37 0,02 0,10 AUC 0,08 -0,03 0,04 0,00 0,01
Effect of Intending
Table A3
Comparison between relative effect sizes of different measures (effects of lying)
Comparison Δ Δ-SD Error t(86) p
CDA Tonic -
TTP nSCR 2,45 10,61 1,14 2,15 0,03
CDA ISCR 3,48 14,36 1,54 2,26 0,03
CDA nSCR 4,06 13,96 1,50 2,72 0,01
AUC 5,09 9,89 1,06 4,80 0,00
TTP AmpSum 5,45 9,52 1,02 5,34 0,00
CDA AmpSum 6,02 8,36 0,90 6,71 0,00
TTP nSCR -
CDA ISCR 1,03 12,13 1,30 0,79 0,43
CDA nSCR 1,62 18,62 2,00 0,81 0,42
AUC 2,65 11,05 1,18 2,23 0,03
TTP AmpSum 3,01 10,48 1,12 2,68 0,01
CDA AmpSum 3,57 10,57 1,13 3,15 0,00
CDA ISCR -
CDA nSCR 0,59 16,11 1,73 0,34 0,74
AUC 1,61 9,38 1,01 1,60 0,11
TTP AmpSum 1,98 10,55 1,13 1,75 0,08
CDA AmpSum 2,54 11,40 1,22 2,07 0,04
CDA nSCR -
AUC 1,03 18,01 1,93 0,53 0,60
TTP AmpSum 1,39 18,26 1,96 0,71 0,48
CDA AmpSum 1,95 17,42 1,87 1,04 0,30
AUC -
TTP AmpSum 0,36 3,04 0,33 1,11 0,27
CDA AmpSum 0,92 3,24 0,35 2,65 0,01
TTP AmpSum -
Table A4
Changes between trial 3 and trial 4 when participants intended to lie (n = 87).
t-test for equality of means
95% CI
Δ Δ-SD t(86) p r² Lower Upper
CDA_nSCR -0,30 1,91 -1,45 0,151 0,15 -0,70 0,11 CDA_ISCR * -0,37 1,72 -2,02 0,047 0,21 -0,74 0,00 TTP_Tonic 0,01 0,07 0,72 0,477 0,08 -0,01 0,02 TTP_AmpSum * -0,05 0,24 -2,14 0,036 0,22 -0,10 0,00
Note. CDA_Tonic is not significant because CDA_Tonic is decreased during the whole condition condition of intending to lie. Therefore, no changes between trial 3 and 4 are observed.
R² was computed as SQRT(t²/(t²+df)).
Table A5
Effects of task difficulty on tonic EDA
Trialposition F(2) p
Truth responses
1* 3,245 ,044
2* 3,370 ,039
3* 3,426 ,037
4* 3,457 ,036
5* 3,442 ,037
6* 3,428 ,037
Lie responses
1* 3,157 ,048
2* 3,268 ,043
3* 3,237 ,044
4* 3,241 ,044
5* 3,256 ,044
6* 3,252 ,044
Note. Results show between-subjects effects of task difficulty in MANOVA. While there were only two conditions, there are two degrees of freedom because
several participants lacked records but were still included in the analysis.
Figure A2. In all versions of the experiment, participants had to report on the features of the stimuli. In the easy cognitive version, participants counted the dots on the faces (left hand), whereas in the difficult cognitive version, they performed arithmetic while reporting. In the emotional versions, participants had to evaluate the facial expression of the stimuli, which could either be unambiguous (central; easy) or