MR of the Normal Neonatal Brain: Assessment
of Deep Structures
A. James Barkovich
BACKGROUND AND PURPOSE:MR imaging is a powerful tool for studying the anatomy of and the developmental changes that occur in the brain. The purpose of this project was to determine which structures can be distinguished on standard spin-echo MR sequences of a normal neonatal brain and with what frequency they can be identified.
METHODS:The T1- and T2-weighted spin-echo MR images of 12 term neonates, all of whom had normal neonatal courses and were neurologically and developmentally normal at age 12 months, were reviewed retrospectively. All structures that differed in signal intensity from unmyelinated gray matter and unmyelinated white matter were recorded.
RESULTS: In general, myelinated gray matter structures, such as cranial nerve nuclei and other nuclei of the brain stem and deep cerebrum, were the structures best seen on T2-weighted images. Most of these nuclei were seen in 75% to 100% of our subjects on T2-weighted images. They were seen less well on T1-weighted images. Myelinated white matter structures, particu-larly axonal tracts, were the structures best seen on T1-weighted images. The medial and lateral lemnisci, median longitudinal fasciculus, optic tracts, superior and inferior cerebellar pe-duncles, and the posterior limbs of the internal capsules were seen in 75% to 100% of our subjects on T1-weighted images. Except for the posterior limbs of the internal capsules, these structures were seen less well on T2-weighted images.
CONCLUSION:A large number of small structures, such as the nuclei of the brain stem and deep cerebral nuclei, can be routinely identified on standard spin-echo MR imaging sequences. A knowledge of these structures is essential to proper interpretation of imaging studies in neonates and infants.
During the past 10 years, MR imaging has been an extremely useful tool in the assessment of the neona-tal brain (1–16). Since the time of the initial studies, significant advances have been achieved in the quality of MR images obtained on standard commercially available MR scanners, yet no attempts have been made to reassess the ability of MR imaging to detect small structures within the neonatal brain and, par-ticularly, within the brain stem. Since cranial neurop-athies are a common indication for MR imaging in neonates, a knowledge of the normal MR appearance of the neonatal brain stem is crucial.
As a result of an ongoing study of neonates with intrapartum difficulties, we have had the opportunity to perform high-quality MR examinations of the brain on 12 infants who had normal postdelivery
neo-natal courses and normal neurologic and develop-mental examinations at age 12 months. The analysis of these MR studies form the basis for this report.
Methods
During the course of a prospective study analyzing the im-aging findings in neonates who suffered distress during birth, 12 patients were identified who had normal findings on MR studies, normal neonatal courses, normal results of neurologic examinations at 3 and 12 months, and normal cognition and development (as determined by the Bayley Scores of Infant Development II [17]) at age 12 months. These patients com-posed the cohort for this study.
The 12 patients were born after gestation periods of 38 to 40 weeks (mean, 39 weeks). The MR studies were performed at ages ranging from 1 day to 7 days after birth (mean age, 4 days; median age, 4 days). The MR imaging sequences reviewed for this study consisted of two sequences. A standard spin-echo T1-weighted sequence was acquired with imaging parameters of 500/11/2 (TR/TE/excitations). Section thickness was 4 mm (1-mm gap), with an 18-cm field of view, and a 256 3192 imaging matrix. A standard spin-echo T2-weighted sequence used imaging parameters of 3000/120/1, with a 4-mm section thickness and a 2-mm gap. All other parameters were the same as for the T1-weighted sequence.
The MR examinations were analyzed in an attempt to record all structures with signal intensity differing from unmy-Received January 20, 1998; accepted after revision April 2.
Supported in part by NIH grant P50 NS35902 and by NIH grant M01RR01271, the Pediatric Clinical Research Center.
From the Department of Radiology/Section of Neuroradiology, Box 0628, L371, University of California, San Francisco, 505 Par-nassus Ave, San Francisco, CA 94143. Address reprint requests to A. James Barkovich, MD.
©American Society of Neuroradiology
elinated white matter or gray matter in the brain on both the T1- and T2-weighted images. Thus, all white matter foci that were hyperintense relative to unmyelinated white matter on T1-weighted images and hypointense relative to unmyelinated white matter on the T2-weighted images were distinguished. Similarly, gray matter foci that were of higher signal than unmyelinated cortex on T1-weighted images and of lower sig-nal than unmyelinated cortex on T2-weighted images were also recorded. These structures were then identified by consulting a neuroanatomy textbook and recorded on a chart. After the imaging studies of all 12 patients were analyzed, the frequency with which each structure was identified was assessed.
Results
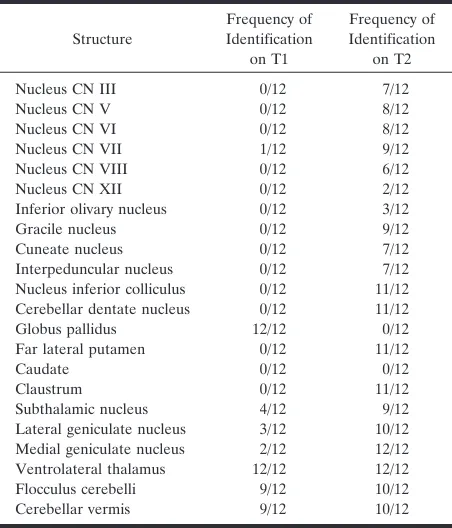
The structures identified on T1-weighted images were mostly white matter tracts, and the structures identified on T2-weighted images were primarily gray matter structures (nuclei). The structures and the frequency with which they were detected are listed in Tables 1 and 2.
Medulla
On T1-weighted images, the most commonly iden-tified structures were the median longitudinal fascic-ulus, the inferior cerebellar peduncles, and the medial lemniscus (Fig 1A). The decussation of the medial lemnisci, the spinal tract of the fifth cranial nerve, and the cuneate and gracile fasciculi were each identified in 25% of patients.
On T2-weighted images, the gracile and cuneate nuclei were identified in most patients (Fig 2A). The vestibular nuclei (Fig 2B and C) and inferior
cerebel-lar peduncles (Fig 2B) were identified in about half the patients. The hypoglossal nuclei, the inferior oli-vary nuclei, the medial lemnisci, and the median lon-gitudinal fasciculi were identified in 25% of patients or fewer.
Pons
On T1-weighted images through the pons, the me-dial lemnisci and superior cerebellar peduncles were essentially always seen (Fig 1B). The lateral lemnisci and the median longitudinal fasciculi were usually seen. The fascicles of the fifth cranial nerves were sometimes seen coursing through the pons (Fig 1B). On T2-weighted images, the nuclei of the fifth, sixth, and seventh cranial nerves were identified in most subjects (Fig 2D). The superior cerebellar peduncles, the medial and lateral lemnisci, and the medial longitudinal fasciculi were seen as discrete structures in 25% to 50% of subjects (Fig 2E); it was more common to see a nondiscrete blur of low intensity, consisting of the medial and lateral lem-nisci, the axons of the superior cerebellar peduncles, and the median longitudinal fasciculus in the dorsal upper pons.
Midbrain
On T1-weighted images through the midbrain, high signal from the decussation of the superior cerebellar peduncles, with possibly some contribution from the third nerve nuclei, was commonly identified (Fig 1C),
Nucleus inferior colliculus 0/12 11/12 Cerebellar dentate nucleus 0/12 11/12 Globus pallidus 12/12 0/12 Far lateral putamen 0/12 11/12
Caudate 0/12 0/12
Claustrum 0/12 11/12
Subthalamic nucleus 4/12 9/12 Lateral geniculate nucleus 3/12 10/12 Medial geniculate nucleus 2/12 12/12 Ventrolateral thalamus 12/12 12/12 Flocculus cerebelli 9/12 10/12 Cerebellar vermis 9/12 10/12
Note.—T1 indicates T1-weighted sequence; T2, T2-weighted se-quence; CN, cranial nerve.
Decussation of superior cerebellar peduncles
9/12 1/12
Posterior limb internal capsule 12/12 12/12 Anterior limb internal capsule 0/12 0/12
Optic nerve 0/12 0/12
Optic chiasm 0/12 1/12
Optic tracts 7/12 0/12
Optic radiations 1/12 2/12 Corpus callosum 0/12 0/12 Anterior commissure 3/12 0/12 Habenular commissure 1/12 0/12 Corticospinal tracts 11/12 9/12
[image:2.587.55.281.83.347.2] [image:2.587.306.534.84.347.2]as were the more rostral extensions of the medial and lateral lemnisci. The brachium of the inferior collicu-lus was identified in about half the subjects (Fig 1C). On T2-weighted images, the nucleus of the inferior colliculus (Fig 2F) was almost always identified. The nuclei of the third cranial nerves and the interpedun-cular nuclei were identified in more than half our subjects (Fig 2F). The superior cerebellar peduncles had low signal intensity in half our subjects.
Cerebellum
On T1-weighted images, the cerebellar vermes (Fig 1A) and flocculi (Fig 1A) had high signal intensity in nine patients. On T2-weighted images, the cerebellar dentate nuclei were always distinguished by an
irreg-ular circumference of hypointensity around a hyper-intense center (Fig 2C). The cerebellar vermes and flocculi were of low signal intensity in 10 of 12 sub-jects (Fig 2B–D).
Deep Cerebral Nuclei and Optic Pathways
On T1-weighted images through the deep cerebral nuclei and internal capsules, a focus of high-signal intensity was always seen in the posterior limb of the internal capsules (Fig 1D). The globi pallidi, particu-larly in the medial aspects, were always of slightly higher signal intensity than the other gray matter nuclei, as were the ventrolateral thalamic nuclei (Fig 1D). The high signal previously attributed to the pos-terior half of the pospos-terior limbs of the internal cap-FIG 1. Axial spin-echo (500/11/2) images.
A, Image at the level of the medulla shows hyperintensity of the flocculi (large white arrows), inferior cerebellar peduncles (small white arrows), medial lemniscus (large black arrow), and median longitudinal fasciculus (small black arrow).
B, Image at the level of the midpons shows the curvilinear hyperintensity of the medial lemniscus (large straight arrows) and the high intensity of the superior cerebellar peduncles (curved arrows) at the lateral aspects of the fourth ventricle. The fascicle of the right fifth cranial nerve is seen coursing through the pons (small arrows).
C, Image at the level of the midbrain shows high signal at the decussation of the superior cerebellar peduncles (black arrow) with possibly some contribution from the nuclei of the third cranial nerves. A curvilinear stripe of hyperintensity is seen in the dorsolateral margins of the midbrain (curved arrows), representing the brachium of the inferior colliculus. Some hyperintensity is seen in the optic tracts (open arrows). Note that at this level, the cerebral white matter is of uniform low intensity and the cerebral cortex is of uniform intensity other than some slight hyperintensity in the visual cortex.
D, Image at the level of the basal ganglia shows high signal intensity in the globi pallidi (arrowheads), the posterior limbs of the internal capsules (black arrows), the ventrolateral thalamic nuclei (rather faint) (curved arrows), and the habenular commissure (straight white arrows).
sules (1) appeared to be primarily in the medial as-pect of the globi pallidi on these high-quality images (Fig 1D). The optic tracts were of high signal intensity in about half our subjects (Fig 1C). The optic nerves and optic chiasm were very difficult to evaluate be-cause of the contrast from the surrounding fat and CSF. The medial and lateral geniculate bodies, sub-thalamic nuclei, and optic radiations were less com-monly identified as regions of high signal intensity.
On T2-weighted images, a spot of low signal inten-sity was always seen in the posterior aspect of the posterior limb of the internal capsule (Fig 2I). In addition, discrete low signal intensity was always seen in the medial geniculate bodies (Fig 2G) and the ventrolateral thalamic nuclei (Fig 2I). Low signal in-tensity was nearly always seen in a curvilinear area of the far lateral putamina (Fig 2I), in the claustra (Fig 2I), in the subthalamic nuclei (Fig 2H), and in the lateral geniculate bodies (Fig 2G and H). The optic nerves and optic chiasm were difficult to evaluate because of striking contrast and artifacts from sur-rounding fat and CSF, respectively.
Cerebral Cortex and Subcortical White Matter
In the remainder of the cerebrum, the only consis-tent findings were of faint T1 shortening and very faint T2 shortening along the corticospinal tracts
(Figs 1E–F and 2J). The anterior commissure and habenular commissure (Fig 1D) occasionally showed T1 shortening.
Discussion
The findings of this study establish that certain structures are consistently seen on MR imaging stud-ies of the neonatal brain. A knowledge of these struc-tures and their locations is critical for the proper interpretation of neonatal MR scans, particularly in those children with evidence of cranial neuropathies. Moreover, this study shows that many of the struc-tures are seen better on T1-weighted images, whereas others are better seen on T2-weighted images. Fi-nally, this study shows that the signal intensity of the gray matter structures within the neonatal brain is variable on both T1- and T2-weighted images.
studies is the very small size of the structures and because a 1- or 2-mm gap was present between the imaging sections on our studies. It seems likely that a dedicated study of the brain stem, by obtaining con-tiguous or overlapping 3- or 4-mm sections (perhaps acquired in two consecutive sequences with an offset of 2 to 3 mm), should allow most of these structures, such as the pontine nuclei and the geniculate bodies, to be viewed very consistently. Alternatively, a high-resolution 3D acquisition technique (eg, spoiled gra-dient-recalled imaging, 3D fast low-angle shot, mag-netization-prepared rapid acquisition gradient-echo) with a small (1- to 3-mm) partition size could be used. Identification of these structures may prove useful in the assessment of neonates with cranial neuropathies or other neurologic impairments. The higher resolu-tion of our modern equipment also allowed us to separate the high T1-weighted signal of the posterior limb of the internal capsule from that of the adjacent
globus pallidus on images at the level of the basal ganglia. Our images showed that only a small focus of T1-weighted shortening is present in the posterior limb of the internal capsule of the neonate at the level of the globus pallidus and that most of the hyperin-tensity is present in the globus pallidus (Fig 1D). In previous investigations, in which the signal of the capsule could not be distinguished from that of the pallidum, most of the high signal has been attributed to the internal capsule (1, 9).
The study also suggests that T1-weighted images show myelinated white matter tracts, which appear as regions of relative hyperintensity compared with un-myelinated white matter, better than gray matter structures. Gray matter structures are less hyperin-tense (have longer T1-weighted relaxation times) and are seen less well and less frequently. On T2-weighted images, however, the difference in signal intensity between gray matter and unmyelinated white matter FIG 2. Axial spin-echo (3000/120/1) images.
A, Image at the level of the lower medulla shows low signal intensity (arrows) at the level of the nuclei cuneatus and gracilis.
B, Image in the upper medulla shows low signal intensity in the vestibular nuclei (large straight arrows), inferior cerebellar peduncles (small straight arrows), inferior olivary nuclei (arrowheads), and inferior cerebellar vermis (curved arrows).
C, Image at a similar level toB, but in a different patient, better shows the low signal intensity of the dentate nuclei (white arrows) and the flocculi (black arrows). Low signal intensity is also noted in the cerebellar vermis, vestibular nuclei, and inferior olivary nuclei, as inB.
D, Image at the level of the middle of the pons shows the main nuclei of the sixth (black arrows), seventh (arrowheads) cranial nerves and the spinal nucleus of the fifth (large arrows) cranial nerves. The intrapontine fascicle of the fifth nerve is seen coursing through the pons (small arrow).
E, Image at the level of the upper pons shows the medial lemnisci (white arrows), lateral lemnisci (curved black arrows), and the fibers of the superior cerebellar peduncles (small black arrows) as they course toward their decussation in the midbrain. It was unusual to see the structures this discretely.
F, Image at the level of the midbrain shows low signal in the region of the third nerve nuclei/interpeduncular nuclei (short white arrow) and at the nucleus of the inferior colliculus (black arrows). Not also the low signal intensity of the visual cortex (long white arrows) compared with most of the cortical gray matter.
G, Image at the level of the midbrain (different patient) shows the medial and lateral geniculate bodies (large arrows) and the oculomotor nuclei (small arrows) as regions of hypointensity.
H, Image at the level of the superior midbrain and inferior basal ganglia shows hypointensity of the subthalamic nuclei (open arrows) and the geniculate bodies, seen better on the left (solid arrows) than on the right.
I, Image at the level of the basal ganglia shows a curvilinear stripe of hypointensity in the lateral aspect of the putamina (large solid white arrows), a spot of hypointensity in the posterior limbs of the internal capsules (small white arrows), and a large focus of hypointensity in the ventrolateral thalami (open arrows). The left claustrum (black arrows) can be seen between the external and extreme capsules.
nuclei on T2-weighted images.
We were able to distinguish at least four levels of hypointensity on the MR images of the neonates in this study: unmyelinated white matter, unmyelinated gray matter, myelinated white matter, and myelinated gray matter. On the T1-weighted spin-echo images of neonates, unmyelinated white matter was most hy-pointense, followed, in order of increasing intensity, by unmyelinated gray matter, myelinated gray matter, and myelinated white matter. On T2-weighted spin-echo images of neonates, the unmyelinated white matter was the most hypointense, followed by the unmyelinated gray matter, myelinated white matter, and myelinated gray matter. Several possible expla-nations exist for the difference in signal intensity between the T1- and T2-weighted images. First, as Korogi et al (20) have discussed, it is likely that the changes in signal intensity of developing gray matter reflect the development of neurons, synapses, and oligodendrocytes, in addition to the changes in my-elination. They postulate that maturational changes of neurons and, in particular, increasing synaptic den-sity may reduce the amount of free water in the brain, resulting in shortening of the T2-weighted relaxation time. This theory is very reasonable and is consistent with the finding that many developmental changes, including chemical changes (21), increased local blood flow (3), increased glucose uptake (22), in-creased synaptic density (20), and inin-creased myelina-tion (19, 23), occur nearly simultaneously in specific regions of the developing brain. This explanation may help to explain why the intensities of mature gray matter differ on the different imaging sequences. An observation that seems confounding is that the my-elinated medial globus pallidus is hyperintense on T1-weighted images but is not hypointense on T2-weighted images, whereas the similarly myelinated ventrolateral thalamic nuclei are minimally hyperin-tense on T1-weighted images but very hypoinhyperin-tense on T2-weighted images (Figs 1D and 2I). It is clear that we still have a lot to understand regarding the pro-cesses that cause the T1 and T2 shortening in the developing brain.
It is reasonable to ask why we chose to study stan-dard T1- and T2-weighted images at a time when fluid-attenuated inversion recovery (FLAIR) is the “hot” sequence. The answer is quite simple. In our
tified in the brain stem, cerebellum, and deep regions of the cerebrum on T1- and T2-weighted spin-echo studies of the neonatal brain. A knowledge of these structures is essential for proper interpretation of imaging studies of these patients.
References
1. Barkovich AJ, Kjos BO, Jackson DE Jr,Norman D. Normal mat-uration of the neonatal and infant brain: MR imaging at 1.5 T.
Radiology1988;166:173–180
2. Barkovich AJ.Brain development: normal and abnormal. In: Atlas SW, ed.Magnetic Resonance Imaging of the Brain and Spine. New York: Raven; 1991:129–175
3. Barkovich AJ, Hallam D.Neuroimaging in perinatal hypoxic-isch-emic injury.Ment Retard Dev Disabil Res Rev1997;3:28–414 4. Dietrich RB, Bradley WG, Zagaroza EJ, et al.MR evaluation of
early myelination patterns in normal and developmentally delayed infants.AJNR Am J Neuroradiol1988;9:69–76
5. Keeney SE, Adcock EW, McArdle CB.Prospective observations of 100 high-risk neonates by high field (1.5 Tesla) magnetic resonance imaging of the central nervous system, I: intraventricular and extracerebral lesions.Pediatrics1991;87:421–430
6. Keeney SE, Adcock EW, McArdle CB.Prospective observations of 100 high-risk neonates by high field (1.5 Tesla) magnetic resonance imaging of the central nervous system, II: lesions associated with hypoxic-ischemic encephalopathy.Pediatrics1991;87:431–438 7. Martin E, Boesch C, Zuerrer M, et al. MR imaging of brain
maturation in normal and developmentally handicapped children.
J Comput Assist Tomogr1990;14(5):685–692
8. Martin E, Krassnitzer S, Kaelin P, Boesch C.MR imaging of the brainstem: normal postnatal development.Neuroradiology1991;33: 391–3959
9. McArdle CB, Richardson CJ, Nicholas DA, Mirfakhraee M, Hay-den CK, Amparo EG. Developmental features of the neonatal brain: MR imaging, Part I: gray-white matter differentiation and myelination.Radiology1987;162:223–229
10. Sie LTL, van der Knaap MS, van Wezel-Meijler G, Valk J.MRI assessment of myelination of motor and sensory pathways in the brain of preterm and term-born infants.Neuropediatrics1997;28: 97–105
11. Staudt M, Schropp C, Staudt F, et al.MRI assessment of myelina-tion: an age standardization.Pediatr Radiol1994;24:122–127 12. Steinlin M, Dirr R, Martin E, et al.MRI following severe perinatal
asphyxia: preliminary experience.Pediatr Neurol1991;7:164–170 13. Staudt M, Schropp C, Staudt F, Obletter N, Bise K, Breit A.
Myelination of the brain in MRI: a staging system.Pediatr Radiol
1993;23:169–176
14. van de Bor M, Guit GL, Schreuder AM, Wondergem J, Vielvoye GJ. Early detection of delayed myelination in preterm infants.
Pediatrics1989;84:407–411
15. van der Knaap MS, Valk J.MR imaging of the various stages of normal myelination during the first year of life.Neuroradiology
1990;31:459–470
Ade`r HJ, Valk J.Normal gyration and sulcation in preterm and term neonates: appearance on MR images.Radiology 1996;200: 389–396
17. Bayley N.The Bayley Scales of Infant Development II. New York: New York Psychological Corp; 1993
18. Yakovlev PI, Lecours AR. The myelogenetic cycles of regional maturation of the brain.In: Minkowski A, ed.Regional Develop-ment of the Brain in Early Life. Oxford: Blackwell; 1967:3–70 19. Rorke LB, Riggs HE. Myelination of the Brain in the Newborn.
Philadelphia: Lippincott; 1969:28
20. Korogi Y, Takahashi M, Sumi M, et al.MR signal intensity of the
perirolandic cortex in the neonate and infant.Neuroradiology1996; 38:578–584
21. Penrice J, Cady EB, Lorek A, et al.Proton magnetic resonance spectroscopy of the brain in normal preterm and term infants and early changes after perinatal hypoxia-ischemia.Pediatr Res1996; 40:6–14
22. Chugani HT, Phelps ME, Mazziotta JC.Positron emission tomog-raphy study of human brain functional development.Ann Neurol
1987;22:487–497