Ammonia is a widespread toxicant that enters the aquatic environment from both point and non-point sources. The major point sources are sewage treatment plants whereas non-point sources can include fertiliser and urban storm runoff (API, 1981). In aqueous solution, ammonia exists as two species, unionised ammonia gas (NH3) and the ammonium ion (NH4+).
Here, the term ammonia refers to total ammonia, the sum of NH3and NH4+. Ammonia gas can diffuse into fish across the
gills, and water NH3 concentration therefore determines the
potential for toxicity. The threshold aquatic concentration for toxicity has been established as 248µmol l−1 total ammonia
at pH 6.5 and 17µmol l−1 at pH 9.0 (US Environmental
Protection Agency, 1998). Within the fish, however, the primary form of total body ammonia is NH4+at physiological
pH (7.0–8.0), and it is this form of ammonia that has a number of toxic effects (Hillaby and Randall, 1979; Beaumont et al., 2000a).
Ammonia accumulation has been linked to muscle fatigue (Mutch and Bannister, 1993) and has been suggested as a cause of reduced swimming performance in trout (Ye and Randall, 1989; Randall and Brauner, 1991; Beaumont et al., 1995b). An accumulation of ammonia in the plasma has also been implicated in the reduced maximum sustainable (critical) swimming speed (Ucrit; Brett, 1964) measured in brown trout
(Salmo trutta) exposed to low water pH, or to low pH and copper together (Butler et al., 1992; Beaumont et al., 1995a). On exposure of brown trout to sublethal copper concentrations at pH 5, the extent of the impairment of Ucritwas correlated
with ammonia levels in the plasma, but did not appear to be linked to problems with O2uptake or transport (Beaumont et
al., 1995b). Copper is a toxic element which primarily targets the gills (Lauren and McDonald, 1985), causing problems such as ionoregulatory disturbances (Stagg and Shuttleworth, 1982a; Lauren and McDonald, 1985; Wilson and Taylor, 1993)
Printed in Great Britain © The Company of Biologists Limited 2001 JEB3427
Adult trout Oncorhynchus mykiss fitted with a dorsal aortic catheter were exposed to 288±15µmol l−1 (mean ± S.E.M.) total ammonia for 24 h in water at a pH of 8.39±0.02, while swimming at a speed equivalent to 0.75 body lengths s−1 (BL s−1) in a Brett-type tunnel respirometer. The fish were then exposed to stepwise increments in swimming speed (0.25 BL s−1 every 30 min) until exhaustion. Measurements of oxygen uptake (MO∑) and plasma total ammonia levels and pH were made at each speed. Control trout were treated identically but without exposure to ammonia. Ammonia exposure caused an increase in plasma total ammonia level to 436±34µmol l−1, compared to 183±30µmol l−1 in control animals (N=6). A significant reduction in total plasma ammonia level was found in both groups during exercise, despite a large negative concentration gradient in those exposed to an elevated concentration of ammonia in water, which may indicate an active excretory process. The overall increase in plasma ammonia levels in exposed trout was associated with a significant reduction in critical swimming speed (Ucrit) to
1.61±0.17 BL s−1 from 2.23±0.15 BL s−1 in control animals. Ammonia-exposed trout had a significantly higher maintenance metabolic rate (MMR) than control fish, when estimated as the y-intercept of the relationship between swimming speed and MO∑. Active metabolic rate (AMR, maximum MO∑as measured at Ucrit) was significantly lower in ammonia-exposed animals, leading to a profound reduction in factorial aerobic scope (AMR/MMR). Reduced
Ucrit was also linked to a reduction in maximum tailbeat frequency. Calculation of membrane potentials (EM) in the white muscle of fish swum to Ucrit revealed a significant partial depolarisation of white muscle in ammonia-exposed fish. This may have prevented white muscle recruitment and contributed to the reduced maximum tailbeat frequency and overall impairment of swimming performance in the ammonia-exposed fish.
Key words: ammonia, exercise, aerobic scope, metabolic rate, membrane potential, critical swimming speed, rainbow trout,
Oncorhynchus mykiss.
Summary
Introduction
EFFECTS OF SUBLETHAL AMMONIA EXPOSURE ON SWIMMING PERFORMANCE
IN RAINBOW TROUT (ONCORHYNCHUS MYKISS)
A. SHINGLES1,*, D. J. MCKENZIE1,2, E. W. TAYLOR1, A. MORETTI2, P. J. BUTLER1 ANDS. CERADINI2 1School of Biosciences, University of Birmingham, Birmingham, B15 2TT, UK and 2Business Unit Environment,
Centro Elettrotecnico Sperimentale Italiano, Via Reggio Emilia 39, 20090 Segrate (MI), Italy
*Author for correspondence (e-mail: A.Shingles@bham.ac.uk)
and gill damage (Wilson and Taylor, 1993; Sola et al., 1995). Both may contribute to the accumulation of ammonia by inhibiting its efflux over the gills.
Beaumont et al. (Beaumont et al., 2000a) identified two main reasons why an accumulation of ammonia in the body may cause a reduction in swimming performance of copper-and acid-exposed fish. They suggested that an altered metabolic status within the fish, arising from the effects of increased NH4+ levels on a number of metabolic pathways,
may lead to premature muscle fatigue and, hence, a reduction in swimming performance. Also, Beaumont et al. (Beaumont et al., 2000b) measured the resting membrane potential of white muscle and revealed a significant partial depolarisation. This was consistent with a predicted depolarisation, based on the measured distribution of ammonia between intracellular and extracellular compartments, and was suggested to be due to the displacement of K+by NH
4+.
The present study sought to establish a causal relationship between ammonia levels and reduced swimming performance in trout by testing whether increased plasma ammonia levels alone reduce swimming performance. Trout were exposed to high external ammonia concentrations in hard water at alkaline pH, thus eliminating any toxic effects associated with copper or acid in soft water. Swimming respirometry was used to obtain estimates of maintenance metabolic rate (MMR) and active metabolic rate (AMR) (Brett, 1964; Fry, 1971; Beamish, 1978) to reveal metabolic costs and effects on aerobic scope that were associated with ammonia exposure.
Materials and methods Experimental animals
20 rainbow trout (Oncorhynchus mykiss) with masses and body lengths ranging from 385–788 g and 31–36 cm, respectively, were obtained from a commercial supplier and maintained for 2 weeks prior to experimentation at La Casella Fluvial Hydrobiology Station (Via Argine del Ballottino, 29010 Sarmato [PC], Italy). They were held in a 4 m2fibreglass
tank (water volume approximately 1000 l) provided with biofiltered well water at a temperature of 16±0.1 °C. The water had the following ionic composition (in mmol l−1): Ca2+ 2.3,
Mg2+0.6, Na+2.3, Cl−0.7, K+0.9, titratable alkalinity to pH
4 = 13.5 mmol l−1, total hardness 240 mg l−1 as CaCO 3, pH
8.39±0.02. Animals were fed commercial trout feed ad libitum during the 2-week acclimation period but were starved for at least 4 days before use in experiments, to avoid any potentially confounding effects of feeding on plasma ammonia levels (Brett and Zala, 1975) or on respiratory metabolism and swimming performance (Alsop and Wood, 1997).
Fish were anaesthetised in 0.1 g l−1 tricaine methane
sulfonate (MS-222) buffered with 0.2 g l−1 NaHCO 3, then
transferred to an operating table where their gills were irrigated with anaesthetic solution containing 0.075 g l−1 MS-222
buffered with 0.15 g l−1 NaHCO
3. A chronic indwelling
catheter was implanted in the dorsal aorta according to the method of Sovio et al. (Sovio et al., 1972). The fish were
allowed to recover in Plexiglas chambers with a constant flow of aerated water.
Ammonia exposure
Following 24 h recovery from surgery, the trout were exposed in their Plexiglas chambers to water containing 288±15µmol l−1(mean ±S.E.M.) total ammonia as NH
4Cl. This
concentration was achieved by delivering a known volume of a concentrated solution of NH4Cl with a peristaltic pump, to
a known flow of water from a header tank. The resulting concentration of ammonia in the water was monitored continuously every 15 min by sampling the respirometer outflow with an automated ion-analyser for total ammonia (Applikon ADI 2013). The ammonia concentration was approximately 50 % of the 96 h LC50 for ammonia of rainbow trout with a mass of 0.5 g in the well water at La Casella, and below the concentration required to cause any mortality at 96 h exposure in those fish (S. Ceradini and D. J. McKenzie, unpublished observations). It was found in preliminary studies to generate plasma total ammonia concentrations within the range measured in studies by Beaumont et al. (Beaumont et al., 1995; Beaumont et al., 2000a; Beaumont et al., 2000b). It can, therefore, be considered a sublethal exposure for the animals used in the present study. The concentration of gaseous NH3
in the water was 20±1µmol l−1at the prevailing pH of 8.39,
calculated using the Henderson–Hasselbalch equation and a pKammof 9.52 at 16 °C (Boutilier et al., 1984).
Swimming respirometry
Experiments were performed with a Brett-type swim-tunnel respirometer (Brett, 1964) constructed in PVC (polyvinyl chloride). A circulating flow of water was generated in the tunnel (total volume 49 l) by an acrylic propeller attached to a variable-speed d.c. motor. Trout were exercised downstream of the propeller in a swimming chamber with a square 225 cm2
cross-sectional area. Vanes positioned between the propeller and swimming chamber ensured non-turbulent water flow and uniform water velocity across the entire section of the swimming chamber (Steffensen et al., 1984).
A small fraction of the water from the sealed respirometer was siphoned past an oxygen electrode (Radiometer E5041; accurate to ±1.5 % full scale) in a cuvette thermostatted to 16°C with a water bath (Lauda). Care was taken to ensure that flow of water past the electrode did not decline or vary during the experiments. An oxygen meter (Strathkelvin Instruments) displayed the partial pressure of oxygen in the respirometer water (PwO∑), with the
signals recorded by a computer and LabVIEW software (National Instruments), via an interface board (National Instruments CB 68LP). Information on changes in PwO∑ over time during the
period of closed-cycle circulation were stored as text files, and then linear regressions between time and PwO∑were calculated
using a spreadsheet program (Excel). The resulting slopes were used to quantify the rate of oxygen consumption, with appropriate values for fish mass, respirometer water volume and O2solubility
The respirometer chamber was immersed in a large tank of aerated water. When the PwO∑ in the respirometer chamber
declined below 90 % saturation (due to oxygen uptake by the swimming fish), the LabVIEW software activated a flushing pump, which flushed aerated water from the outer tank through the respirometer chamber, bringing the PwO∑ back to 95 %
saturation, at which point the pump switched off and measurement of oxygen consumption resumed.
Individual trout were transferred rapidly from their Plexiglas chambers to the respirometer, which received a flow of the water containing 288µmol l−1NH
4Cl, and were left overnight
swimming spontaneously at a current velocity equal to 0.75 BL s−1. The following day, when the fish had been exposed
for a total of 24 h to the elevated water ammonia concentration, the fish were subjected to progressive increments in swimming speed of 0.25 BL s−1every 30 min until fatigue (Brett, 1964).
Measurements of MO∑were collected at each swimming speed,
for the last 15 min of each increment. Fish were considered to be fatigued when they were unable to remove themselves from the posterior screen of the swimming chamber despite gentle encouragement. Maximum sustainable (critical) swimming speed (Ucrit) was calculated as described by Brett (Brett, 1964).
For each fish, a least-squares exponential regression was applied to the relationship between swimming speed and oxygen uptake, to reveal the theoretical rate of O2uptake of
the stationary fish as the y-intercept of the regression equation (Brett, 1964). In starved fish, this value is considered to be a valid estimate of maintenance metabolic rate (MMR), also described as standard metabolic rate (Brett, 1964; Fry, 1971). Active metabolic rate (AMR) was determined for the fish as the maximum MO∑measured during exercise (Fry, 1971). Each
fish’s AMR was divided by its MMR to estimate aerobic scope (Fry, 1971). The value of MMR was subtracted from the MO∑
at each swimming speed to reveal the trout’s net cost of swimming (Beamish, 1978). Mean rates of total O2 uptake
were also calculated at each speed to compare between the experimental and control groups. Single measurements of MO∑
were excluded from charts, and also calculations of MMR and AMR for individual fish if (1) the fish would not swim correctly at low swimming speeds or (2) the MO∑reading
became unstable. MO∑readings were not taken for all fish at
higher swimming speeds as they were unable to maintain steady swimming for a sufficient period of time. Counts of tailbeat frequency were made at each speed and used as an index of propulsive muscular power in the two groups.
Blood samples (350µl) were collected at each swimming speed and immediately following fatigue. Whole blood pH was measured with a capillary electrode (Radiometer BMS3 Blood-Gas Analyser) linked to a digital meter (Radiometer PHM 74). Plasma was separated by centrifugation at 9000 g for 3 min and samples were frozen and stored in liquid nitrogen for a maximum of 2 weeks prior to thawing and analysis of ammonia with an analytical kit (Sigma ammonia 171). Plasma NH3 concentration was calculated from the values of total
ammonia and plasma pH using the Henderson–Hasselbach equation and a pK′ammvalue of 9.62 estimated for trout plasma
at 16 °C from the nomogram provided in Boutilier et al. (Boutilier et al., 1984).
At fatigue, fish were rapidly removed from the respirometer and killed by a blow to the head. Tissue samples were taken from the liver, gills and white muscle and ‘freeze-clamped’ using aluminium tongs pre-cooled in liquid nitrogen. All tissue samples were freeze-clamped within 40 s of killing the fish. Tissue ammonia concentration was measured using the glutamate dehydrogenase method (Kun and Kearney, 1974). Tissue intracellular pH (pHi) was determined using the metabolic
inhibition method (Pörtner et al., 1990) and using the Cameron BGM200 blood gas system at 16 °C. The samples were stored in liquid nitrogen for a maximum of 2 weeks prior to analysis.
The control group was treated identically to the ammonia-exposed group but without exposure to elevated water ammonia levels.
Statistical analysis
To describe the relationships between swimming performance and rate of oxygen uptake during the exercise protocol, linear, exponential or power functions were applied and the function with the highest correlation coefficient was identified. For any given measurement interval during the exercise protocol, variables were compared between the control and ammonia-exposed groups using a t-test. All single variables (e.g. Ucrit) were also compared between the two
groups using a t-test. The level of significance was taken as P<0.05.
Results
The ammonia-exposed group had mass and body lengths of 559±33 g and 33.8±0.8 cm, respectively (means ±S.E.M., N=6). Those of the control group were 534±66 g and 33.9±0.8 cm, respectively (means ± S.E.M., N=6). There was no significant difference in mass or length between the two groups.
Plasma and tissue pH and ammonia
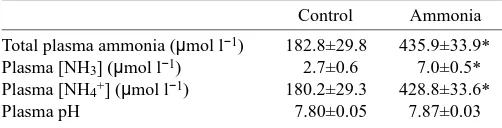
Plasma ammonia was significantly elevated in trout exposed for 24 h to ammonia while swimming at 0.75 BL s−1(Table 1).
[image:3.612.317.568.623.687.2]During exercise, the total ammonia content of the plasma
Table 1. Plasma ammonia levels and pH in rainbow trout after swimming at 0.75 BL s−1overnight in water with or
without added ammonia
Control Ammonia
Total plasma ammonia (µmol l−1) 182.8±29.8 435.9±33.9*
Plasma [NH3] (µmol l−1) 2.7±0.6 7.0±0.5*
Plasma [NH4+] (µmol l−1) 180.2±29.3 428.8±33.6*
Plasma pH 7.80±0.05 7.87±0.03
Trout were exposed to water with no ammonia (Control), or with 288µmol l−1total ammonia (Ammonia) for 24 h.
Values are means ±S.E.M., N=6 in all cases.
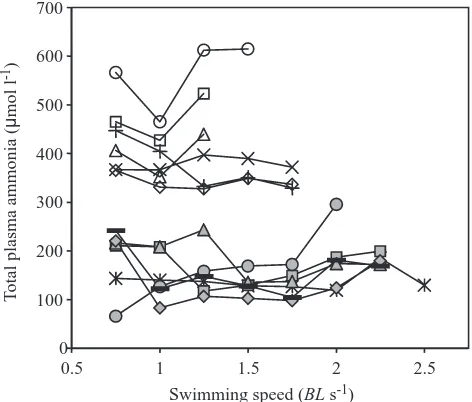
decreased significantly in the majority of these fish at swimming speeds exceeding 0.75 BL s−1(Fig. 1). Plasma pH
was not affected significantly by ammonia exposure (Table 1) but was found to decrease significantly following exercise to Ucritin both groups (Fig. 2B).
Following exercise to exhaustion, the trout exposed to ammonia had significantly higher total ammonia content in their liver and the gills than the control fish did, but this was not true of white muscle (Table 2). Tissue pHi was not
significantly different between ammonia-exposed fish and controls for any of the tissues sampled (Table 2).
Swimming respirometry
Ammonia-exposed trout showed a significant (28 %) reduction in Ucritcompared to control trout (Table 3). Stepwise
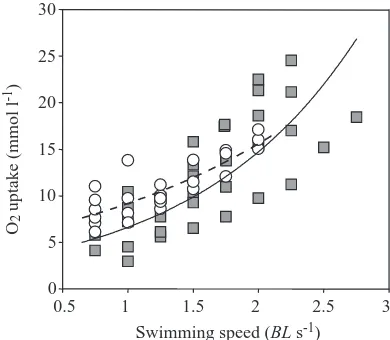
increases in swimming speed elicited an exponential increase in MO∑by the trout from both control and ammonia-exposed
groups but there were marked differences in MO∑between the
groups. Ammonia-exposed fish showed a higher MO∑ at all
swimming speeds up to 2.0 BL s−1, although this difference was
not significant (Fig. 3). Calculation of MMR revealed it to be significantly higher in the ammonia-exposed trout than in the control trout (Table 3). However, AMR (active metabolic rate) (maximum MO∑at Ucrit) was significantly lower in
ammonia-exposed trout than in the control group, due to the lower Ucrit,
such that there was a significant reduction in factorial aerobic scope (Table 3). The net cost of swimming (as MO∑) was not
significantly different between the treatments (data not shown). Both groups exhibited linear relationships between tailbeat 0
100 200 300 400 500 600 700
0.5 1 1.5 2 2.5
Swimming speed (BL s-1)
T
otal
p
la
sm
a
amm
o
ni
a (
µ
m
ol
l
[image:4.612.53.289.74.275.2]-1)
[image:4.612.356.520.75.459.2]Fig. 1. Plasma total ammonia content at incremental swimming speeds in individual rainbow trout exposed either to 288µmol l−1 total ammonia for 24 h (open symbols) or to water with no added ammonia (filled symbols). Each symbol represents a different fish.
Fig. 2. Plasma total ammonia content (A), plasma pH (B) and plasma [NH3] (C) in rainbow trout exposed either to 288µmol l−1 total ammonia for 24 h (open bars) or to water with no added ammonia (filled bars). Values (mean ±S.E.M., N=6) are shown for fish swum for 24 h at 0.75 BL s−1, at the swimming speed showing the lowest concentration of ammonia for each fish, and at Ucrit. *Significant difference from the 0.75 BL s−1 overnight value (t-test, P<0.05); ‡significant difference from the lowest plasma ammonia value (P<0.05).
0 100 200 300 400 500 600
T
otal plasma ammonia (
µ
mol l
-1)
A
*
‡
7.65 7.70 7.75 7.80 7.85 7.90 7.95
P
lasma p
H
B
‡ ‡
0 2 4 6 8 10
0.75 BL s-1 Lowest Ucrit
P
lasma
[N
H3
] (
µ
mol l
-1)
C
*
‡
Table 2. Tissue total ammonia content and intracellular pH in rainbow trout swum to Ucritfollowing exposure to water with
or without added ammonia
Control Ammonia
Ammonia Ammonia content content
Tissue (µmol g−1) pHi (µmol g−1) pHi
Gills 1.51±0.39 6.99±0.01 2.37±0.11* 6.94±0.03 Liver 2.31±0.34 6.80±0.05 3.67±0.24* 6.76±0.04 White muscle 1.75±0.36 6.71±0.04 1.95±0.24 6.68±0.08
Trout were exposed to water with no added ammonia (Control), or with 288µmol l−1total ammonia (Ammonia) for 24 h.
pHi, intracellular pH.
Values are means ±S.E.M., N=6 in all cases.
[image:4.612.42.294.388.481.2]frequency and swimming speed that were statistically indistinguishable, such that frequencies did not differ between the groups at any given speed (data not shown; y=0.8806x+1.6272, r2=0.5809). However, the control fish had
a higher maximum tailbeat frequency by virtue of achieving higher Ucrit(Table 3).
Discussion
The critical swimming speed achieved by the control rainbow trout in the present study was comparable to that of control brown trout of a similar length measured in previous studies (Beaumont et al., 1995b). Ammonia exposure had marked effects on the aerobic metabolism of the trout that were associated with a significant reduction in Ucrit. Brett (Brett,
1958) suggested that environmental stresses can interfere with aerobic metabolism as ‘loading’ factors, which increase MMR and thereby reduce the proportion of total energy available for muscular work, and as ‘limiting’ factors, which limit the capacity to increase metabolic rate and/or perform muscular work, thus reducing AMR. The measurements of respiratory metabolism and tailbeat frequency during swimming imply that exposure to sublethal ammonia for 24 h caused both loading and limiting effects on metabolism in rainbow trout, leading to a profound decline in factorial aerobic scope and performance.
In salmonids, MMR has been shown to increase following sub-lethal exposure to a number of toxicants such as low pH (Wilson et al., 1994), copper at low pH (Waiwood and Beamish, 1978; Beaumont et al., 1995a), and also following acclimation to non-optimal salinities (Morgan and Iwama, 1991). This increased MMR may be a consequence of (1) a stress response, (2) an increase in active mechanisms, or (3) altered metabolic status of the tissue. A stress response may lead to raised MMR in fish (Wendelaar Bonga, 1997). In salmonids, ammonia exposure leads to release of cortisol (Knoph and Olsen, 1994), and increased plasma cortisol levels
cause an increase in metabolic rate (Morgan and Iwama, 1996). An increase in active ammonia excretion (against a concentration gradient) may have caused an increase in the metabolic rate required for homeostasis. Wilson et al. (Wilson et al., 1994b) found that exposure to low pH raised MMR and reduced Ucrit in rainbow trout, and suggested that this was a
consequence of increased metabolic costs for ionoregulation. The evidence for active ammonia excretion in the present study is, however, only circumstantial (see below) and it is unlikely that it would have accounted for the measured increase in MMR, because recent theoretical and experimental studies indicate that the metabolic costs of active ion exchange in freshwater teleosts are very low (Kirschner, 1995; Morgan and Iwama, 1999).
Exposure to copper and acid has also been found to cause an increase in MMR (Waiwood and Beamish, 1978; Beaumont et al., 1995b), and Beaumont et al. (Beaumont et al., 2000a) detected increased costs associated with maintaining concentrations of ATP in white muscle of brown trout exposed to copper and acid, through reduced concentrations of phosphocreatine. Although red muscle was not sampled in the present study, Beaumont et al. (Beaumont et al., 2000a) found evidence of disruption to aerobic metabolism in red muscle, suggested to be due to the effect of NH4+ on the first step of
the tricarboxylic acid (TCA) cycle (oxidative decarboxylation of pyruvate to acetyl CoA) and the pyruvate dehydrogenase complex, which may also be inhibited by ammonia (Katunuma et al., 1966). Thus, a raised MMR may reflect costs associated with impaired efficiency of aerobic and anaerobic metabolism, resulting from the effects of NH4+on metabolic pathways. It
[image:5.612.346.541.74.244.2]should be noted, however, that Beaumont et al. (Beaumont et al., 1995b; Beaumont et al., 2000a; Beaumont et al., 2000b) Fig. 3. The relationship between swimming speed and O2uptake in rainbow trout exposed either to 288µmol l−1total ammonia for 24 h (circles) or to water with no added ammonia (control) (squares). For the elevated ammonia group, the broken line describes the exponential relationship y=5.4338e0.526x (r2=0.6759, N=24 observations on 6 fish). For the control group, the solid line describes the exponential relationship y=2.9687e0.7999x (r2=0.604, N=35 observations on 6 fish).
Table 3. Values for selected exercise-related metabolic, respiratory and performance variables in rainbow trout swum
to Ucritfollowing exposure to water with or without added
ammonia
Control Ammonia
MMR (mmol O2kg−1h−1) 3.04±0.86 5.65±0.59*
AMR (mmol O2kg−1h−1) 19.39±1.68 13.63±1.42*
Aerobic scope (AMR/MMR) 6.38±2.58 2.41±0.61* Maximum tailbeat frequency (beats s−1) 3.77±0.04 3.47±0.12* Ucrit(BL s−1) 2.23±0.15 1.61±0.17*
Trout were exposed to water with no added ammonia (Control), or with 288µmol l−1total ammonia (Ammonia) for 24 h.
MMR, maintenance metabolic rate; AMR, active metabolic rate as maximum measured MO∑; Ucrit, maximum sustainable swimming
speed.
Values are means ±S.E.M., N=6 in all cases.
*Significant difference from the control group (t-test, P<0.05).
0 5 10 15 20 25 30
0.5 1 1.5 2 2.5 3
Swimming speed (BL s-1) O2
u
p
tak
e (mm
ol
l
[image:5.612.46.301.122.195.2]did not attribute the reduced swimming performance of brown trout exposed to copper and acid to a loading factor but, rather, to various effects of ammonia on the metabolic status of muscle cells (see below).
The reduced AMR (limiting factor) in the ammonia-exposed trout may have been a consequence of gill damage, hindering gas exchange by affecting the blood–water diffusion distance and surface area available for oxygen uptake, as ammonia is known to cause gill damage at lethal concentrations (Smart, 1976; Hillaby and Randall, 1979). Although this effect cannot be ruled out in the present study, water ammonia concentrations were sublethal and hence are unlikely to have caused significant gill damage. The effects of ammonia on the metabolic status of the muscle may not only have increased MMR, but might also limit AMR, in particular if ammonia disrupts aerobic metabolism, as described above.
Beaumont et al. (Beaumont et al., 2000a; Beaumont et al., 2000b) provided evidence that ammonia limited performance through the effects of NH4+ on the metabolic and
electrophysiological status of muscle, as NH4+can displace K+
in ion exchange mechanisms (Towle and Holleland, 1987). Beaumont et al. (Beaumont et al., 2000a) used various means to demonstrate a partial depolarisation of the red and white muscles in hyperammonemic trout. Membrane potential (EM),
as predicted by the distribution of ammonia between intracellular and extracellular compartments, may be calculated by the Nernst equation:
where R is the gas constant, T the temperature in Kelvin, F the Faraday constant, z the valency and the subscripts i and e denote the intracellular and extracellular concentrations, respectively. The use of intracellular and extracellular ammonia concentrations to calculate EM is based on the
assumptions that the membrane permeability to NH3 is
relatively high in comparison with NH4+, and that these
relative permeabilities are unaltered by exposure to ammonia. There is some debate surrounding the validity of these assumptions and it may be possible that the relative permeabilities change under some circumstances, such that the pH gradient across the membrane dictates the ammonia distribution at rest, while the muscle membrane potential is the dominant effect following exercise (Wang et al., 1994; Wang et al., 1996). Beaumont et al. (Beaumont et al., 2000a) measured EM directly in red and white muscle fibres, after
previously calculating EM from the measured distribution
of ammonia between intracellular and extracellular compartments, and were able to confirm the predicted depolarisation. In the present study, a depolarisation of red muscle in ammonia exposed trout may have limited the capacity for aerobic muscular work and contributed to the reduction in AMR.
Beaumont et al. (Beaumont et al., 2000b) directly measured resting white muscle membrane potential as −86.5±2.9 mV
(mean ± S.E.M., N=6) in control fish and –52.2±4.9 mV in copper- and acid-exposed fish. In the present study, calculation of EMfrom the observed distribution of NH4+between plasma
and white muscle revealed that white muscle at Ucrit had a
membrane potential of –60.3±6.79 mV and –34.9±2.77 mV in control and ammonia-exposed fish, respectively, which differ significantly (P=0.003). This indicates that white muscle was significantly depolarised by exposure to elevated ammonia levels. It must be noted, however, that EMwas calculated for
muscle from fish that had been swum to Ucrit, not for resting
fish. When the muscle is exercising, ammonia is probably being produced endogenously within the muscle cells through the purine nucleotide cycle (Mommsen and Hochachka, 1988), and fluxing into the plasma. This puts limitations on the use of the Nernst equation to calculate EM, as the equation assumes
a state of equilibrium. Thus, calculations of white muscle EM
can only be approximations but, nevertheless, the magnitude of the difference in EM between treatments (25.43 mV)
suggests that exposure to ammonia does cause muscle depolarisation. As the EMvalues were obtained at Ucritthey
were relatively depolarised compared with values obtained by Beaumont et al. (Beaumont et al., 2000a) on white muscle of resting fish. This is probably due to increased flux of K+from
the intracellular space of contracting muscle during activity, which may decrease the membrane potential to half its resting value (Sjogaard, 1991). Depolarisation may also arise from acidification of the tissue during exercise, increasing intracellular [H+] and causing the E
Mto become progressively
more positive. It would have been interesting to have measured EMof white muscle in resting fish, enabling direct comparisons
to be made with EM data found by other authors. Jenerick
(Jenerick, 1956) reported a complete loss of electrical excitability once a membrane became depolarised to between –55 and –45 mV. Thus, the EMcalculated here in the present
study suggests a white muscle depolarisation in ammonia-exposed fish that would be sufficient to cause little or no electrical excitability.
Day and Butler (Day and Butler, 1996) found impaired swimming performance in brown trout exposed to sublethal pH, and the fish showed an accumulation of ammonia in the plasma and tissue. Electromyographic recordings showed that recruitment of white muscle during swimming did not occur in such trout. In the present study, tailbeat frequencies were similar between ammonia-exposed and control trout when these groups were swimming at a common speed. However, the ammonia-exposed trout were unable to achieve the same maximum tailbeat frequency as the control fish. In rainbow trout, white muscle starts to provide a contribution to swimming activity when the animals are exercising at or above 80 % of Ucrit (Taylor et al., 1995). Thus, depolarisation and
inexcitability of white muscle fibres in the ammonia-exposed trout may have inhibited any contribution by these fibres to performance, leading to a reduced maximum tailbeat frequency and Ucrit.
In line with this theory, it is interesting to note that control and ammonia-exposed fish had similar tissue ammonia levels
(1)
[NH4+]i [NH4+]e ln
RT zF
in white muscle, regardless of Ucrit reached. It appears that
ammonia levels may accumulate in muscle tissue during exercise up to a concentration that interferes with muscle function and thus, hinders the fish’s ability to maintain swimming at higher speeds. It is possible that ammonia-exposed fish reached this concentration of tissue ammonia in white muscle sooner than control fish (and hence, had lower Ucritvalues), due to a higher tissue ammonia concentration in
resting fish. This elevation of tissue ammonia concentration is a consequence of raised plasma ammonia concentration compared to control fish. A higher initial concentration of tissue ammonia in ammonia-exposed fish would result in a lower scope for ammonia production during exercise. Consequently, ammonia-exposed fish have a lower Ucrit. It would have been
interesting to sample tissue ammonia levels in resting fish for this comparison.
It is important to consider that the nervous system may be also vulnerable to NH4+ induced depolarisation. However, if
this were the case, one might expect nerve transmission to be affected at all levels of activity, not just at the upper range of activity i.e. Ucrit. Recent research conducted on brown trout
previously exposed to copper and acid and consequently subjected to high internal ammonia concentrations (M. W. Beaumont and E. W. Taylor, unpublished observations), found that peripheral electrical stimulation of a spinal nerve resulted in muscle contractions. Therefore, it appears that the nerve system was functional.
There is evidence of a decline in the total ammonia content of plasma during swimming in both control and exposed fish (Fig. 2). In particular, five out of the six ammonia-exposed fish had lowered plasma ammonia levels while swimming, while that of the remaining fish was constant until Ucrit (all fish showed an increase in plasma ammonia
concentration at Ucrit). The swimming speeds at which the
maximal decline occurred were different among the individual trout, presumably due to natural biological variability. However, if the lowest plasma ammonia values were identified for each fish (regardless of the swimming speed at which they occurred) and averaged within the group, the average maximal decline in plasma ammonia concentration was 12.64±4.01µmol l−1 in the ammonia-exposed animals and
36.42±10.68µmol l−1 in the controls (Fig. 2A). In the
ammonia-exposed fish, the decline in plasma ammonia was significant relative to the value measured at 0.75 BL s−1, when
compared using a paired t-test (Fig. 2A).
In the control fish, a reduction in plasma ammonia levels during aerobic exercise could be due to increased vasodilation in the gills, increased blood flow through the gills, and an increase in the flow rate of water passing over the gills, thus increasing rates of diffusive flux of ammonia. However, the reduction in plasma ammonia levels in the ammonia-exposed trout appeared to occur against a diffusion gradient. Calculation of NH3 concentrations revealed that
ammonia-exposed fish might have been excreting ammonia against an inward NH3gradient of 12.83±0.49µmol l−1when swimming
at 0.75 BL s−1overnight, and of 13.44±0.61µmol l−1NH 3at the
lowest total plasma ammonia concentration found. The reduction in plasma ammonia concentration may be due to increased active NH4+ excretion, where it may be exchanged
for a H+ in freshwater systems, as previously suggested by
Wilson and Taylor (Wilson and Taylor, 1992) working on rainbow trout faced with high inward NH3gradients. It is also
possible that the increased excretion was not as NH4+, but as
NH3into the acidic microenvironment of the gill (Wilson et
al., 1994b). That is, it is possible that estimations of inward NH3 gradients were inaccurate because the calculated
concentrations of NH3were based on the pH of the bulk water,
not the gill microenvironment, and on arterial rather than venous blood. There is now, however, growing evidence for an element of active NH4+excretion, as well as NH3excretion,
when fish are faced with ammonia loading (Salama et al., 1999). Randall et al. (Randall et al., 1999) reported that the mudskipper (Periopthalmodon schlosseri) can excrete NH4+
against a concentration gradient. It might be speculated that a similar active process in the trout was an adaptive response aimed at ameliorating the negative impact of increased body ammonia levels on swimming performance.
In summary, the results of the present study show that sublethal ammonia exposure reduces swimming performance in rainbow trout through multiple, probably interactive, effects and support the conclusions of Beaumont et al. (Beaumont et al. 1995a; Beaumont et al. 1995b; Beaumont et al., 2000a; Beaumont et al., 2000b), who attributed the cause of reduced swimming performance in trout exposed to low pH and copper to ammonia accumulation. Increased MMR and reduced AMR caused a profound reduction in aerobic scope. The increased MMR may reflect a stress response and/or effects of ammonia on the metabolic status of the respiring tissues. The reduced AMR may indicate impaired performance of red muscle that limited maximum work and therefore oxygen uptake. Ammonia also caused depolarisation of white muscle and this may have impeded recruitment and the contribution of these fibres to swimming at the top end of the performance range. Ammonia-exposed fish may increase active ammonia excretion against a concentration gradient when swimming, possibly in an attempt to improve swimming ability.
Whatever the explanation for the observed effect of increased plasma ammonia levels on swimming ability, the phenomenon is important because swimming ability can be a determinant of ecological fitness in fish. The effect of ammonia levels may be of particular significance if it renders the fish incapable of rapid-start burst swimming, which relies on recruitment of white muscle. The greatest consequences of this may be evident in predator avoidance or in catching prey. The sublethal effects of ammonia on exercise performance should, therefore, be considered when establishing guidelines for the threshold concentration for the toxic effects of this pervasive pollutant.
University of Birmingham. We wish to thank two anonymous referees for their comments on the manuscript.
References
Alsop, D. H. and Wood, C. M. (1997). The interactive effects of feeding and
exercise on oxygen consumption, swimming performance and protein usage in juvenile rainbow trout (Oncorhynchus mykiss). J. Exp. Biol. 200, 2337–2346.
API (1981). The sources, chemistry, fate and effects of ammonia in aquatic
environments. Washington DC, American Petroleum Institute. 145 pp.
Beamish, F. W. H. (1978). Swimming Capacity. In Fish Physiology Vol. VII
(ed. W. S. Hoar and D. J. Randall), pp. 101–187. New York, Academic Press.
Beaumont, M. W., Butler, P. J. and Taylor, E. W. (1995a). Exposure of brown
trout, Salmo trutta, to sub-lethal copper concentrations in soft acidic water and its effects upon sustained swimming performance. Aq. Toxicol. 33, 45–63.
Beaumont, M. W., Butler, P. J. and Taylor, E. W. (1995b). Plasma ammonia
concentration in brown trout (Salmo trutta) exposed to acidic water and sublethal copper concentrations and its relationship to decreased swimming performance. J. Exp. Biol. 198, 2213–2220.
Beaumont, M. W., Butler, P. J. and Taylor, E. W. (2000a). Exposure of
brown trout, Salmo trutta, to a sub-lethal concentration of copper in soft acidic water: effects upon muscle metabolism and membrane potential. Aq.
Toxicol. 51, 259–272.
Beaumont, M. W., Taylor, E. W. and Butler, P. J. (2000b). The resting
membrane potential of white muscle from brown trout (Salmo trutta) exposed to copper in soft, acidic water. J. Exp. Biol. 203, 2229–2236.
Boutilier, R. G., Heming, T. A. and Iwama, G. K. (1984). Physico–chemical
parameters for use in fish respiratory physiology. In Fish Physiology Vol. IX (ed. W. S. Hoar and D. J. Randall), pp. 401–430. New York, Academic Press.
Brett, J. R. (1958). Implications and assessments of environmental stress. In
The Investigation of Fish-power Problems (ed. P. A. Larkin), pp. 69–93.
University of BC, Institute of Fisheries.
Brett, J. R. (1964). The respiratory metabolism and swimming performance
of young sockeye salmon. J. Fish. Res. Bd. Can. 21, 1183–1226.
Brett, J. R. and Zala, C. A. (1975). Daily pattern of nitrogen excretion and
oxygen consumption of sockeye salmon (Oncorhynchus nerka) under controlled conditions. J. Fish. Res. Bd. Can. 32, 2479–2486.
Butler, P. J., Day, N. and Namba, K. (1992). Interactive effects of seasonal
temperature and low pH on resting oxygen uptake and swimming performance of adult brown trout Salmo trutta. J. Exp. Biol. 165, 195–212.
Day, N. and Butler, P. J. (1996). Environmental acidity and white muscle
recruitment during swimming in the brown trout (Salmo trutta). J. Exp. Biol.
199, (1947–1959.
Fry, F. E. J. (1971). The effect of environmental factors on the physiology of
fish. In Fish Physiology Vol. VI. (ed. W. S. Hoar and D. J. Randall), pp. 1–87. Academic Press, New York.
Hillaby, B. A. and Randall, D. J. (1979). Acute ammonia toxicity and
ammonia excretion in Rainbow trout (Salmo gairdneri). J. Fish. Res. Bd.
Can. 36, 621–629.
Jenerick, H. P. (1956). The relations between prepotential, resting potential
and latent period in frog muscle fibres. J. Gen. Physiol. 39, 773–787.
Katunuma, N., Okada, M., Nishii, Y. (1966). Regulation of the urea cycle
and TCA cycle by ammonia. In Advances in Enzyme Regulation, vol 4 (ed. G. Weber), pp. 317-335. London: Pergamon Press.
Kirschner, J. B. (1995). Energetics of osmoregulation in fresh-water
vertebrates. J. Exp. Zool. 271, 243–252.
Knoph, M. B. and Olsen, Y. A. (1994). Subacute toxicity of ammonia to Atlantic
salmon (Salmo salar L.) in seawater: effects on water and salt balance, plasma cortisol and plasma ammonia levels. Aq. Toxicol. 30, 295–310.
Kun, E. and Kearney, E. B. (1974). Ammonia. In Methods of Enzymatic
Analysis, vol. 4 (ed. H. U. Bergmeyer), pp. 1802–1806. London: Verlag
Chemie Academic Press.
Lauren, D. J. and McDonald, D. G. (1985). Effects of copper on branchial
ionoregulation in the rainbow trout, Salmo gairdneri Richardson. J. Comp.
Physiol. 155B, 635–644.
Mommsen, T. P. and Hochachka, P. W. (1988). The purine nucleotide cycle
as two temporally separated metabolic units: a study on trout muscle.
Metabolism 37, 552–556.
Morgan, J. D. and Iwama, G. K. (1991). Effects of salinity on growth,
metabolism and ion regulation in juvenile Rainbow and Steelhead trout (Oncorhynchus mykiss) and Fall Chinook salmon (Oncorhynchus
tshawytscha). Can. J. Fish. Aq. Sci. 48, 2083–2094.
Morgan, J. D. and Iwama, G. K. (1996). Cortisol-induced changes in oxygen
consumption and ionic regulation in coastal cuttrhoat trout (Oncorhynchus
clarki clarki) parr. Fish Physiol. Biochem. 15, 385–394.
Morgan, J. D. and Iwama, G. K. (1999). Energy cost of NaCl transport in
isolated gills of cutthroat trout. Am. J. Physiol. 277, R631–R639.
Mutch, B. J. C. and Bannister, E. W. (1993). Ammonia metabolism in
exercise and fatigue: a review. Med. Sci. Sports. Ex. 15, 41–50.
Pörtner, H. O., Boutillier, R. G., Tang, Y. and Toews, D. P. (1990).
Determination of intracellular pH and PCO2after metabolic inhibition by
fluoride and nitrilotriacetic acid. Resp. Physiol. 81, 255–274.
Randall, D. J. and Brauner, C. (1991). Effects of environmental factors on
exercise in fish. J. Exp. Biol. 160, 113–126.
Randall, D. J., Wilson, J. M., Peng, K. W., Kok, T. W. K., Kuah, S. S. L., Chew, S. F., Lam, T. J. and Ip, Y. K. (1999). The mudskipper,
Periophthalmodon schlosseri, actively transports NH4+ against a
concentration gradient. Am. J. Physiol. 277, R1562–R1567
Salama, A., Morgan, I. J. and Wood, C. M. (1999). The linkage between
Na+uptake and ammonia excretion in rainbow trout: kinetic analysis, the
effects of (NH4)2SO4and NH4HCO3infusion and the influence of gill
boundary layer pH. J. Exp. Biol. 202, 697–709.
Sjogaard, G. (1991). Role of exercise-induced potassium fluxes underlying
muscle fatigue: a brief review. Can. J. Physiol. Pharmacol. 69, 238–245.
Smart, G. (1976). The effect of ammonia exposure on gill structure of the
Rainbow trout (Salmo gairdneri). J. Fish Biol. 8, 471–475.
Sola, F., Isaia, J. and Masoni, A. (1995). Effects of copper on gill structure
and transport function in the Rainbow trout, Oncorhynchus mykiss. J. App.
Toxicol. 15, 391–398.
Sovio, A., Westman, K. and Nyholm, K. (1972). Improved method of dorsal
aorta catheterization: haematological effects followed for three weeks in rainbow trout (Salmo gairdneri). Finnish Fish Res. 1, 11–21.
Stagg, R. M. and Shuttleworth, T. J. (1982a). The accumulation of copper
in Platichthys flesus L. and its effects on plasma electrolyte concentrations.
J. Fish Biol. 20. 491–500.
Steffensen, J. F., Johansen, K. and Bushnell, P. G. (1984). An automated
swimming respirometer. Comp. Biochem. Physiol. 79A, 437–440.
Taylor, S. E., Eggington, S., Taylor, E. W. (1996). Seasonal temperature
acclimisation of rainbow trout: cardiovascular and morphometric influences on maximal sustainable exercise level. J. Exp. Biol. 199: 835–845.
Towle, D. W. and Holleland, T. (1987). Ammonium ions substitute for K+
in ATP-dependent Na+transport by basolateral membrane veshicles. Am. J. Physiol. 252, R479–R489.
US Environmental Protection Agency (1998). Addendum to ‘Ambient water
quality criteria for ammonia – 1984’. National Technical Information Service, Springfield, VA, USA.
Waiwood, K. G. and Beamish, F. W. H. (1978). Effects of copper, pH and
hardness on the critical swimming speed of rainbow trout (Salmo gairdneri Richardson). Water Res. 12, 611–619.
Wang, Y., Heigenhauser, G. J. F. and Wood, C. M. (1994). Integrated
responses to exhaustive exercise and recovery in rainbow trout white muscle: Acid–base, phosphogen, carbohydrate, lipid, ammonia, fluid volume and electrolyte metabolism. J. Exp. Biol. 195, 227–258.
Wang, Y., Heigenhauser, G. J. F. and Wood, C. M. (1996). Ammonia
movement and distribution after exercise across white muscle cell membranes in rainbow trout. Am. J. Physiol. 271, R738–R750.
Wendelaar Bonga, S. E. (1997). The stress response in fish. Physiol. Rev. 77,
591–625.
Wilson, R. W., Bergman, H. L. and Wood, C. M. (1994a). Metabolic costs
and physiological consequences of acclimation to aluminium in juvenile rainbow trout (Oncorhynchus mykiss). 2. Gill morphology, swimming performance, and aerobic scope. Can. J. Fish. Aq. Sci. 51, 527–535.
Wilson, R. W. and Taylor, E. W. (1992). Transbranchial ammonia gradients
and acid–base responses to high external ammonia in rainbow trout (Oncorhynchus mykiss) acclimated to different salinities. J. Exp. Biol. 166, 95–112.
Wilson, R. W. and Taylor, E. W. (1993). The physiological responses of
freshwater rainbow trout, Oncorhynchus mykiss, during acutely lethal copper exposure. J. Comp. Physiol. 163B, 38–47.
Wilson, R. W., Wright, P. M., Munger, S. and Wood, C. M. (1994b).
Ammonia excretion in freshwater rainbow trout (Oncorhynchus mykiss) and the importance of gill boundary layer acidification: lack of evidence for Na+/NH
4+exchange. J. Exp. Biol. 191, 37–58.
Ye, X. and Randall, D. J. (1991). The effect of water pH on swimming
performance in rainbow trout (Salmo gairdneri R.). Fish Physiol. Biochem.