Cut the Crap
A method to determine the business value of electronic documents
Michiel Bax 1/2/2010
Master of Science Graduation Thesis
Author
Michiel Bax 0004723
Industrial Engineering & Management
Track Information Technology & Management
Thesis Committee
School of Management and Governance
Dr. A.B.J.M. (Fons) Wijnhoven Dr. C. (Chintan) Amrit
Financial Services Sector NL
Alexander Bijl Hans van Rijs
Cut the Crap
Summary 5 | P a g e
SUMMARY
Research Background
We are living in the information age. Never before information was so widely available, the Internet and the use of ICT in organizations have helped to make this possible. The number of information systems in organizations is growing and the systems are becoming more complex. As a result, the global accumulation of data was 5 Exabyte (1018) in 2002. The accumulation of data is becoming less and less controlled. The uncontrolled accumulation of data results in a number of problems for organizations:
- People are spending on average 25% of their time looking for information. - More storage is needed with higher hardware, software and service costs. - The risk of losing important information increases.
Information Lifecycle Management (ILM) has been developed with the goal to store data on the appropriate medium that provides the service level that is required in the phase of the lifecycle the data is in. At the end of the lifecycle the data is either archived or deleted, this way ILM aims to reduce the proliferation of data. The business value of data forms the basis to guide the data though its lifecycles.
Determining the business value of data is complex because data value is resistant to quantitative measurement. The goal of this research is to find a method that can be used to determine the business value of data in a practical way. This research focuses on the business value of electronic documents.
Research Approach
This research starts with a structured literature review to search for suitable data valuation methods. Based on the outcomes of the structured literature review the ACE framework is selected as data valuation method. The ACE framework uses policies to determine the business value to documents. Earlier research showed that it is difficult for business people to understand how these policies have to be specified. Earlier research also showed that specifying the policies is a complex and time consuming task. The next section of the research therefore focuses on developing a method that can be used to specify the policies in the ACE framework.
The goal of the policy specification method is to determine the business value of electronic documents by measuring the behavior of electronic documents and the characteristics of the users of documents. The behavior of documents is measured with ‘file system metadata’. The metadata provides information about document type, document age, last modification time of the document, document size, amount of use and document location. The position that the user of a document has in the organization is included as user characteristic.
To test if it possible to determine a business value based on document behavior, a field test is conducted. In the field test the business value of documents is determined by the users using an
‘Cut the Crap’ MSc. Thesis – Michiel Bax 6 | P a g e To evaluate the usefulness and practicality of the designed method, experts are interviewed. In these interviews the designed method and the results from the field test are discussed.
Research Results
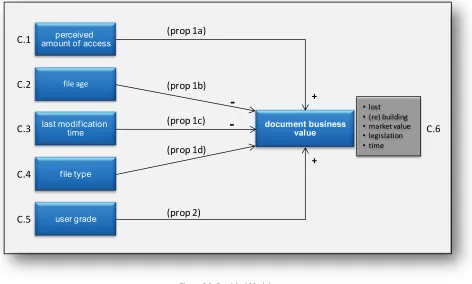
The field test showed the following causal relations between document behavior and the business value of documents (see also figure 0.1):
- The business value is higher when:
o The perceived amount of use is higher. o The last modification time is more recent.
- The business value lowers as the document becomes older.
- A higher grade of the user that completes the questionnaire results in a higher business value.
Figure 0.1: Research Findings
The interviews show many possible applications for the designed method in practice. Some examples are:
- To select valuable documents to publish on a knowledge portal.
- To help business people that have to decide which documents should be migrated to a new storage environment and which documents should be deleted or archived.
- To reduce the gap between the work of archivists and the business environment.
The experts support the use of a questionnaire because it allows business people to easily quantify the business value of a document. Furthermore, the questionnaire makes people aware the differences in business value of documents. They find the use of the questionnaire useful and practical.
Using the causal relations between file behavior and business value to specify policies and to determine the business value of documents for which the business value is unknown, sounds promising to the experts. The experts also indicate that this approach needs more testing before if it is reliable enough to use in practice.
file age last modification time document business value user grade perceived amount of access
+ +
-Preface 7 | P a g e
PREFACE
This thesis is the ‘piece the resistance’ of my educational career (so far). My study started with moving to Enschede, this also meant leaving the safety of my childhood home. With this change a time of exploration started, an exploration of, a new environment, new freedoms and of oneself. Because of my desired thoroughness in exploration, some explorations took a bit longer than average. I am proud that these explorations in the end also led me to this research which has proven to be the last but definitely not the least exploration so far.
This document is the result of years of work, study, interesting courses, not so interesting courses, extracurricular activities, sports, research, parties, hangovers, reading, vacations, discussions, friendships, love and above all fun! Completing my master thesis and the rest of my study is something that I could not have done alone. I would therefore like to use this opportunity to thank everyone who helped me along the way.
Capgemini thankfully provided me with all the freedom that can be needed to do a master research. I thank Alexander and Hans for the inspirational discussions, interesting conversations and good advice that I have received from them. I also thank all my fellow graduation students at Capgemini who helped me along the way with coffee breaks and other welcome distractions.
During the research I have enjoyed the visits to Fons and Chintan in Enschede. Fons, I still wonder how you managed to read through all my work every time. Thanks for the fruitful discussions, for challenging me to give my best and of course for all the laughter. Your enthusiasm is a welcome source of energy that keeps me focused on my work. Chintan, thank you for the flexibility to join in my research project when it was already so close to the finish line.
I also thank all my fellow students and friends in Enschede who made my time in Enschede more than worthwhile. A very special thanks goes out to my parents. I know that I caused some worries over the years. And I am very grateful for your support with everything that I did. I could not have done it without your help and patience, thank you. Last but definitely not least I would love to thank the girl of my life. Iris, I cannot describe how much your patience, advice and inspiration helped me to complete this research. I look forward to spending my free time together with you.
I dedicate my thesis to a person which always has been a great inspiration for me; my grandfather Dr. W.A. Bax who unfortunately passed away before I finished my study.
Michiel Bax
Table of Contents 9 | P a g e
TABLE OF CONTENTS
Summary ... 5
Preface ... 7
Table of Contents ... 9
List of Figures ... 12
List of Tables ... 13
List of Used Abbreviations ... 14
1 Research Introduction ... 15
1.1 Problem Background ... 15
1.2 Research Initalization ... 20
1.3 Design Science Guidelines ... 22
2 Literature Review ... 25
2.1 Literature Review Methodology ... 25
2.1.1 Top MIS Journals ... 25
2.1.2 Selecting a Search Engine ... 26
2.1.3 Selection Criteria and Keywords ... 27
2.1.4 Searching for Article ... 28
2.2 Literature Review Results ... 30
2.2.1 Selection Criteria ... 31
2.2.2 Selected Valuation Methods ... 31
2.2.3 Assesment Of Methods ... 39
2.3 Summary ... 42
3 Conceptual Policy Specification Method ... 43
3.1 Relevant parts of the ACE framework ... 43
3.2 Policies in the ACE Framework... 44
3.2.1 Business Value ... 44
‘Cut the Crap’ MSc. Thesis – Michiel Bax 10 | P a g e
4 Method Evaluation ... 49
4.1 Propositions ... 49
4.2 Data Collection ... 52
4.3 Design and Testing ... 53
4.4 Conducting the Field Test ... 56
5 Results Method Valuation ... 57
5.1 Descriptive Statistics ... 57
5.2 Reliability Analysis ... 59
5.2.1 Factor Analysis ... 59
5.2.2 Cronbach’s Alpha & Item Reliability Index ... 60
5.3 Testing Propositions ... 61
5.3.1 Proposition 1a ... 62
5.3.2 Proposition 1b ... 62
5.3.3 Proposition 1c ... 63
5.3.4 Proposition 1d ... 63
5.3.5 Proposistion 1 ... 64
5.3.6 Proposition 2 ... 64
5.4 Findings Field Test ... 65
6 Evaluating the Designed Method in Practice ... 67
6.1 Goal of this section ... 67
6.2 Approach ... 67
6.3 Results ... 68
6.3.1 How can this method help you in your projects? ... 68
6.3.2 What do you consider to be strong points in this method? ... 69
6.3.3 What do you consider to be the weaker points in this method? ... 70
6.3.4 Can you think of a useful contribution to my method? ... 71
Table of Contents 11 | P a g e
7 Research Findings ... 75
7.1 Conclusions ... 75
7.2 Limitations ... 77
7.3 Contributions for the Academic Field ... 78
7.4 Contributions for Practice ... 79
7.5 Recommendations ... 79
7.6 Final Thoughts ... 81
8 References ... 83
9 Appendices ... 89
Appendix I: Capgemini ... 90
Appendix II: Microsoft Office SharePoint Server 2007 ... 91
Appendix III: information value Questionnaire ... 93
Appendix IV: The Questionnaire application ... 94
Appendix V: Invitation for the questionnaire ... 100
‘Cut the Crap’ MSc. Thesis – Michiel Bax 12 | P a g e LIST OF FIGURES
Figure 0.1: Research Findings ... 6
Figure 1.1: ILM Lifecycle ... 18
Figure 1.2: Data Value Changes over Time ... 19
Figure 1.3: Design Science Guidelines Textbox Template ... 23
Figure 2.1: Used Scopus Query ... 27
Figure 2.2: Search Results ... 29
Figure 2.3: ACE Architecture ... 36
Figure 2.4: Mapping of business value to the importance of data ... 37
Figure 2.5 :Table showing some sample data classification policies for different domains. ... 37
Figure 2.6: Attributes that have been mined for data classification in the ACE research. ... 38
Figure 3.1: Data Classification Engine Architecture ... 43
Figure 4.1: Empirical Model ... 51
Figure 5.1: Distribution of Grades in Responses ... 57
Figure 5.2: Relative Response Rate per Grade ... 58
Figure 5.3: Distribution of Document Types ... 58
Figure 5.4: Scree plot ... 60
Figure 7.1: Research Findings ... 76
Figure I.1: Structure Capgemini NL ... 90
Figure IV.1: Welcome Page of the Survey ... 95
Figure IV.2: Selecting the Documents ... 96
Figure IV.3: The Information Value Questionnaire in the Survey ... 97
Figure IV.4: Final Question ... 98
Figure IV.5: Final Page of the Survey ... 99
Figure V.1: Dutch invitation for the Survey ... 100
Table of Contents 13 | P a g e LIST OF TABLES
Table 1.1: Seven Guidelines for Design Research ... 22
Table 2.1: Top 25 MIS Journals (based on AIS Journal rankings ... 26
Table 2.2: Used Keywords ... 28
Table 2.3: Data Valuation Methods ... 30
Table 2.4: Assessment of Methods ... 41
Table 3.1: Metadata Attributes in a Windows File System ... 48
Table 4.1: Collected Attributes in the Metadata ... 52
Table 4.2: Grades at Capgemini ... 52
Table 4.3: Constructs in Detail ... 53
Table 5.1: KMO and Bartlett's Test ... 59
Table 5.2: Communalities ... 60
Table 5.3: Component Matrix ... 60
Table 5.4: Crrected Item-Total Correlation ... 61
Table 5.5: Cronbach's Alpha if Item Deleted ... 61
Table 5.6: Propositions ... 61
Table 5.7: Summary Regression Analysis (Perceived Amount of Access – DBV) ... 62
Table 5.8: Summary Regression Analysis (Document Age – DBV) ... 62
Table 5.9: Summary Regression Analysis (Last Modification Time – DBV) ... 63
Table 5.10: Summary One-Way Independent ANOVA (Document Type – DBV) ... 63
Table 5.11: Summary Regression Analysis (User Grade – DBV)... 64
‘Cut the Crap’ MSc. Thesis – Michiel Bax 14 | P a g e
LIST OF USED ABBREVIATIONS
DBV Document Business Value
DCE Data Classification Engine
ECM Enterprise Content Management
ECMS Enterprise Content Management System ICT Information Communication Technology
ILM Information Lifecycle Management
IS Information System
IVQ Information Value Questionnaire
MOSS2007 Microsoft Office SharePoint Server 2007 SNIA Storage Network Industry Association
Chapter 1: Research Introduction 15 | P a g e
Chapter 1
1
RESEARCH INTRODUCTION
This research is conducted to find a practical way to determine the business value of data that is stored in the information systems of organizations. To explain why this is an important issue, first the problem of data proliferation will be introduced. This is followed by an introduction of the concepts of Enterprise Content Management and Information Lifecycle Management and the valuation of data. Based on this introduction the research will be initialized. In the initialization a problem statement and research question for the research is formulated.
1.1 PROBLEM BACKGROUND
We are living in the information age. Never before information was so widely available, the Internet and the use of ICT in organizations have helped to make this possible. The number of information systems in organizations is growing and the systems are becoming more complex. Also, people have become used to collecting and storing large amounts of data in their personal archives. As a result, the global accumulation of data was 5 Exabyte (1018) in 2002 (Lynman & Varian, 2003). Every year, the accumulation of data is growing with an average rate of more than 30% (Lynman & Varian, 2003).
Rapid growing accumulation of data in itself does not have to be problematic. The growth of data is however becoming less and less controlled. The data is proliferating. Proliferation is defined as; “to grow by rapid production of new parts, cells, buds, or offspring” (Merriam-Webster, 2009a). The proliferation of data results in a exponential growth of unstructured data, such as e-mail archives, intranet pages and archives which are growing at a rate of 25-30 percent a year (Govil, Kaur, Kaur, & Govil, 2008; IBM, 2006).
‘Cut the Crap’ MSc. Thesis – Michiel Bax 16 | P a g e The proliferation of data results in a number of practical problems for organizations. It becomes harder to retrieve data promptly, more people are needed to manage all the stored data and required networks and application performance suffers because of the excess traffic that is generated by users searching again and again for data (IBM, 2006).
Besides the practical problems, the proliferation of data also results in more costs for organizations. Even though storage on a cost-per-gigabyte basis keeps declining at a steady rate, the consumption of storage is growing much faster. This results in ever increasing expenses for data storage. While vendors continue to market hardware as a way to reduce the total costs of ownership (TCO) of storage, hardware costs account for not more than 30% of the TCO. In reality, service or labor costs are the primary factors of the TCO of storage (Tallon & Scannell, 2007). Even though hardware only accounts for a small part of IT costs, storage is already consuming about 10-15% of IT budgets at the moment. CIOs fear that any further increase could seriously erode strategic IT spending (Tallon & Scannell, 2007).
The ability to effectively use information is limited for human beings. If too much information is available there is a risk for ‘information overload’. Information overload results in inefficiencies, ineffectiveness and a lower level of decision accuracy and decision quality (Edmunds & Morris, 2000; Eppler & Mengis, 2004). One of the major costs that is incurred by organizations is the large amount of time that people spent on the search for specific data, let alone the accuracy and quality of decision making which is also affected. Research shows that the average knowledge worker is spending almost a quarter of the day looking for data either internally or externally (Smith & McKeen, 2003). This means that someone who is working a full working-week spends more than one day every week looking for information.
Chapter 1: Research Introduction 17 | P a g e ENTERPRISE CONTENT MANAGEMENT
Enterprise Content Management (ECM) is an integrated approach to managing all of an organization’s information including paper documents, data, reports, web pages, and digital assets. ECM is used to create structures in the information of an organization. This structure is used to stop the proliferation of data. ECM is defined as;
“The strategies, tools, processes and skills an organization needs to manage all its information assets (regardless of type) over their lifecycle” (Smith & McKeen, 2003).
Enterprise Content Management Systems (ECMS) are systems that are used to support Enterprise Content Management (ECM) activities. Establishing principles and standards for the retention, preservation and disposal of data in an ECMS is an important issue (Smith & McKeen, 2003). As ECM grows to become a corporate strategy for managing all forms of content, this issue will become an increasingly complex challenge (Smith & McKeen, 2003). To increase the control on the proliferation of data in organizations and their ECMSs, information lifecycle management is developed (Govil, et al., 2008; Middleton & Smith, 2002; Peterson & Pierre St., 2004; Reiner, Press, Lenaghan, Barta, & Urmston, 2004; Tallon & Scannell, 2007; Wrozek, 2001). This concept is therefore introduced next.
INFORMATION LIFECYCLE MANAGEMENT
Information Lifecycle Management (ILM) is an information management standard developed by the Storage Network Industry Association (SNIA). SNIA defines ILM as;
“Information Lifecycle Management is comprised of the policies, processes, practices, and tools used to align the business value of information with the most appropriate and cost effective IT infrastructure from the time information is conceived through its final disposition. Information is aligned with business requirements through management policies and service levels associated with applications, metadata, and data” (Peterson & Pierre St., 2004).
‘Cut the Crap’ MSc. Thesis – Michiel Bax 18 | P a g e According to the SNIA, the lifecycle of data consists of four stages. The first stage is the creation of new data or the modification of existing data. In the second stage the data is transferred to others using for instance digital, written or verbal communication. When transferred, the data is accessed and used, this is the third stage. After a period of usage the data is either archived or deleted. The final stage is called retention. The ILM lifecycle is illustrated in Figure 1.1.
Figure 1.1: ILM Lifecycle
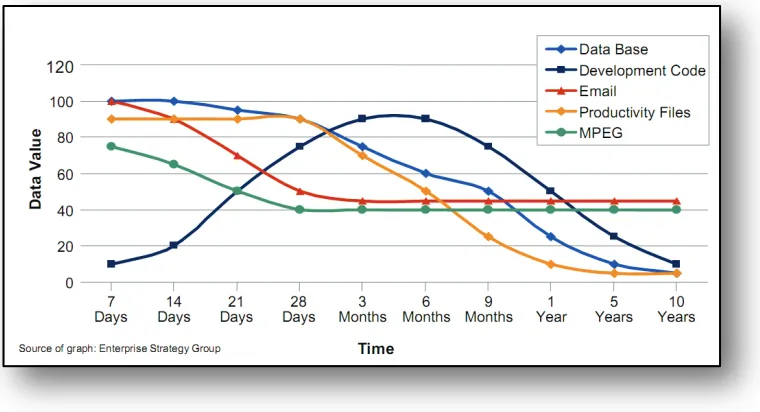
Because data is eventually replaced by new data or becomes less relevant as a result of new developments, the value of data follows a trend (Tallon & Scannell, 2007). Throughout the lifecycle the value of data in general grows after the first stage and declines again in the final stage. With the decreasing value of data, the intensity of usage decreases and the accessibility of data becomes less important. However, not all types of data have the same value and the way the value evolves over time can also depend on the type of data. Figure 1.2 shows some examples of how the value of different types of data can change over time.
Creation / Modification
Transfer
Chapter 1: Research Introduction 19 | P a g e
Figure 1.2: Data Value Changes over Time (Haeusser, Osuna, Bosman, Jahn, & Tarella, 2007)
In order to use ILM in data warehouses the storage infrastructure has to be structured around the changing business value of data. This is a difficult and time consuming process (Shah, Voruganti, Shivam, & Alvarez, 2006). One of the most important steps towards a successful ILM implementation is the ability to differentiate data by values in an unbiased manner and understand how the value changes over time (Chen, 2005). To do so, the value of data needs to be determined. This is therefore introduced in the next section.
DETERMINING THE VALUE OF DATA
Determining the value of data has proven to be difficult. According to research, the valuation of data is a complex problem because data value is resistant to quantitative measurement (Moody & Walsh, 1999; Reiner, et al., 2004; Tallon & Scannell, 2007). Determining the value of data is essential for ILM. Proper data classification is considered as the corner -stone of ILM (EMC, 2003; L. Turczyk, 2009; L; Turczyk, Frei, Liebau, & Steinmetz, 2008). And the core of data classification lies in appropriate data valuation (Chen, 2005). The valuation is used to determine the alignment of data and the appropriate IT infrastructure (Chen, 2005; Matthesius & Stelzer, 2008; Middleton & Smith, 2002; Peterson & Pierre St., 2004; Reiner, et al., 2004; Shah, et al., 2006; Tallon & Scannell, 2007; L; Turczyk, et al., 2008; L; Turczyk, Groepl, Liebau, & Steinmetz, 2007; Wrozek, 2001).
‘Cut the Crap’ MSc. Thesis – Michiel Bax 20 | P a g e 1.2 RESEARCH INITALIZATION
The initialization begins with scoping the problem environment for the research. Based on the research scope and the problem background above, a problem statement and research question is formulated.
SCOPING THE RESEARCH
Microsoft Office SharePoint Server 2007 (MOSS2007) is an ECMS. Capgemini expects that MOSS2007 will be flourishing in years to come. A problem in the use of MOSS2007 is the proliferation of data in the system. To reduce this problem, Capgemini is looking for ways to extend the capabilities of MOSS2007. More specifically, the ability of MOSS2007 in supporting the ILM concept. The scope regarding ECMS’s for this research is therefore limited to MOSS2007. A more detailed description of MOSS2007 is available in Appendix II: Microsoft Office SharePoint Server 2007.
Chapter 1: Research Introduction 21 | P a g e RESEARCH PROBLEM
In the previous section the background of this research is discussed. A couple of problems are identified. To summarize, the most important problems are;
o The proliferation of data results in inefficiencies, higher costs, increased security risks and a lower quality of decision making
o Information Lifecycle Management is ineffective without a method to determine the business value of data
o Determining the business value of data is a complex task
These problems are related in a sense that resolving them starts with resolving the last problem first. This research therefore focuses on resolving the last problem; determining of the business value of data. The goal is to determine the business value that is stored in an ECMS in a practical way. The problem statement for this research is therefore;
RESEARCH QUESTION
The problem statement that is formulated in the previous section is a design problem. To solve the problem of determining the business value of electronic documents a method has to be found or designed. Therefore the following research question has to be answered in order to solve the research problem;
Problem Statement
“It is not yet possible to determine the business value of electronic documents in a practical way.”
Research Question
‘Cut the Crap’ MSc. Thesis – Michiel Bax 22 | P a g e 1.3 DESIGN SCIENCE GUIDELINES
As stated in the previous section, the goal of this research is to find or design a method for determining the business value of documents in a practical way. To structure the search and design process, design science guidelines for information systems research are used. These guidelines are introduced in this section.
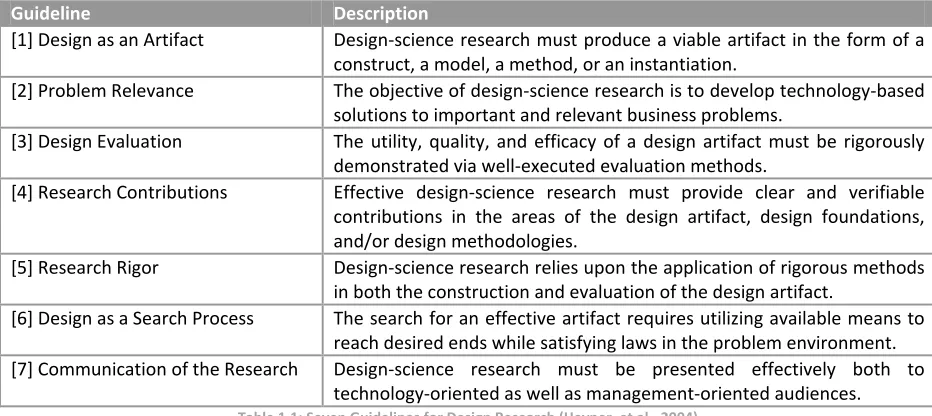
In their article from 2004, Hevner et. al. provide a general framework to guide information system researchers and practitioners in how to conduct, evaluate, and present design science research (Hevner, March, Park, & Ram, 2004). The work that is presented here aims to exemplify this design research approach by applying the seven guidelines as they are introduced by Hevner et. al. (2004). These seven guidelines are described in table 1.1.
Guideline Description
[1] Design as an Artifact Design-science research must produce a viable artifact in the form of a construct, a model, a method, or an instantiation.
[2] Problem Relevance The objective of design-science research is to develop technology-based solutions to important and relevant business problems.
[3] Design Evaluation The utility, quality, and efficacy of a design artifact must be rigorously demonstrated via well-executed evaluation methods.
[4] Research Contributions Effective design-science research must provide clear and verifiable contributions in the areas of the design artifact, design foundations, and/or design methodologies.
[5] Research Rigor Design-science research relies upon the application of rigorous methods in both the construction and evaluation of the design artifact.
[6] Design as a Search Process The search for an effective artifact requires utilizing available means to reach desired ends while satisfying laws in the problem environment. [7] Communication of the Research Design-science research must be presented effectively both to
[image:22.612.72.538.282.490.2]technology-oriented as well as management-oriented audiences.
Table 1.1: Seven Guidelines for Design Research (Hevner, et al., 2004)
Chapter 1: Research Introduction 23 | P a g e
Design Science Guidelines: [Name of the Guideline]
[No. of] Guideline: [Name of the guideline]
Description: [A short description of the guideline]
Application in Research
[image:23.612.100.518.90.205.2][A short summary that explains how the guideline has been applied in the research]
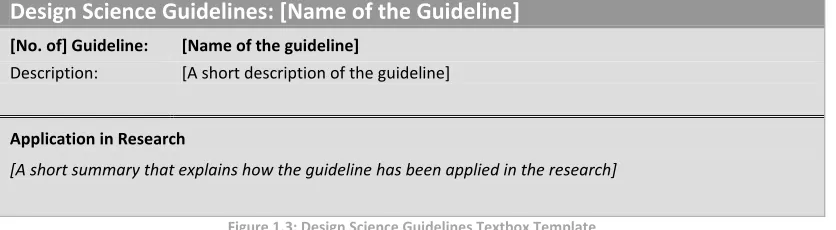
Figure 1.3: Design Science Guidelines Textbox Template
When a design science guideline is successfully applied, a similar textbox is presented that summarizes the application of the guideline.
The second guideline; ‘Problem Relevance’ is applied in this chapter. The textbox below shows how this guideline is applied.
Design Science Guidelines: Problem Relevance
Second Guideline: Problem RelevanceDescription: Effective design-science research must provide clear and verifiable contributions in the areas of the design artifact, design foundations, and/or design methodologies. (Hevner, et al., 2004).
Application in Research
Chapter 2: Literature Review 25 | P a g e
Chapter 2
2
LITERATURE REVIEW
The goal of this research is to find a method for measuring the business value of documents in a practical way. The systematic literature review is conducted to find whether such a method is developed. If a suitable method is found, its applicability in practice is evaluated. If no suitable method can be found, the findings from this literature review act as an input for the design of a new, practical method for the valuation of electronic documents.
2.1 LITERATURE REVIEW METHODOLOGY
A literature review is used to find and discuss relevant scientific publications to date. To ensure that all relevant publications are included in the review it is important to use a structured methodology for the literature review. A transparent presentation of the methodology shows the readers that the literature is not selected by random sampling, biased sampling or convenience sampling. Instead a clear, step by step approach is presented, allowing researchers to replicate and validate the search process and its outcomes. A structured approach also saves time and improves the completeness and quality of the outcomes of the literature review.
In this section the different parts of the literature review process are explained. First, the top 25 Management Information Systems (MIS) journals are selected, the journals are used to conduct an initial search for literature (§2.1.1). To perform the search a search engine is selected that covers most of the top 25 MIS journals (§2.1.2). Selection criteria are used to select the articles included in the review. These can be found in §2.1.3 in this section the used keywords are also listed. The results of search process are presented in 2.1.4.
2.1.1 TOP MIS JOURNALS
‘Cut the Crap’ MSc. Thesis – Michiel Bax 26 | P a g e journal and then dividing the total score by the number of rankings. Therefore, a journal that has been ranked a 6th place in one ranking will score 6th place overall. This is for instance the case with the ‘Artificial Intelligence’ journal (AIS, 2009). To reduce this risk, a journal is only included in the top25 if it appears in at least three different rankings.
In the top 25 as published by the AIS there are seven journals which are ranked less than three times. These journals are therefore left out. To come to a total of 25 journals, the first seven journals ranked higher 25th place and ranked more than three times are added to the selection. This results in the selection presented in Table 2.1: Top 25 MIS Journals.
2.1.2 SELECTING A SEARCH ENGINE
To be able to search in a structured way in the journals, a search engine is used. Two examples of search engines are, Web of Science and Scopus. Both of these search engines feature a user friendly user interface and advanced search functionalities. The researcher can specify a set of journals to search and a specific time frame in which articles are published. Furthermore, forward and backward citation analysis is easy because references and citations are indexed.
Scopus is excellent because it covers 22 of the journals in the top 25. Therefore, only three journals are not covered;
o Journal of the AIS
o Journal of Management Systems o Communications of the AIS
Because of the coverage and ease of use, Scopus is used as primary search engine and the three journals not covered by the Scopus search engine are searched manually. To be able to only search in the top 25
Top 25 MIS Journals
1. MIS Quarterly Management Information Systems 14. ACM Transactions
2. Information Systems Research 15. Sloan Management Review 3. Communications of the ACM 16. ACM Computing Surveys
4. Management Science 17. Academy of Management Journal 5. Journal of Management Information Systems 18. Organization Science
6. Decision Science 19. IEEE Transactions on Computers 7. Harvard Business Review 20. Information Systems Journal 8. IEEE Transactions on Computers 21. Administrative Science Quarterly
9. European Journal of Information Systems 22. Data Base for Advances in Information Systems 10. Decision Support Systems 23. Communications of the AIS
11. Information and Management 24. Journal of the AIS
12. ACM Transactions on Database Systems 25. Journal of Management Systems 13. IEEE Transactions on Software Engineering
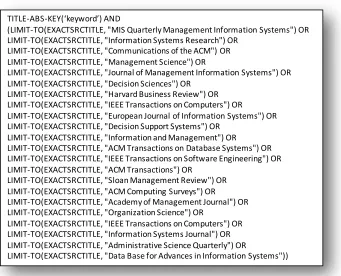
Chapter 2: Literature Review 27 | P a g e MIS journals from Table 1, the advanced search option of Scopus is used. The query used for searching is presented in Figure 2.1.
Figure 2.1: Used Scopus Query
2.1.3 SELECTION CRITERIA AND KEYWORDS
To ensure the quality and relevance of the literature found in the initial search, a number of selection criteria are specified:
o Articles have to be published in the top 25 MIS journals as presented in Table 2.1 o Articles have to be peer reviewed
o Articles are published in the year 2000 or later
o Articles have to be written in English, German or Dutch
Based on the articles that are included in the initial selection, forward and backward citation analysis is used to find more related publications. Rather than making use of the selection criteria defined above, the articles that are found by applying the forward and backward citation analysis, are included based on the relevance of their contents for this research.
TITLE-ABS-KEY(‘keyword’) AND
(LIMIT-TO(EXACTSRCTITLE, "MIS Quarterly Management Information Systems") OR LIMIT-TO(EXACTSRCTITLE, "Information Systems Research") OR
LIMIT-TO(EXACTSRCTITLE, "Communications of the ACM") OR LIMIT-TO(EXACTSRCTITLE, "Management Science") OR
LIMIT-TO(EXACTSRCTITLE, "Journal of Management Information Systems") OR LIMIT-TO(EXACTSRCTITLE, "Decision Sciences") OR
LIMIT-TO(EXACTSRCTITLE, "Harvard Business Review") OR LIMIT-TO(EXACTSRCTITLE, "IEEE Transactions on Computers") OR LIMIT-TO(EXACTSRCTITLE, "European Journal of Information Systems") OR LIMIT-TO(EXACTSRCTITLE, "Decision Support Systems") OR
LIMIT-TO(EXACTSRCTITLE, "Information and Management") OR
LIMIT-TO(EXACTSRCTITLE, "ACM Transactions on Database Systems") OR LIMIT-TO(EXACTSRCTITLE, "IEEE Transactions on Software Engineering") OR LIMIT-TO(EXACTSRCTITLE, "ACM Transactions") OR
LIMIT-TO(EXACTSRCTITLE, "Sloan Management Review") OR LIMIT-TO(EXACTSRCTITLE, "ACM Computing Surveys") OR LIMIT-TO(EXACTSRCTITLE, "Academy of Management Journal") OR LIMIT-TO(EXACTSRCTITLE, "Organization Science") OR
LIMIT-TO(EXACTSRCTITLE, "IEEE Transactions on Computers") OR LIMIT-TO(EXACTSRCTITLE, "Information Systems Journal") OR LIMIT-TO(EXACTSRCTITLE, "Administrative Science Quarterly") OR
‘Cut the Crap’ MSc. Thesis – Michiel Bax 28 | P a g e The keywords or combinations of keywords that are used for the initial literature search are presented in Table 2.2. The keywords are used to search in the Titles, Abstracts and Keywords of articles.
Keywords
information valuation valuing information information life cycle management data valuation information lifecycle management valuing data
Table 2.2: Used Keywords
2.1.4 SEARCHING FOR ARTICLE
In this section the search method is introduced. The results of the search method for the different keywords are also presented in this section.
SEARCH METHOD
The literature search is conducted in May 2009. The query shown in Figure 2.1 is used together with the keywords from Table 2.2 to perform the initial search. Next the titles and abstracts of the initial search results are scanned and the relevant articles are added to the initial selection. Then forward and backward citation analysis is used to extend the set of articles. In forward citation analysis the researcher looks for articles that have referred to the article that he is currently reviewing. This way, more recent relevant articles in the same field of research can be found. Backward citation analysis refers to the process of evaluating the references used in the article that the researcher is currently reviewing. This allows the researcher to identify older relevant articles in the same field of research.
SEARCH RESULTS
Chapter 2: Literature Review 29 | P a g e
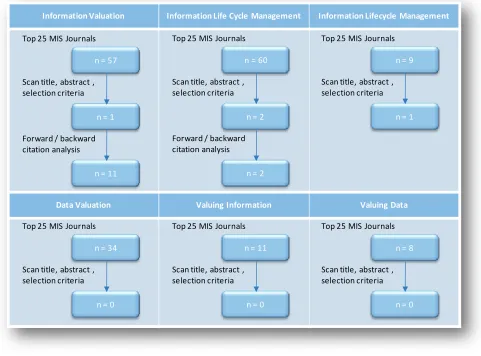
Figure 2.2: Search Results
As can be seen from the search results in Figure 2.2, the literature on the valuation of information is scarce. Applying the selection criteria from §2.1.3 resulted in only 3 articles for all the keywords in Table 2.2. One of the articles in the initial selection; “Information Lifecycle Management” by Tallon and Scannell (2007), referred to an article of Glazer (1993). Using forward citation analysis in combination with the article of Glazer (1993), 10 more usable articles on the valuation of data are found. These articles are also added to the selection.
Information Valuation Information Life Cycle Management Information Lifecycle Management
Data Valuation Valuing Information Valuing Data
Top 25 MIS Journals
Scan title, abstract , selection criteria
Forward / backward citation analysis
n = 57
n = 1
n = 11
Top 25 MIS Journals
Scan title, abstract , selection criteria
Forward / backward citation analysis
n = 60
n = 2
n = 2
Top 25 MIS Journals
Scan title, abstract , selection criteria
n = 9
n = 1
Top 25 MIS Journals
Scan title, abstract , selection criteria
n = 34
n = 0
Top 25 MIS Journals
Scan title, abstract , selection criteria
n = 8
n = 0 Top 25 MIS Journals
Scan title, abstract , selection criteria
n = 11
‘Cut the Crap’ MSc. Thesis – Michiel Bax 30 | P a g e 2.2 LITERATURE REVIEW RESULTS
In this section the results from the literature review are presented. The goal of this literature review is to find the methods that can be used to determine the business value of data for ILM purposes. In total nine different methods have been found in the literature. In table 2.3 an overview of these nine methods is presented. The goal of the method as presented by the author(s), the measures used by the method to perform the valuation are included in the table.
Method Goal of Method Measures
[1] (Chen, 2005) Captures the changing nature of file value throughout the lifecycles and presents the value differences among different files
Amount of use Recency of use
[2] (L; Turczyk, et al., 2008)
Determine the probability of future use of data to store data in a cost effective location
Time since last access
Age of file Number of access File type
[3] (Bhagwan, Douglis, Hildrum, Kephart, & Walsh, 2005)
Laying out storage system mechanisms that can ensure high performance and availability
Amount of use
[4] (Verma, et al., 2005) Optimize storage allocation based on policies Amount of use File type [5] (Mesnier, Thereska,
Ganger, & Ellard, 2004)
Automatically classify the properties of files and predict the properties of files as they are created
Amount of use File type Access mode [6] (Zadok, 2004) Selecting files that can be compressed to reduce the rate
of storage consumption as much as possible
Directory File name User Application [7] (Strange, 1992) Optimize storage in a hierarchal storage management
(HSM) solution
Least recently used
[8] (Gibson & Miller, 1999) Reduce storage consumption on primary storage location Time since last Access [9] (Shah, et al., 2006) Design a data placement plan that provides cost benefits
while allowing efficient access to all important data
[image:30.612.72.541.218.579.2]Metadata User input Policies
Table 2.3: Data Valuation Methods
Chapter 2: Literature Review 31 | P a g e 2.2.1 SELECTION CRITERIA
Other authors mention a number of criteria for a data valuation method for ILM. These criteria are used as selection criteria for the nine valuation methods in table 2.3. The methods that fulfill all of these criteria are discussed in detail in the next section. The selection criteria are;
1. Automatic; the valuation method has to function with little to no human intervention (Chen, 2005; L; Turczyk, et al., 2008),
2. Value over time; the value of data has to be measured over time in the different life stages (Chen, 2005; L; Turczyk, et al., 2008),
3. Multiple criteria; the method has to use multiple criteria for the valuation process (L; Turczyk, et al., 2008),
4. Documents; MOSS2007 is used to store electronic documents; the selected method has to be suitable for the valuation of electronic documents.
All nine data valuation methods on table 2.3 can be automated. They therefore all fulfill the first criterion. In the valuation method of Mesnier [5] the files are only valued at the moment of creation. The value is not measured over time, this method is therefore excluded (criterion 2). The method of Verma is excluded for the same reason (criterion 3). The valuation methods of Strange [7], Bhagwan [3] et. al. and Gibson & Miller [8], are excluded because only one measure is used for the valuation of the data (criterion 3). The valuation method of Verma [4] creates storage pools to manage data storage. Policies are used to transfer the storage pools between different storage locations. This method is not suitable for the valuation of electronic documents because the valuation is focused on the pools in which the data is stored rather than the files or documents belonging to the storage pool (criterion 4).
2.2.2 SELECTED VALUATION METHODS
After applying the selection criteria in the previous section, the initial collection of nine valuation methods is reduced to four methods;
- Usage-over-Time Method (Chen, 2005)
- Probability of Further Use (L; Turczyk, et al., 2008) - Elastic File Quota System (Zadok, 2004)
- The ACE Framework (Shah, et al., 2006)
‘Cut the Crap’ MSc. Thesis – Michiel Bax 32 | P a g e USAGE-OVER-TIME METHOD
Chen has developed a usage-over-time approach to indirectly determine the value of a file or electronic document (Chen, 2005). The approach is based on the two fundamental conjectures;
1. Information value is realized and reflected through its usage 2. Information value changes over time
The second conjecture implicates that it has no use to refer to value of a piece of information without a reference to a specific point in time. Usage may cover multiple aspects of information usage such as usage count, the usage time, the source of usage and the purpose of usage, rather than one specific aspect of usage. The approach that has been developed is based on the usage count and the recency of usage.
The goal of the method is to calculate the value of information in thepresent time. This value is called
the present value. It is therefore assumed that the history of usage serves as an indication of the importance of the information for the present time t. A piece of information is therefore more valuable if it is used more recently and/or it is used more heavily than others.
Another important factor is the length of the period of time which is used to calculate the value of information at time t. This period is called the valuation period. An effective valuation period can be determined by repeating the information valuation with increasing valuation period values and checking of the outcomes change significantly. If this is not the case anymore, the valuation period can be set according to that value.
To incorporate the recency factor, the valuation period is divided into fixed length lifestages. Different weights are assigned to the stages, the more recent the higher the weight.
The overall valuation method is defined as follows (Chen, 2005);
Vt-(𝑑𝑑) = � �w(i) × 𝑓𝑓�𝑈𝑈𝑖𝑖(𝑑𝑑)�� 𝑁𝑁𝑡𝑡
𝑖𝑖=1
, 0 <= 𝑓𝑓�𝑈𝑈𝑖𝑖(𝑑𝑑)� <= 1,
w(i) =
1 χ i
∑Ntj=11χj , ∑ w(i) = 1, χ >= 1 Nt
i=1 (1)
𝜐𝜐 = [ 𝑡𝑡 − (𝑁𝑁𝑡𝑡 × 𝑠𝑠 ), 𝑡𝑡], 𝑁𝑁𝑡𝑡 = 𝜐𝜐𝑠𝑠
Chapter 2: Literature Review 33 | P a g e usage of information 𝑑𝑑 in its lifestagei. Its value is between 0 and 1. The normalization function is presented in formula 2. w(i) is the normalized recency weight for lifestagei. A smaller i represents a more recent lifestage.
𝑓𝑓�𝑈𝑈𝑖𝑖(𝑑𝑑)� has to be normalized to values between 0 and 1. In order to do this a file access count scaling
factor; 𝑐𝑐, is introduced. Selecting must be done with care since sometimes there may be a few outlier files that have much higher access counts than others. If 𝑐𝑐 is too high, only those outliers may be assigned with high values, while all others are assigned with low values even if there are still significant differences among the remaining files in reality. If 𝑐𝑐 is too low, the model will generate high values for most of the files. 𝑓𝑓�𝑈𝑈𝑖𝑖(𝑑𝑑)� is therefore defined as;
�𝑈𝑈𝑖𝑖(𝑑𝑑)� = # access of information 𝑑𝑑 in lifestage i.
𝑓𝑓�𝑈𝑈𝑖𝑖(𝑑𝑑)� = �
1, 𝑈𝑈𝑖𝑖(𝑑𝑑) > 𝑐𝑐; 𝑈𝑈𝑖𝑖(𝑑𝑑)
𝑐𝑐 𝑜𝑜𝑡𝑡ℎ𝑒𝑒𝑒𝑒𝑒𝑒𝑖𝑖𝑠𝑠𝑒𝑒 𝑐𝑐 = 𝑎𝑎𝑠𝑠𝑠𝑠𝑖𝑖𝑎𝑎𝑎𝑎𝑒𝑒𝑑𝑑 𝑣𝑣𝑎𝑎𝑣𝑣𝑣𝑣𝑒𝑒
(2)
Given the same 𝑁𝑁𝑡𝑡 , the larger the χ is, the steeper the weight distribution is. Similarly, given a fixed χ, the larger the 𝑁𝑁𝑡𝑡 , is, the steeper the weight distribution is. In general, significantly flat or steep weight distributions should be avoided. Flat weight distribution essentially ignores the effect of the usage
recency while the steep distribution considers primarily only the most recent usage and ignore all the past implications.
The model of Chen is very promising because it is a fully automatic method that provides comprehensible results. A drawback of this method is that it does not incorporate the knowledge of administrators and users about the systems and information. This could strongly enhance the capabilities of the model (Chen, 2005; Matthesius & Stelzer, 2008). Furthermore the method does not take into account that the value of information does not necessarily has to reflect in the usage of the information. For instance, a trade agreement or contract is of critical value for the business, the usage count for these type of documents does not necessarily has to be high. Developing and adding a classification scheme based on the contents of files or documents could further increase the effectiveness of this method.
PROBABILITY OF FURTHER USE
‘Cut the Crap’ MSc. Thesis – Michiel Bax 34 | P a g e As measures for the value of a file the following variables have been reviewed;
o number of access; o size of the files; o size of the access; o age of the files;
o file types (extensions);
o access types (version fetched, view, version added, move, reserve, unreserve, permission changed or miscellaneous).
These measures are analyzed to see whether they can be used to predict the access behavior of files. To do so, the correlation between these measures and the number of days since last access of a file is evaluated using Q-Q plots. If the hypothesis is accepted, the found distribution can be used to predict
the probability of further use of that specific class of files (a subgroup within one of the measures).
Using the distributions that are accepted and given the days until last access of a file, the probability of further use of that file can be determined. The found distribution can also be used to define migration rules. To do so, a threshold value for a certain class of files can be set, for example;
“Migrate the file to the next tier of storage, if the probability of further access is below 5%”
When the valid distribution has been found, the number of days since last access belonging to this rule can be calculated.
The method of Turczyk is the first known method that uses probabilistic methods to predict the future value of a certain file. No metadata is required to perform calculations, according to Turczyk this is a major benefit because of the effort that is required to collect and update the metadata over the lifecycles of files (L; Turczyk, et al., 2007).
Before this method can be used in a database, the files in a database first have to be examined and a classification of files has to be made in order to find the distributions which are suitable to predict the future value of files. Further research is therefore required to see how this method copes with very dynamic databases. A drawback of this method is that all calculations are based on the characteristics and use of files, the content and context of a file is not considered in the calculations.
ELASTIC QUOTA FILE SYSTEM
Chapter 2: Literature Review 35 | P a g e Second, multimedia files such as MP3 or JPEG are re-encoded with lower quality, this carries some risk, but the data is still available and useful. Third, reproducible files (e.g. ‘~’ files in windows file systems) can be removed, this method carries more risk since the file must be regenerated before it can be used again. These three methods have been tested in five data centers. The results were encouraging, between 16% and 73.2% of total disk space was saved, with an average of 48% over the five data centers.
After this first test, a new functionality was added to the method. To files that are compressed (lossless or lossy) are called ‘elastic files’. Next to elastic files, there are persistent files, these files are never compressed. Users have a limited space for persistent files stimulating the use of elastic files as much as possible. To be able to select files that have to be become elastic, five methods were created. First, users can toggle the elasticity of a file on a per file basis. Secondly this can be done on a directory basis. Third, users can determine whether new files should be created elastic or not. Fourth, users can inform the system of files that should be elastic based on their file name or file type. In file systems there are a lot of temporary files, these files are created by applications, not by users. The last method therefore allows application developers to determine which temporary files should be created elastic.
The EQFS method is interesting because it shows how the experience of administrators and users can be used to identify the elastic files in a system. Based on the classification, policies for file handling are applied. When defining the policies, three considerations have to be made; convenience, fairness and gaming (Zadok, 2004).
Convenience The system should be easy to use and simple to understand. Users have to be able to see how much quota they have left and which of their elastic files will be deleted first.
Fairness It is important to provide a number of policies that can be tailored to the specific needs of a user. There are largest-file-first removal policies which might be considered unfair by users because recently created files may be reclaimed after a short period of time. Or an oldest-creation-time removal policy which is unfair because it does not take into account the amount and recency of use.
‘Cut the Crap’ MSc. Thesis – Michiel Bax 36 | P a g e THE ACE FRAMEWORK
ACE is a framework of tools for ILM, that classifies data and storage resources, and generates a data placement plan for informed utilization of the available storage resources in the system (Shah, et al., 2006). ACE uses a policy-based approach to classify data based on metadata attributes. A classification of storage locations is made based on the technical capabilities of the storage hardware.
[image:36.612.151.460.243.419.2]ACE consists of a data classification engine, a storage classification engine and a data placement engine that maps the data to the appropriate storage. The ACE architecture is as follows;
Figure 2.3: ACE Architecture (Shah, et al., 2006)
For this research the primary interest is the data classification engine of the ACE framework. The ACE framework has a number of key features which are as follows;
Classification ACE semi-automates the process of determining the business value of data, identifying the different classes of data based on their business values
Policy-driven Business Valuation To aid administrators to specify the business value of data, a policy-driven valuation mechanism can be used. The policies determine how the data gets mapped to different business values.
Temporal Business Value By monitoring the system and changing metadata characteristics the temporal nature of business value can be handled.
Chapter 2: Literature Review 37 | P a g e
Figure 2.4: Mapping of business value to the importance of data (Shah, et al., 2006)
As can be seen in Figure 2.3, the data classification engine uses three sources of input, a knowledge repository, observable attributes and user input.
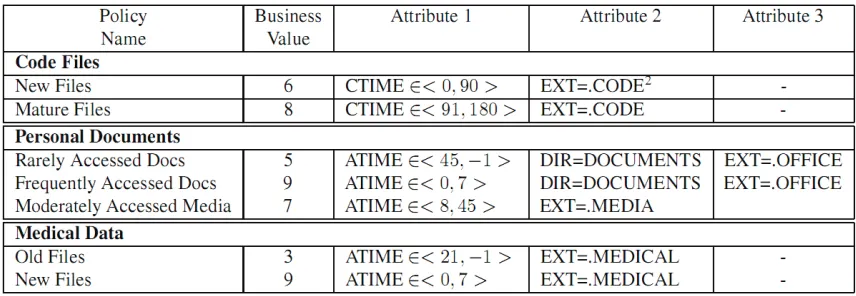
Knowledge Repository The repository is a collection of policies that encapsulate domain knowledge for data classification. A policy consists of a set of observable attributes of the data, the corresponding attribute values and business value for the data that matches these attribute values. Each data object is compared with these policies to determine which one suits the most. For some examples of the policies in the ACE tool, see figure 2.5.
Figure 2.5 : Table showing some sample data classification policies for different domains. CTIME = Creation time, ATIME = Last Access Time, EXT = Extension. Some of the values such as .CODE and .OFFICE actually represent an array of values (Shah, et
al., 2006)
In the policies above for example, a code file that is created between zero and ninety days ago is assigned a business value of ‘6’. And an office document that is accesses more than 45 days ago is considered ‘rarely accessed data’ and therefore is assigned a business value of ‘5’.
[image:37.612.95.523.349.497.2]‘Cut the Crap’ MSc. Thesis – Michiel Bax 38 | P a g e
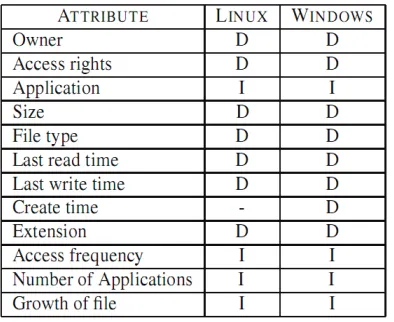
[image:38.612.210.407.133.294.2]User Input The administrator can provide additional input on how to classify the data, sample files can be used or customized policies can be added to the knowledge repository. The suggestions made by ACE can also be overridden.
Figure 2.6: Attributes that have been mined for data classification in the ACE research. D = directly available, I = inferred using internal ACE mechanisms, or a combination of native system APIs (Shah, et al., 2006)
For the actual classification of data, two sorts of policies can be used; knowledge-based policies and expert-based policies.
Knowledge-based policies come prepackaged in the ACE framework based on the experience of experts. It is possible that a data object does not satisfy all the attribute values that have been defined in a knowledge-base policy, hence the data object cannot be classified directly. To be able to still classify the data the ACE framework applies the policy with the largest fraction of matching attributes. Let the matching policies be 𝑃𝑃1, 𝑃𝑃2, 𝑃𝑃3, … 𝑃𝑃𝑎𝑎 with the number of attributes in each policy 𝑇𝑇(𝑃𝑃𝑖𝑖). Let the number of matching attributes be 𝑀𝑀(𝑃𝑃𝑖𝑖). Then the data object is classified with policy 𝑃𝑃𝑖𝑖, argmax (𝑀𝑀(𝑃𝑃𝑖𝑖)
𝑇𝑇(𝑃𝑃𝑖𝑖)) , providing the matching attributes is greater than 50%. If two policies have the same fraction of matching attributes then by default the policy with the highest value is assigned to the data object. When none of the policies have a maximum matching ratio of 50% ACE assigns a default business value .
Expert-based policies allow the administrator to rank attributes relatively to define a custom policy. Suppose an administrator selects two attributes; 𝐴𝐴1= owner and 𝐴𝐴2= last access time. She ranks owner as being most important and access time as less important. ACE will map these relative ranks to actual ranks 𝑅𝑅1 and 𝑅𝑅2. The administrator will also provide three values for the owner attributes
𝑎𝑎11,𝑎𝑎12, 𝑎𝑎13 these values are also ordered based on importance. ACE will also generate internal scores for these values; 𝑠𝑠11,𝑠𝑠12, 𝑠𝑠13 . Similar there are attribute values for last access time 𝑎𝑎21,𝑎𝑎22 with scores
𝑠𝑠21,𝑠𝑠22. Based on these values ACE generates an internal policy function for a data object 𝑑𝑑 as follows;
Chapter 2: Literature Review 39 | P a g e Where 𝐵𝐵𝐵𝐵(𝑑𝑑) is the business value of data object 𝑑𝑑. 𝑣𝑣�𝑎𝑎𝑖𝑖𝑖𝑖� = 1 if 𝐴𝐴𝑖𝑖 = 𝑎𝑎𝑖𝑖𝑖𝑖 , and 0 otherwise. Generalizing for any policy:
𝐵𝐵𝐵𝐵(𝑑𝑑) = � 𝑅𝑅𝑖𝑖 𝑎𝑎
𝑎𝑎=1 ∙ � 𝑠𝑠𝑖𝑖𝑖𝑖 𝑚𝑚𝑖𝑖
𝑖𝑖 =1 ∙ 𝑣𝑣(𝑎𝑎𝑖𝑖𝑖𝑖)
Where 𝑎𝑎 is the total number of attributes in the expert policy and 𝑚𝑚𝑖𝑖 is the number of values for attribute 𝑖𝑖.
The ACE framework is an interesting example of a complete approach of data handling for ILM. It presents tools and methods for the classification of data and storage locations as well tools for data placement. The data classification method of ACE is based on metadata (data attributes) these attributes are compared with predefined policies. These policies are very important because they determine the business value of a data object. In the article of Shah is stated that these policies are included in the framework and are based on the consultation with experts and experience (Shah, et al., 2006). How these policies have been collected is not discussed. This makes the use of ACE framework based on this article problematic. Without proper guidelines the policies are difficult to formulate, without the correct policies, the ACE framework will not function.
2.2.3 ASSESMENT OF METHODS
To compare the methods introduced in the previous section, different assessment criteria discussed in ILM related publications are used.
Chen formulated five assessment criteria for a data valuation method for ILM automation, these criteria are (Chen, 2005):
o Require little or no human intervention; o Rely on tangible and measurable metrics;
o Be simple and comprehensible to allow users to easily interpret the valuation outputs and gain insight;
o Capture key trends in information values: the differences among information and value changes over time;
o Adapt to changing environments.
Turczyk introduced three critical characteristics for data valuation methods (L; Turczyk, et al., 2008): o Valuation methods have to be automatic, manual valuation is not feasible because of the labor
intensiveness and the low speed of valuation.
o The valuation of data has to be dynamic , preferably on a daily basis.
‘Cut the Crap’ MSc. Thesis – Michiel Bax 40 | P a g e Matthesius and Stelzer used the following assessment criteria to compare data valuation methods (Matthesius & Stelzer, 2008):
o The method incorporates ‘amount of use’ as a valuation criterion; o Divides the data into classes;
o The method can be automated;
o Uses the knowledge and experience of data managers and users; o Takes system performance into account;
o Aims for cost reductions.
Peterson&Pierre defined ILM in 2004. This is a part of the definition; “…to align the business value of information with the most appropriate and cost effective IT infrastructure…” (Peterson & Pierre St., 2004). A data valuation method should therefore try to determine the business value of the data. The business value of data is not necessarily reflected in the use of the data (Chen, 2005). Valuating data purely on amount of use is not sufficient (Jin, Xiong, & Wu, 2008). The data valuation methods are therefore also assessed on the following criterion:
o The data valuation method determines the business value of data.
Some of the assessment criteria mentioned by the different authors, are redundant. These criteria are therefore combined. Also, some of the criteria have already been used as a selection criterion in section 2.1.3. The methods that have been described in section 2.2.2 all fulfilled the selection criteria. The selection criteria are therefore not used again as assessment criteria. The following criteria remain to assess the different valuation methods; to provide proper valuation for ILM purposes, the valuation method must fulfill the following key criteria:
1. Require little to no human intervention;
2. Incorporates ‘amount of use’ as a valuation criterion; 3. Rely on tangible and measurable metrics;
4. Divides the valuated data into classes;
5. Uses the knowledge and experience of data managers and users; 6. Aims for cost reductions;
Chapter 2: Literature Review 41 | P a g e The assessment criteria have been evaluated for the four methods that are discussed in section 2.2.2. In table 2.4 an overview of this assessment is provided.
Criterion / Method (Chen, 2005)
(L; Turczyk, et al., 2008)
(Zadok, 2004)
(Shah, et al., 2006) [1] Little human intervention X X X X
[2] Amount of use X X X
[3] Tangible and measurable metrics X X X X
[4] Classification of data X X X X
[5] Knowledge and experience of data managers and users
X X
[6] Cost reductions X X X X
[7] System performance X
[8] Business value of data X
Table 2.4: Assessment of Methods
The ACE framework is the only method which fulfills al the assessment criteria. The ACE framework is therefore chosen to use in this research. However, before ACE is applied as a valuation method, difficulties in the application of the method that were found in the literature review are discussed.
DIFFICULTIES OF THE SELECTED METHOD: THE ACE FRAMEWORK
The ACE framework uses a policy based approach for ILM. According to literature there are two main problems with the use of a policy based approach for ILM. These problems are both related to the specification of the policies. These problems are discussed next.
The first problem concerns the person who is responsible for specifying the policies. Policies should be specified by an information administrator not by a system administrator (Tanaka, et al., 2005). An information administrator is a business person. A business person often has difficulties with understanding metadata attributes that are important inputs for policies. This makes it difficult for a business person to specify policies (Tanaka, et al., 2005).
‘Cut the Crap’ MSc. Thesis – Michiel Bax 42 | P a g e This chapter shows that a method for the specification of policies for ILM data valuation methods is an important research contribution. Thus, the fourth design science guideline has been applied. The textbox below shows how this is done.
Design Science Guidelines: Research Contributions
Fourth Guideline: Research ContributionsDescription: The objective of design-science research is to develop technology-based solutions to important and relevant business problems (Hevner, et al., 2004).
Application in Research
The literature review showed the problems that are related to the specification of policies for ILM data valuation methods. A method to specify these policies is an important contribution that extends and improves the capabilities and usefulness of the ACE framework and the existing knowledge base.
2.3 SUMMARY
In this chapter a literature review is used to find valuation methods for data. Nine methods are identified in literature and summarized in Table 2.3. Based on criteria from literature a selection of the valuation methods is made. Four methods are discussed in detail. These four methods are evaluated using assessment criteria from literature. The assessment showed that the ACE framework is the valuation method with the most capabilities. The ACE framework uses policies to manage the data and guide its lifecycle. Research shows that specifying the policies is problematic.
Chapter 3: Conceptual Policy Specification Method 43 | P a g e
Chapter 3
3
CONCEPTUAL POLICY SPECIFICATION METHOD
In this chapter a conceptual method which can be used to specify policies in the ACE framework is developed. First the relevant parts of the ACE framework are briefly discussed. Second, it is showed how the required inputs for a policy in ACE can be collected. After collecting the inputs new policies can be specified with the use of statistical techniques. The last section describes how this can be done.
3.1 RELEVANT PARTS OF THE ACE FRAMEWORK
For this research the main interest of the ACE framework is its data classification engine (DCE). The DCE compares the values of observable attributes from metadata with (pre-) defined policies in a knowledge repository to make a classification of data. The users of the system can modify, add or delete policies in the knowledge repository. A detailed description of the DCE can be found in section 2.2.2. The different parts of the DCE are displayed in figure 3.1.
Figure 3.1: Data Classification Engine Architecture
In the description of the ACE framework is mentioned that knowledge-based policies come prepackaged with the ACE framework. These policies have been developed by consulting experts and making use of the experience of the developers of ACE. This description is rather vague, no additional guidelines on the developments of policies is provided. Because policies play a key role in the classification of data with
Knowledge Repository
Observable Attributes (Data&Storage)
User Input
Data Classification
‘Cut the Crap’ MSc. Thesis – Michiel Bax 44 | P a g e ACE, a structured method that guides in the development of policies is needed to improve the effectiveness of the use of ACE.
3.2 POLICIES IN THE ACE FRAMEWORK
The policies in the ACE framework consist of a set of observable attributes of the data, the corresponding attribute values, and a business value for the data that matches these attribute values. The observable attributes can be found in Table 3.1 and some examples of policies in Figure 2.5.
As discussed in section 1.1, because of the non-triviality of data valuation, most administrators need guidance in the data valuation process. According to Shah (2006) it is required that administrators are aware that different metadata attributes are relevant for different types of data classification. When administrators are not capable of doing so, developing effective policies for the knowledge repository is impossible. Without these policies the ACE framework is of no use whatsoever. It is therefore critical for the effectiveness of ACE to have a method that assists in the development of these policies.
Three inputs are required for a policy in ACE: o Business value
o A set of observable attributes
o A specific value or value ranges for these attributes
How the appropriate information for these three inputs can be collected is discussed in the next section.
3.2.1 BUSINESS VALUE
Chapter 3: Conceptual Policy Specification Method 45 | P a g e ASSET VALUATION APPROACH
Moody and Walsh (1999) have developed a method that allows organizations to value information consistent with accepted accounting principles. To do so, the major asset valuation paradigms from accounting theory are (Godfrey, Hodgson, Holmes, & Kirsch, 1997);
o Cost (historical cots)
o Market (current cash equivalent) o Utility (present value)
Moody and Walsh conclude that utility value; “the benefits that can be derived from information, in terms of future cash flows”, is theoretically the best indicator for the value of information. It takes into account how the information is used. However, estimating the future benefits is very time consuming and very subjective. It is very difficult to isolate the influence of a piece of information on the organization’s future revenue and thus its value. Information acts as a catalyst rather than a direct source of revenue (Moody & Walsh, 1999).
Using market value; the amount that other firms are willing to pay for information, is only possible in very few cases where information is sold as a product in its own right. And if information is sold as a product over and over again, the utility value model is more suitable to use.
The historical cost; how much was originally paid to acquire the asset, seems to be the most workable method for the valuation of information. The method is reliable, it is easy to collect necessary data and most importantly, it can be applied to all information. Moody and Walsh add that the traditional cost method used in accounting is not suitable as-is, because the concept of use is not incorporated (Moody & Walsh, 1999). They therefore propose a number of modifications to the traditional cost method:
o The costs for the collection of information should be standardized for all data items.
o Management information should be valued based on the costs resulting from the processes that are used to abstract the information from operational systems .
o Redundant information has zero value. o Unused information has zero value.
o The number of users and the amount of access to data should be used to multiply the value of information.
o The value of information should be depreciated based on