ISSN Online: 2164-6783 ISSN Print: 2164-6775
Structural Patterns of Immunoreactivity to
Cytokeratin 18 in Normal Prostate and Benign
Prostate Hyperplasia: Global and Local
Differences
Luis Santamaría
1, Ildefonso Ingelmo
2, Fernando Teba
31Department of Anatomy, Histology, and Neuroscience, School of Medicine, Autonomous University of Madrid, Madrid, Spain 2Department of Anesthesiology, Hospital Ramón y Cajal, Madrid, Spain
3Department of Surgery (Urology), Hospital de La Princesa, School of Medicine, Autonomous University of Madrid, Madrid,
Spain
Abstract
Background: Benign prostate hyperplasia (BPH) is the most common benign disease of the human prostate. The comparison between global versus local changes in spatial patterns of pathological lesions provoked a growing interest in some fields such as neuropathology. To date, there is little data on this sub-ject in prostatic pathology. Given the interest of local parameters to distin-guish between normal and pathological structures, the present study will ap-ply first and second order stereological tools to find out if the cytokeratin18 (ck18) immunoexpression shows relevant local changes in BPH compared to normal prostate, independently if global estimates were similar in both groups. Methods: To verify if the global and local changes in immuno- expression of ck18 are relevant to ascertain differences between normal (CTR) and BPH cases, the following parameters will be applied: Volume fraction of epithelium immunostained for ck18 (VV ck18), both in global and local
esti-mates; dispersion indices of VV ck18; estimates of local variance of VV ck18
(positional and of scale) using wavelet analysis; and lacunarity analysis to measure the tissue heterogeneity. Then, the set of values from the parameters studied that show significant differences between CTR and BPH will be em-ployed to perform stepwise linear discriminant analyses to determine if locally estimated parameters were able to classify accurately the cases in CTR and BPH groups. Results and Conclusions: The findings of the present study in-dicate that changes in the expression of ck18 by the hyperplastic prostatic ep-ithelium are not homogeneous. This limits the use of a single biopsy based markers to predict biological behavior in BPH. On the other hand, the local changes in the expression of ck18 are more evident in terms of VV ck18 and its How to cite this paper: Santamaría, L.,
Ingelmo, I. and Teba, F. (2017) Structural Patterns of Immunoreactivity to Cytokera-tin 18 in Normal Prostate and Benign Prostate Hyperplasia: Global and Local Differences. Open Journal of Pathology, 7, 25-44.
https://doi.org/10.4236/ojpathology.2017.7 2004
Received: February 27, 2017 Accepted: April 27, 2017 Published: April 30, 2017
Copyright © 2017 by authors and Scientific Research Publishing Inc. This work is licensed under the Creative Commons Attribution International License (CC BY 4.0).
local variability, whereas other parameters that are useful in other pathologies, such as lacunarity, are less relevant In prostatic hyperplasia.
Keywords
Prostate, Hyperplasia, Cytokeratin 18, Volume Fraction, Lacunarity, Local Changes
1. Introduction
Benign prostate hyperplasia (BPH) is the most common benign disease of hu-man prostate [1] [2], representing approximately 50% of medical consultations made by urological disease [3] [4].
Although the pathogenesis of BPH is unclear, it is known to be multifactorial; being necessary the presence of two factors for prostate growth occurs: the an-drogen stimulus and age [5]. Different theories have been proposed, based on histological, and hormonal age-related changes, but, currently, not a single ex-planation is accepted [6]. Androgens possibly act as initiators stromal hyperpla-sia, which in turn induce epithelial hyperplasia [7] [8]. It has been also suggested that neuroendocrine cells are involved in the genesis of BPH, perhaps enacting some mediation between stroma and epithelium. The cytological findings in BPH are generally of little relevance, and rather unspecific, as alterations in-cluding basal cell hyperplasia, increased stromal mass (particularly the amount of smooth muscle cells), enhanced extracellular matrix deposition, reduced elas-tic tissue, more infiltrating lymphocytes around ducts, acinar hypertrophy and more luminal corpora amylacea and calcifications in the form of prostatic calculi
[9].
The cytokeratin class of intermediate filaments has been shown to exist in all epithelia [10]. There are now recognized 19 distinct cytokeratins expressed in human epithelia and each epithelial type has a distinct phenotype with regard to these proteins [11] [12]. Early studies using polyclonal anticytokeratins demon-strated that the basal cells of the prostate have cytokeratins that are immuno-reactively different from the luminal or columnar cells [13] [14]. Several studies using monoclonal anti-cytokeratin antibodies have differentiated the columnar and basal cell populations on the basis of their specific cytokeratin content [15]. The columnar cells react with monoclonal antibodies to cytokeratin 18 [16]. Be-sides, chemical determination of the cytokeratin phenotype of three established human prostatic carcinoma cell lines also suggests that all three cell lines syn-thesize cytokeratin 18 (ck18) [16]. In the nonmalignant (BPH) prostatic secreto-ry acini, keratin expression patterns have been examined using monoclonal an-tibodies for several types of cytokeratins [17]. The keratins recognized are all expressed in the glandular cells, for example, cytokeratin 14 specifically stain the basal cell population, while cytokeratins 18 and 19 react with the columnar cell population.
pros-tate, no remarkable differences are detected [16] [17]. Nevertheless, the percen-tage of positivity for luminal ck18 was statistically lower for BPH cultures re-spect to the positivity observed for both prostatic intraepithelial neoplasia (PIN) and prostate cancer (PCa)-derived cultures [18].
All these studies were based on global estimates of immunoexpression of ck18 in malignant of benign prostate cases, but there is lack of information about possible local differences in immunoexpression of ck18, within both normal and pathological prostate samples.
The comparison between global versus local changes in spatial patterns of pa-thological lesions provoked a growing interest in some fields such as neuropa-thology [19]. However, there is little data on this subject in the field of prostatic pathology. Recently, several studies have dealt with the estimation of measure-ments of either acinar or stromal parameters at the local level in normal and pa-thological human prostate, using second order stereological methods [20]. For example: The study of the distribution of microvessels in normal and pathologi-cal prostate [21], the distribution of cell nuclei populations in prostatic adeno-carcinoma and PIN [22], the estimation of K function and isotropy of normal prostatic acini compared to cancer [23], and the local changes of glandular pat-tern in BPH compared to normal prostate [24]. In some of these studies, several discrepancies between global and local results were detected. Thus, the first or-der (global) parameter of volume fraction of epithelial ck18 does not rapport differential information between normal and cancer prostate acini [23], or in the study of the structural pattern of acinar tree, the global measurements as the av-erage volume of acini were unable to distinguish between normal prostate and BPH; whereas local parameters, such as connectivity density, showed remarkable differences between normal and pathological prostate [24].
Given the interest of local parameters to distinguish between normal and pa-thological structures, the present study will apply first and second order stereo-logical tools to find out if the ck18 immunoexpression shows relevant local changes in BPH compared to normal prostate, independently if global estimates were similar in both groups.
To check for such local changes in the ck18 immunoexpression in both nor-mal and hyperplastic (BPH) prostate, the following parameters will be applied:
1: Volume fraction of epithelium immunostained for ck18 (VV ck18), both in
global and local estimates (pixel to pixel of tissue).
2: Dispersion indices of global VV ck18, as Morisita index [25] [26].
3: Estimates of the local variance of VV ck18 (positional and of scale) using
wavelet analysis [27] [28] [29] [30].
4: Lacunarity analysis in order to measure the distribution of gap sizes inters-persed among the immunostained acini (i.e.: tissue heterogeneity) [31].
2. Material and Methods
2.1. Material
La Princesa Hospital (Madrid, Spain), 10 were from adults, (CTR group), age (mean ± SD): 45 ± 7; range: 30 - 47 years, all these specimens were of healthy subjects, without endocrine or reproductive pathology, deceased in traffic acci-dents, and eligible as donors for transplant, the age of the subjects of CTR group was in the range indicated to avoid any histological changes of subclinical BPH, relatively frequents in subjects older than 50 years. The other 10 were surgical specimens (adenomectomies) from patients diagnosed of the adenofibro- miomatous type of benign prostatic hyperplasia, (BPH group), age (mean ± SD): 75 ± 10, range: 65 - 85 years. All the ethical requirements were accomplished in order to obtain the prostatic tissue either at the moment of the multiorganic ex-traction for transplant (CTR group) or at the surgery (BPH group).
2.2. Processing of the Tissues
Immediately after extraction, the specimens were fixed during a week in 10% paraformaldehyde in PBS, pH 7.4, (Probus, Barcelona, Spain).
After fixation, the specimens from the two groups were thoroughly sectioned into 2-mm-thick slices, performed by isotropic uniform random sampling (IUR sections) in order to preserve the isotropy of the tissue [32].
All the specimens were processed for paraffin embedding. The paraffin blocks were exhaustively sectioned. A total of 20 sections (5-µm-thick) were performed on each block for immunohistochemistry.
2.3. Immunohistochemistry
At least five randomly selected slides per specimen were immunostained for ck18 in CTR and BPH groups. Deparaffinized and rehydrated tissue sections were treated at room temperature for 30 min with hydrogen peroxide 0.3% in phosphate-buffered saline (PBS) pH 7.4, to block endogenous peroxidase. To detect ck18 immunoreactivity, sections were incubated with a monoclonal anti- cytokeratin 18 antibody (Abcam, Cambridge, UK) diluted at 1:250. Pretreatment of sections by heat in citrate buffer pH 6.0 (using a pressure cooker) [33] was performed to enhance immunostaining.
de-hydrated in ethanol, and mounted in a synthetic resin (Depex, Serva, Heidel-berg, Germany). The specificity of the immunohistochemical procedures was checked by incubation of sections with no immune serum instead of the primary antibody.
2.4. Data Acquisition
Five strips of an average of 20 immediately adjacent quadrats (range 10-40) were explored for each immunostained section from CTR and BPH groups. The ori-gin and sense of the axis for each strip were chosen by systematic random sam-pling [34] for all the strips. The result was a series of images from the two groups, sized, on average, 512 × 7000 pixels. The final magnification (×100) was such that 1000 pixels represented 1280 μm. At that point, the strips were 9 mm long, on average. Therefore, the total length explored per section (five sections) and per case (10 cases) was 9 × 5 × 10 = 450 mm (for BPH cases, an appreciable percentage of the maximum specimen diameter) [21].
The images were captured using a colour digital camera DP 70 (Olympus Corporation of the Americas, PA, USA) with a resolution of 12.5 mega-pixels, attached to an Olympus microscope fitted with a motorised stage controlled by the stereological software Cast-Grid (Stereology Software Package, Silkeborg, Denmark). This program controls the XY displacement of the microscope stage and allows the selection of fields to be studied by random systematic sampling after the input of an appropriate sampling fraction [22].
The strips were then mounted from the images captured, using the public domain Java image processing program, Image J (version 1.48), developed at the US National Institutes of Health and available on the Internet at
https://imagej.nih.gov/ij/index.html[35]. Subsequently, the resultant strips were processed using the same software.
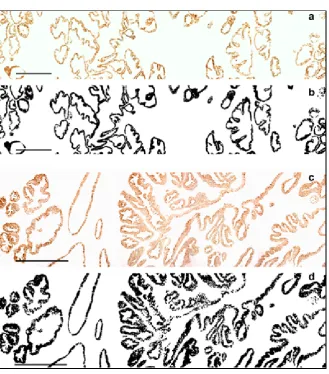
A binary image was produced where the immunostaining to ck18 was shown as black and the pore space (lumina of acini, stroma, etc.) as white (Figure 1).
2.5. Quantitative Measurements
-Volume fractions of immunostained epithelium
The local measurements of the fraction of volume of tissue immunostained to ck18 (VV ck18) were obtained as a follows: At each point of the long axis of each
image strip, the fraction of pixels belonging to the immunostained epithelium, expressed as a percentage over the space of reference (pore space plus immuno-reactive epithelial component) was automatically recorded by the image analysis system for all the N columns orthogonal to the long axis. The resulting series of N consecutive rational numbers per visual field served as input signals for esti-mating the VV ck18 measurements (per pixel of tissue) [21]. The results were
plotted as a space series, being the position (number of pixels transformed on microns) represented in the X-axis and the VV ck18 in the Y-axis of the plot.
The global measurement of VV ck18 was obtained averaging the local VV ck18
Figure 1. In (a) the image shown is a strip from a specimen of CTR group immunos-tained to ck18; In (b) the binarised picture from (a) is depicted, the ck18 immunoreactive cytoplasm is in black and the space of reference (acinar lumina and stroma) in white; In (c) the image shown is a strip from a specimen of BPH group immunostained to ck18; In (d) the binarised picture from (c) is depicted, the ck18 immunoreactive cytoplasm is in black and the space of reference (acinar lumina and stroma) in white. The scale bars represent 326 µm.
-Dispersion index of the global VV ck18 measurements
This procedure takes estimates of VV ck18 from quadrats and calculates
sever-al indices that can be used to identify the spatisever-al patterning of the volume frac-tion. In the present study the Morisita index was obtained [25]. It is the scaled probability that two measurements chosen at random from the whole popula-tion are in the same quadrat. The higher the value, the more clumped the distri-bution. This parameter was obtained using the PASSaGE software [26], that is a program suitable for pattern analysis and spatial statistics.
-Estimation of local variability of VV ck18
The local variance for VV ck18, related to position and scale, was measured in
determine the scale of pattern [36]. Wavelet analysis is similar to many of the quadrat variance methods; although in some ways it is much more flexible. Wavelets have been heavily studied in mathematics and engineering for signal analysis and data compression, but have had limited use in biology [27] [28] [29] [30].
A wavelet function is a scalable windowing function whose integral equals ze-ro. One way to think of this is that the wavelet function describes a template that can be scaled to a desired size, and then slid onto the space series of VV ck18
values along of long axis of the strip. When the template fits the observed data well, the value of the wavelet transform at that position is high; when it does not, the value is low. Then, the adjusting of wavelet function over the space series, obtain the overall variance at a given position and scale [26]. In the present study, wavelet analysis was performed from one to a maximum scale specified as a percentage of the input data size (50%). The wavelet kernel employed was the Haar wavelet function [37]. Wavelet analysis of variance was performed using the PASSaGE software. The results for both CTR and BPH groups were ex-pressed plotting the variance values in function of position (in microns) and scale.
-Estimation of local heterogeneity (clumping) of VV ck18
The heterogeneity of distribution for the acini immunoreactive to ck18 (in CTR and BPH cases) was detected by estimation of the patterning of gap sizes among the immunostained structures; this was performed by means of the lacu-narity analysis.
Lacunarity analysis derives from fractal mathematics and is a measure of the distribution of gap sizes [38]. Originally developed for binary (presence/absence) data, lacunarity analysis is easily applicable to continuously distributed variables as well [31]. Lacunarity (Λ) for a specific range (scale) is estimated as the ratio of the first (mean) and second (variance) moments of measurements within all possible boxes of that range width. Lacunarity analysis was performed for all scales from one to a maximum specified as a percentage of the input data size. The maximum allowable scale was 50%.
The results were plotted on a log-log plot of Λ versus scale. Random data produces a curve, which is concave upwards. Clumped data produces greater la-cunarity and a curve which is concave downwards. Regularly spaced data pro-duces less lacunarity and a curve which is initially straight [39] [38] [31].
2.6. Statistical Analysis
The global VV ck18 and Morisita index were expressed as mean ± SEM.
Com-parisons between these means from CTR and BPH groups were performed by a Student t test. For VV ck18 values along the space series, positional and scale
va-riance of VV ck18, and lacunarity measurements, the local estimates of mean ±
SEM were performed and also compared between CTR and BPH groups by a Student t test. The level of significance was p < 0.05. For VV ck18 values along
the space series, positional and scale variance of VV ck18, and lacunarity
mea-surements, the set of values showing significant differences between CTR and BPH was pooled and employed to perform stepwise linear discriminant analyses
[40] in order to determine if locally estimated parameters were able to classify accurately the cases in CTR and BPH groups.
Discriminant variables were selected according to Wilk’s lambda: at each step, the variable that minimises the overall Wilk’s lambda or maximises the asso-ciated F statistic is selected (F to enter = 3.84 and F to remove = 2.71). Wilk’s lambda statistic explains the rate of total variability that is not due to differences among groups. A lambda of 1 means that the mean of the discriminant scores is the same in all groups and there is no variability between groups, while a lambda near 0 means that there is a significant difference among groups. Therefore, Wilk’s lambda provides a test of the null hypothesis that the population means are equal. The larger lambda is the less discriminating power is present [41].
For each local variable, the discriminant scores obtained were employed to construct histograms of the relative frequency of CTR and BPH to graphically display their ability to classify cases.
3. Results
3.1. Immunohistochemistry
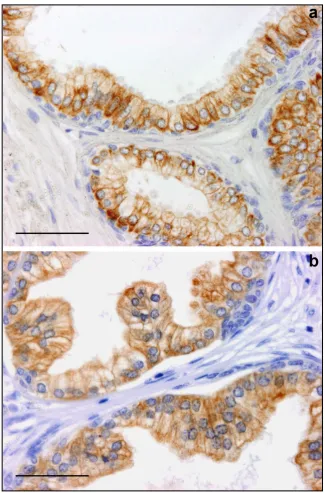
When comparing CTR with BPH cases, no remarkable differences were ob-served in relation to ck18 immunoreactivity. In both groups the immunostaining to ck18 was abundant and exclusively detected in epithelial columnar cells. The immunoexpression was mainly located in lateral and apical border of the cells (Figure 2).
3.2. Global Quantitative Findings
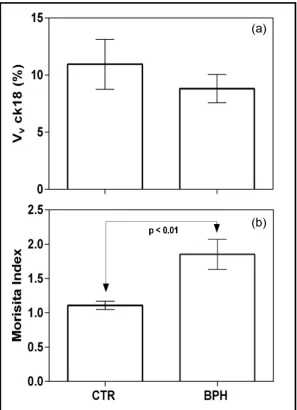
No significant differences have been observed in global VV ck18 when CTR and
BPH groups were compared (Figure 3(a)). In the other hand, the Morisita index for VV ck18 distribution was significantly higher (p < 0.01) in BPH than CTR
(Figure 3(b)).
3.3. Local Quantitative Findings
The estimate of local VV ck18 (pixel by pixel) along of the space series shows a
Figure 2. Sections immunostained to ck18 and counterstained with haematoxylin: In (a) image from a CTR case; in (b) an image from a BPH case. The cell nuclei were coun- terstained with haematoxylin. The scale bars represent 50 µm.
comparison with the same segment of strip from CTR group (Figure 4). The segments of the BPH space series that show the above indicated differ-ences were in the next ranges of distance: 997-1012, 3310-3442, 3503-3557, 3645- 3653, and 6151-6336 microns (Figure 5).
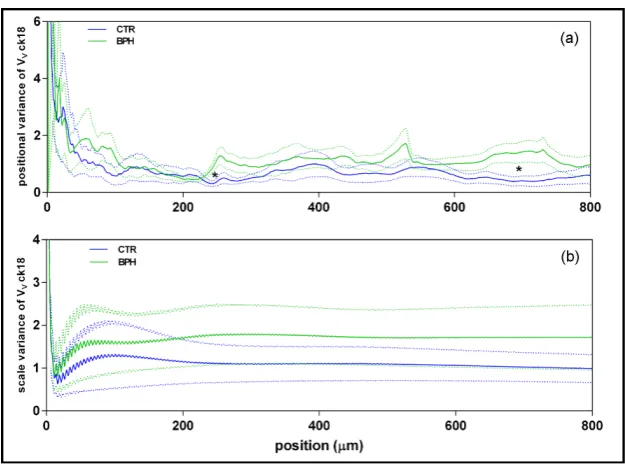
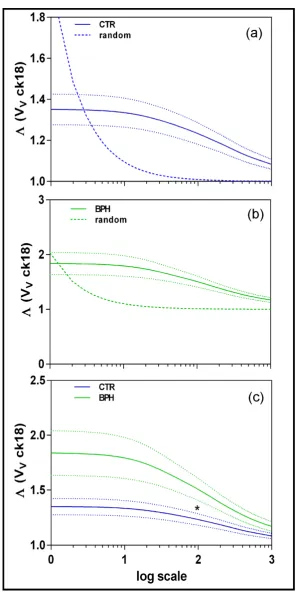
The wavelet analysis indicated that positional variance of VV ck18 was always
Figure 3. Bar diagrams expressing mean ± SEM for: (a) global VV ck18; (b) Morisita
In-dex for dispersion of VV ck18 global measures, in control (CTR) and hyperplastic (BPH)
groups. The means with significant differences between them are connected by zig-zag lines, indicating the correspondent p values.
Figure 4. Diagram for space series of local VV ck18 values along the X axis (position in
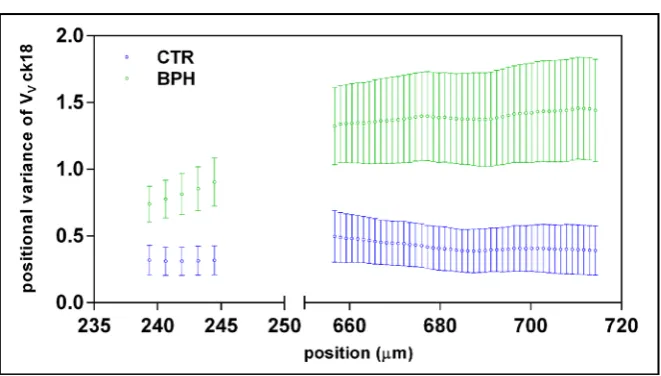
[image:10.595.212.539.552.679.2]Figure 5. Diagram showing the ranges of distance (in µm) where CTR (blue) and BPH (green) show significant differences (p < 0.05) for local VV ck18 values, these values are
expressed as mean ± SEM.
Figure 6. Diagrams for positional (a) and scale (b) variances of local VV ck18 values along
the X axis (position in µm) of the correspondent strips of CTR (blue line) and BPH (green line) groups. The asterisks indicate the segment of space series were the differences between CTR and BPH are significant (p < 0.05).
The ranges in which the positional variance was significantly different were: 239-244, and 656-714 microns (Figure 7).
The estimate of Λ for VV ck18 in both CTR and BPH groups shows a clear
clumping pattern for the ck18 immunoreactiveacini, and differs significantly for lacunarity curves from a random distribution of the data (Figure 8(a) and
Fig-ure 8(b)). When comparing Λ between CTR and BPH cases, the CTR group
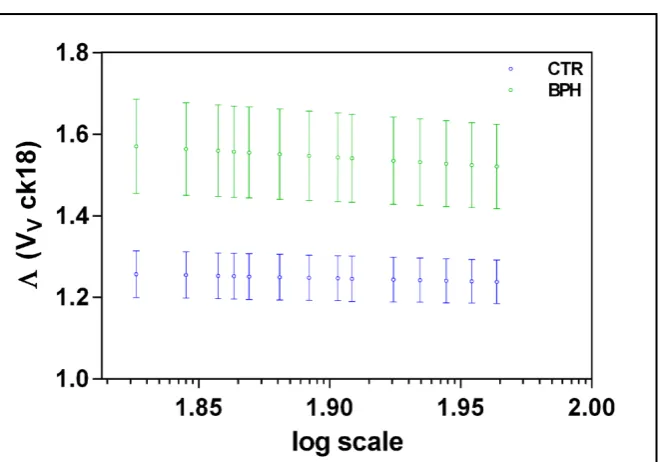
shows higher values of Λ than BPH (Figure 8(c)), but the differences were sig-nificant in only a small interval of scale values, ranging between 86 and 118 µm (Figure 9).
3.4. Discriminant Analysis
[image:11.595.217.530.247.480.2]Figure 7. Diagram showing the ranges of distance (in µm) where CTR (blue) and BPH (green) show significant differences (p < 0.05) for positional variance of local VV ck18
values, these values are expressed as mean ± SEM.
a) From all the local VV ck18 values showing significant differences between
CTR and BPH groups, only VV ck18 at 3414 and 1.3 µm respectively have
dis-criminatory power. With these two variables in the model, 82% of the cases were correctly classified into the CTR and BPH groups. Table 1(a) shows the signifi-cant reduction of the Wilk’s lambda statistic with these variables included in the model.
b) From all the values for positional variance of VV ck18, showing significant
differences between CTR and BPH groups, only those at 1.3 and 241 µm respec-tively have discriminatory power. With these two variables in the model, 82% of the cases were correctly classified into the CTR and BPH groups. Table 1(b)
shows the significant reduction of the Wilk’s lambda statistic with these variables included in the model.
c) From all the Λ values for VV ck18 showing significant differences between
CTR and BPH groups, only the Λ value at a scale of 86 µm has discriminatory power. With this variable in the model, 76 % of the cases were correctly classi-fied into the CTR and BPH groups. Table 1(c) shows a not significant reduction of the Wilk’s lambda statistic with this variable included in the model.
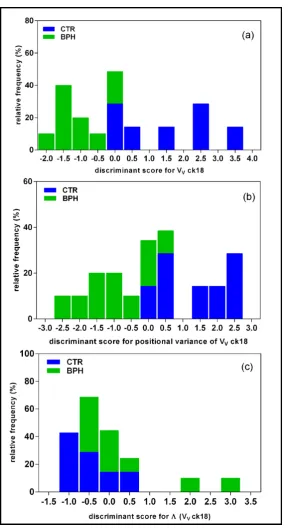
The histograms showing the distribution of the cases in CTR and BPH groups when the discriminant scores were applied are depicted in Figure 10.
4. Discussion
The immunohistochemical findings observed in the present study are consistent with findings by other authors [15] [16] [17] [42], regarding the absence of changes in immunoreactivity for ck18 in BPH in relation to normal prostate, al-though some studies show a greater immunoreactivity for ck18 in BPH com-pared to prostate cancer [18]. Moreover, the global quantification of the fraction of epithelial volume immunostained for ck18 (VV ck18) in the BPH group does
Figure 8. Diagrams showing the changes of lacunarity (Λ VV ck18) in relation to scale
Figure 9. Diagram showing the ranges of distance (in log scale) where CTR (blue) and BPH (green) show significant differences (p < 0.05) for Λ VV ck18 values, these values are
expressed as mean ± SEM.
Table 1.Discriminant analyses.
Entered variable1 Wilks’ λ2 F3 p4
(a) VV 3414 0.486 15.88 0.001
VV 1.3 0.373 11.78 0.001
(b) Pvar VV 1.3 0.632 8.74 0.01
Pvar VV 241 0.389 11.99 0.001
(c) Λ VV 86 0.796 3.843 0.06
Discriminant analyses to classify the CTR and BPH cases after: (a) local VV ck18, (b) Positional variance
(Pvar) for VV ck18, and (c) lacunarity (Λ) for VV ck18. 1Selected variables, a: VV ck18 at 3414 and 1.3 µm
respectively, b: Pvar VV at 1.3 and 241 µm respectively, and c: Λ VV at 86 µm. 2This column shows the
Wilks’ lambda for every variable entered. 3F distribution of Snedecor, the F minimum value for entering the
variables was 3.84. 4Level of significance p < 0.05.
have described an increase in the fraction of immunoreactive epithelial volume for prostate-specific-antigen (PSA) in BPH, compared to normal prostate [24]. This suggests that, although epithelial compartment in BPH can be expanded, the global expression of ck18 not change in relation to non-hyperplastic pros-tate. The significant clumping of the ck18 immunoreactive epithelium in BPH respecting to CTR revealed by the increase of Morisita index, indicates a higher heterogeneity in the distribution of hyperplastic acini compared with a more uniform distribution of acini for CTR group. This could be corroborated by the increase of branching pattern of BPH glands as shows the increase in connectiv-ity densconnectiv-ity described in other study [24].
No global differences in VV ck18 between CTR and BPH were observed.
[image:14.595.211.539.374.468.2]Figure 10. Histograms showing the distribution of percentage of cases of CTR (blue) and BPH (green) groups when the discriminant scores obtained in each discriminant analysis were applied. The best separation between CTR and BPH groups is observed for VV ck18
(a); and positional variance of VV ck18 (b); nevertheless, the discrimination for Λ (VV
ck18) is poor (c).
mal prostate. Although the average length of the segments of the space series with significant differences for VV ck18, represents less than 4% of the average of
the total length, in the discriminant analysis carried out was observed that VV
cases studied.
In addition, local changes in volume fraction immunostained for ck18, are accompanied by differences in the variability of the parameter, manifested by significant differences in the variance of VV ck18, detected by Wavelet analysis.
This type of analysis has been scarcely used in prostate pathology [43], but in our study it has revealed of interest for detection of local changes in the posi-tional variance of VV ck18. For all the space series, the positional variance was
higher in BPH than CTR, but only in two segments (less of the 1% of the average of the total length) this increase was significant. As in local values for VV ck18,
their positional variance at two locations of the space series, had discriminant power to correctly classify 82% of the cases studied. The local increase of the va-riability of Vv ck18 could be put in relation to the greater vava-riability of the vo-lume of hyperplastic acini compared to normal acini detected elsewhere [24]
and, in general terms, with the heterogeneity of glandular morphometry in BPH, as evidenced by other authors [44].
However, when scale variance was examined, no differences were detected between the CTR and BPH groups, at least in the range of scales studied, whose maximum represents 50% of the total size of the space series. This suggests that the distribution of expression of ck18, both in normal and hyperplastic prostate, not shows a preferred scale [45], although in certain situations, the scale of the processes is of great importance, for example for some models of prostate tumor growth [46].
Lacunarity analysis has proven useful to study the distribution of gaps and structural elements in different pathological situations [47]. Thus, it is a useful tool to describe tissue heterogeneity, and, for instance, the behavior of tumor cells [48]. In the present study, the profile of Λ values in relation to the scale of analysis, agrees with the clumped distribution of acini in both CTR and BPH groups. This distribution can not be attributed at random, as suggested by the differences between Λ curves for real cases and those constructed after rando-mization of the data in both CTR and BPH groups.
Although the Λ-profile for BPH always shows a greater heterogeneity for the distribution of acini ck18 immunoreactive than in controls, this difference is only significant for a very small range of scales. In addition, its discriminatory power to classify cases in the two groups studied is poor. Conversely to what is described in other types of pathologies such as bone dysplasia where the useful-ness of Λ is clearly shown to discriminate between normal and pathological bone
[49].
markers to predict biological behavior, and has significant impact on the ability of distinguishing longitudinal changes in tissue composition from sampling ar-tifacts [51].
On the other hand, in the case of BPH, the local changes in the expression of ck18 are more evident in terms of VV ck18 and its local variability, whereas other
parameters that are useful in other pathologies, such as lacunarity, are less rele-vant in prostatic hyperplasia.
Two possible limitations of this study are indicated below: The work has fo-cused exclusively on one type of BPH, the adenofibromiomatous variety, it may be worth exploring with the same quantitative tools the hyperplasias of stromal and fibro-muscular predominance.
Another factor that would be interesting to analyze is how the resolution of the images’ influences on the local variance and the lacunarity measurements, for that, it would be necessary to explore those variables on images captured with different magnifications.
References
[1] Barry, M.J. (1990) Epidemiology and Natural History of Benign Prostatic Hyperpla-sia. Urologic Clinics of North America, 17, 495-507.
[2] Kirby, R.S. (1992) The Clinical Assessment of Benign Prostatic Hyperplasia. Cancer, 70, 284-290.
[3] Burgos Rodríguez, R. and Chicharro Molero, J.A. (1993) Hiperplasia Benigna de Próstata. In: Jiménez Cruz, J.F. and Rioja Sanz, L.A., Eds., Tratado de Urología, J. R. Prous, Barcelona, 1035-1050.
[4] Isaacs, J.T. (1994) Etiology of Benign Prostatic Hyperplasia. European Urology, 25, 6-9.
[5] Aaron, L., Franco, O.E. and Hayward, S.W. (2016) Review of Prostate Anatomy and Embryology and the Etiology of Benign Prostatic Hyperplasia. Urologic Clinics of North America, 43, 279-288. https://doi.org/10.1016/j.ucl.2016.04.012
[6] Partin, A.W., Oesterling, J.E., Epstein, J.I., Horton, R. and Walsh, P.C. (1991) In-fluence of Age and Endocrine Factors on the Volume of Benign Prostatic Hyperpla-sia. The Journal of Urology, 145, 405-409.
[7] Narayan, P. (1992) Neoplasias de la próstata. In: McAninch, J.W., Ed., Smith’s General Urology, Appleton and Lange, Norwalk.
[8] Birkhoff, J.D. (1983) Natural History of Benign Prostatic Hypertrophy. In: Hinman, F., Ed., Benign Prostatic Hypertrophy, Springer Verlag, New York, 5-9.
https://doi.org/10.1007/978-1-4612-5476-8_1
[9] Bostwick, D.G., Cooner, W.H., Denis, L., Jones, G.W., Scardino, P.T. and Murphy, G.P. (1992) The Association of Benign Prostatic Hyperplasia and Cancer of the Prostate. Cancer, 70, 291-301.
https://doi.org/10.1002/1097-0142(19920701)70:1+<291::AID-CNCR2820701317>3. 0.CO;2-4
[10] Franke, W.W., Appelhans, B., Schmid, E., Freudenstein, C., Osborn, M. and Weber, K. (1979) Identification and Characterization of Epithelial Cells in Mammalian Tissues by Immunofluorescence Microscopy Using Antibodies to Prekeratin. Diffe-rentiation, 15, 7-25.
of Human Cytokeratins: Patterns of Expression in Normal Epithelia, Tumors and Cultured Cells. Cell, 31, 11-24. https://doi.org/10.1016/0092-8674(82)90400-7
[12] Quinlan, R.A., Schiller, D.L., Hatzfeld, M., Achtstatter, T., Moll, R., Jorcano, J.L., et al. (1985) Patterns of Expression and Organization of Cytokeratin Intermediate Fi-laments. Annals of the New York Academy of Sciences, 455, 282-306.
https://doi.org/10.1111/j.1749-6632.1985.tb50418.x
[13] Schlegel, R., Banks-Schlegel, S. and Pinkus, G.S. (1980) Immunohistochemical Lo-calization of Keratin in Normal Human Tissues. Laboratory Investigation, 42, 91- 96.
[14] Barwick, K. and Mardi, A. (1983) An Immunohistochemical Study of the Myoepi-thelial Cell in Prostate Hyperplasia and Neoplasia. Laboratory Investigation, 48, 7A. [15] Brawer, M.K., Peehl, D.M., Stamey, T.A. and Bostwick, D.G. (1985) Keratin Immu-noreactivity in the Benign and Neoplastic Human Prostate. Cancer Research, 45, 3663-3667.
[16] Nagle, R.B., Ahmann, F.R., McDaniel, K.M., Paquin, M.L., Clark, V.A. and Celnik-er, A. (1987) Cytokeratin Characterization of Human Prostatic Carcinoma and Its Derived Cell Lines. Cancer Research, 47, 281-286.
[17] Verhagen, A.P., Ramaekers, F.C., Aalders, T.W., Schaafsma, H.E., Debruyne, F.M. and Schalken, J.A. (1992) Colocalization of Basal and Luminal Cell-Type Cytokera-tins in Human Prostate Cancer. Cancer Research, 52, 6182-6187.
[18] Festuccia, C., Angelucci, A., Gravina, G.L., Muzi, P., Miano, R., Vicentini, C., et al.
(2005) Epithelial and Prostatic Marker Expression in Short-Term Primary Cultures of Human Prostate Tissue Samples. International Journal of Oncology, 26, 1353- 1362. https://doi.org/10.3892/ijo.26.5.1353
[19] Armstrong, R.A., Cairns, N.J. and Lantos, P.L. (2001) What Does the Study of the Spatial Patterns of Pathological Lesions Tell Us about the Pathogenesis of Neurode-generative Disorders? Neuropathology, 21, 1-12.
[20] Howard, C.V. and Reed, M.G. (2005) Unbiased Stereology: Three-Dimensional Measurement in Microscopy. 2nd Edition, Bios Scientific Publishers, Oxford. [21] Santamaria, L., Ingelmo, I., Ruiz, J. and Teba, F. (2011) Study of the Distribution of
Microvessels in Normal and Pathologic Prostate Using an Information-Based Simi-larity Analysis. Journal of Microscopy, 243, 303-314.
https://doi.org/10.1111/j.1365-2818.2011.03508.x
[22] Santamaría, L., Ingelmo, I., Teba, F., Rodríguez, R. and Pozuelo, J.M. (2015) Esti-mate of the Pair Correlation Functions of Nuclei in Normal Prostate, Prostatic Intraepithelial Neoplasia, and Cancer. European Journal of Anatomy, 19, 361-370. [23] Santamaría Solis, L., IngelmoIngelmo, I., Rodríguez Ramos, L., SinuesOjas, B.,
MartínezBlázquez, L. and Teba del Pino, F. (2015) Estimate of the K Function and Isotropy of Acini in Human Normal Prostate and Prostate Adenocarcinoma. His-tology and Histopathology, 30, 149-150.
[24] Santamaria, L., Ingelmo, I., Teba, F., Coloma, A. and Matinez, L. (2016) Quantita-tive Stereological Estimations of Structural Patterns of the Glandular Tree in Benign Hyperplasia of Prostate. Open Journal of Pathology, 6, 122-133.
https://doi.org/10.4236/ojpathology.2016.63015
[25] Morisita, M. (1959) Measuring the Dispersion and the Analysis of Distribution Pat-terns. Memoires of the Faculty of Science, Kyushu University, Series E Biology, 2, 215-235.
229-232. https://doi.org/10.1111/j.2041-210X.2010.00081.x
[27] Bradshaw, G.A. and Spies, T.A. (1992) Characterizing Canopy Gap Structure in Fo-rests Using Wavelet Analysis. Journal of Ecology, 80, 205-215.
https://doi.org/10.2307/2261007
[28] Bradshaw, G.A. and McIntosh, B.A. (1994) Detecting Climate-Induced Patterns Using Wavelet Analysis. Environmental Pollution, 83, 135-142.
[29] Dale, M.R.T. and Mah, M. (1998) The Use of Wavelets for Spatial Pattern Analysis in Ecology. Journal of Vegetation Science, 9, 805-881.
https://doi.org/10.2307/3237046
[30] Nakken, M. (1999) Wavelet Analysis of Rainfall-Runoff Variability Isolating Cli-matic from Anthropogenic Patterns. Environmental Modelling & Software, 14, 283- 295.
[31] Plotnick, R.E., Gardner, R.H., Hargrove, W.W., Prestegaard, K. and Perlmutter, M. (1996) Lacunarity Analysis: A General Technique for the Analysis of Spatial Pat-terns. Physical Review E, 53, 5461-5468. https://doi.org/10.1103/PhysRevE.53.5461
[32] Baddeley, A. and Vedel Jensen, E. (2005) Uniform and Isotropic Uniform Designs. In: Baddeley, A. and Vedel Jensen, E., Eds., Stereology for Statisticians, Chapman & Hall, Boca Raton, 155-173.
[33] Martin, J.J., Martin, R., Codesal, J., Fraile, B., Paniagua, R. and Santamaria, L. (2001) Cadmium Chloride-Induced Dysplastic Changes in the Ventral Rat Prostate: An Immunohistochemical and Quantitative Study. TheProstate, 46, 11-20.
https://doi.org/10.1002/1097-0045(200101)46:1<11::AID-PROS1003>3.0.CO;2-K
[34] Gundersen, H.J. and Osterby, R. (1981) Optimizing Sampling Efficiency of Stereo-logical Studies in Biology: Or “Do More Less Well!”. Journal of Microscopy, 121, 65-73. https://doi.org/10.1111/j.1365-2818.1981.tb01199.x
[35] Rasband, W.S. and Bright, D.S. (1995) NIH Image: A Public Domain Image Processing Program for the Macintosh. Microbeam Analysis Society Journal, 4, 137- 149.
[36] Leps, J. (1990) Comparison of Transect Methods for the Analysis of Spatial Pattern. In: Kraulec, F., Agnew, A.D.Q., Agnew, S. and Willem, J.H., Eds., Spatial Processes in Plant Communities, Academia Press, Prague, 71-82.
[37] Mitteilung, E. (1910) Zur Theorie der orthogonalen Funktionensysteme. Mathema-tische Annalen, 69, 331-371. https://doi.org/10.1007/BF01456326
[38] Plotnick, R.E., Gardner, R.H. and O’Neil, R.V. (1993) Lacunarity Indices as Meas-ures of Landscape Texture. Landscape Ecology, 8, 201-211.
https://doi.org/10.1007/BF00125351
[39] Dale, M. (2000) Lacunarity Analysis of Spatial Pattern: A Comparison. Landscape Ecology, 15, 467-478. https://doi.org/10.1023/A:1008176601940
[40] Huisman, A., Ploeger, L.S., Dullens, H.F., Jonges, T.N., Belien, J.A., Meijer, G.A., et al. (2007) Discrimination between Benign and Malignant Prostate Tissue Using Chromatin Texture Analysis in 3-D by Confocal Laser Scanning Microscopy. The Prostate, 67, 248-254. https://doi.org/10.1002/pros.20507
[41] Hair, J.F., Anderson, R.E., Tatham, R.L. and Black, W.C. (1998) Multivariate Data Analysis. 5th Edition, Prentice Hall, Upper Saddle River.
[42] Wolff, J.M., Borchers, H., Brehmer Jr., B., Brauers, A. and Jakse, G. (1998) Cytoke-ratin 8/18 Levels in Patients with Prostate Cancer and Benign Prostatic Hyperplasia.
Urologia Internationalis, 60, 152-155. https://doi.org/10.1159/000030240
Pa-thological Images of Prostate. IEEE Transactions on Biomedical Engineering, 50, 697-704. https://doi.org/10.1109/TBME.2003.812194
[44] Sherwood, J.B., McConnell, J.D., Vazquez, D.J., Lin, V.K. and Roehrborn, C.G. (2003) Heterogeneity of 5 Alpha-Reductase Gene Expression in Benign Prostatic Hyperplasia. The Journal of Urology, 169, 575-579.
https://doi.org/10.1016/S0022-5347(05)63956-0
[45] Dungan, J.L., Perry, J.N., Dale, M.R.T., Legendre, P., Citron-Pousty, S., Fortin, M.J.,
et al. (2002) A Balanced View of Scaling in Spatial Statistical Analysis. Ecography, 25, 626-640. https://doi.org/10.1034/j.1600-0587.2002.250510.x
[46] Lorenzo, G., Scott, M.A., Tew, K., Hughes, T.J., Zhang, Y.J., Liu, L., et al. (2016) Tissue-Scale, Personalized Modeling and Simulation of Prostate Cancer Growth.
Proceedings of the National Academy of Sciences of the United States of America, 113, ET663-ET671. https://doi.org/10.1073/pnas.1615791113
[47] Dougherty, G. and Henebry, G.M. (2002) Lacunarity Analysis of Spatial Pattern in CT Images of Vertebral Trabecular Bone for Assessing Osteoporosis. Medical En-gineering & Physics, 24, 129-138. https://doi.org/10.1016/S1350-4533(01)00106-0
[48] Borys, P., Krasowska, M., Grzywna, Z.J., Djamgoz, M.B. and Mycielska, M.E. (2008) Lacunarity as a Novel Measure of Cancer Cells Behavior. Biosystems, 94, 276-281. [49] Cordeiro, M.S., Backes, A.R., Junior, A.F., Goncalves, E.H. and de Oliveira, J.X.
(2016) Fibrous Dysplasia Characterization Using Lacunarity Analysis. Journal of Digital Imaging, 29, 134-140. https://doi.org/10.1007/s10278-015-9815-3
[50] Zlotta, A.R., Sattar, A.A., Wespes, E., Noel, J.C. and Schulman, C.C. (1996) Is One Single Prostate Biopsy Helpful for Choosing a Medical Treatment of Benign Pros-tatic Hyperplasia? A Quantitative Computerized Morphometric Study. Urology, 47, 329-334. https://doi.org/10.1016/S0090-4295(99)80448-8
[51] Pasikowska, J., Hebel, M., Nizanski, W. and Nowak, M. (2015) Computed Tomo-graphy of the Prostate Gland in Healthy Intact Dogs and Dogs with Benign Prostat-ic Hyperplasia. Reproduction in Domestic Animals, 50, 776-783.
https://doi.org/10.1111/rda.12587
Submit or recommend next manuscript to SCIRP and we will provide best service for you:
Accepting pre-submission inquiries through Email, Facebook, LinkedIn, Twitter, etc. A wide selection of journals (inclusive of 9 subjects, more than 200 journals)
Providing 24-hour high-quality service User-friendly online submission system Fair and swift peer-review system
Efficient typesetting and proofreading procedure
Display of the result of downloads and visits, as well as the number of cited articles Maximum dissemination of your research work
Submit your manuscript at: http://papersubmission.scirp.org/