Munich Personal RePEc Archive
Securitization in Turkish banking system
Aysan, Ahmet Faruk and Rengifo, Erick William and Ozsoz,
Emre
Bogazici University, Fordham University Center for International
Policy Studies
February 2012
Online at
https://mpra.ub.uni-muenchen.de/36812/
Securitization in Turkish Banking System
∗
Ahmet F. Aysan
†Erick W. Rengifo
‡Emre Ozsoz
§February 20, 2012
Abstract
By using data from 8 depository institutions in Turkey we evaluate the drivers of securitization between 2004 and 2009. Our analysis shows that previous period securitization as well as bank equity, level of profits and asset size are important factors in a bank’s decision to securitize its loan portfolio. Banks’ on-balance sheet liquidity on the other hand is not a significant factor. We also use a binary probit model and predict with good certainty the timing of a bank’s securitization in capital markets. Again, bank size, profitability and equity are also explanatory variables in making these accurate predictions.
∗The authors would like to thank discussants at the 2011 Annual Conference of the Bogazici University
Center for Economics and Econometrics (CEE) for their valuable comments and help in the writing of this paper.The usual disclaimers apply.
†Department of Economics Bogazici University Istanbul Turkey.Phone:Phone: +90 (212) 359 7639.
Fax: +90 (212) 287 2453 e-mail:[email protected]
‡Fordham University New York, Department of Economics. 441 East Fordham Road, Dealy Hall,
Office E513, Bronx, NY 10458, USA. Phone: +1 (718) 817 4061, fax: +1 (718) 817 3518,e-mail: [email protected].
§Center for International Policy Studies, Fordham University. Phone: +1 (212) 217 4929, fax: +1
1
Introduction
Securitization refers to the process of transforming illiquid assets with predictable cash flows into marketable securities. The most common forms of assets used in securitization are mortgage loans, consumer loans, credit card receipts and trade receivables. Although asset securitization has been widespread in developed capital markets especially prior to the Global Financial Crisis, it has constituted an unknown frontier for emerging market banks until recently. The first Turkish bank successfully sold its trade receivables portfolio in international capital markets in 1999. 1
However due to interruption by the 2001-2002 banking crisis securitization did not catch on in the Turkish banking system well until 2003-2004.
In this paper we study the securitization activity in the Turkish banking system be-tween 2004 and 2009 using a dataset of eight Turkish banks which have successfully sold their loan portfolios in international markets during this time frame. We estimate the drivers of their securitization activity by using a GMM specification and find that previous period securitization activity, bank’s profit and equity holdings are the key determinants in terms of their decision to securitize or not. Surprisingly, liquidity does not appear to be a driver of securitization. We also run probit estimations for each bank to see if we can predict the probability of securitization. Our estimation results suggest the factors we have found to be influential in our GMM estimation also predict the probability of securitization activity by each bank.
The rest of this paper is organized as follows: in the next section we provide a brief overview of literature on determinants of securitization; in Section 3 we present our methodology; in Section 4 we describe our dataset; Section 5 provides the results of our estimations and Section 6 concludes.
2
Literature Review
To our knowledge there is no prior study that studies securitization by the Turkish banking system in the growing securitization literature. Yet studies on emerging markets have been done before, some of which may also include Turkey. For instance Jobst (2010) provides a good critical survey of sovereign securitization in emerging markets but this study does not cover bank-level securitization.
There are many reasons for banks to engage in securitization and a vast literature that
1
discusses these. The obvious first reason is to increase liquidity: Securitization creates a funding opportunity for banks without having to attract more retail deposits and being subject to deposit insurance and reserve requirements ((Parlour and Plantin 2008)). A second benefit is it enables a transfer of credit risk. As argued by Dell’Ariccia, Igan, and Laeven (2008) banks with riskier loans may securitize more than others as a result. A third determinant refers to accounting gains(e.g. (DeMarzo 2005)).
When market value of loans exceed their book values, banks may have more of an incentive to recognize these gains. And a final incentive for banks to securitize their loan portfolios may be the opportunity to adjust their capital ratios and decrease their regulatory requirements as Berger, Herring, and Szego (1995) and Jones (2000) have suggested.
as argued by Affinito and Tagliaferri (2010) these effects could also be linked to each other . For instance, if the goal of securitization for a bank is to release capital and use the proceeds to engage in more profitable investments, the causal effect will be significant for both capital and profits. However, the effects could also be completely independent of each other. In that regard, we observe that it is mostly well-capitalized banks in Turkey rather than the smaller ones that securitize but at the same time banks can increase capital even if they have high profits too.
3
Methodology
Our aim is to identify the drivers of securitization activity for Turkish banks, in other words the factors which prompt them to securitize their loan portfolios in international markets. We set up our empirical specification for estimation as follows:
Si,t =αi+β1Si,t−1+β2equityi,t+β3prof iti,t+β4tai,t+β5bi,t+ε (3.1)
whereSi,t represents securitized loans for banki at timet;equity represents bank equity;
prof itis bank profits before taxes andtais our size measure which represents total assets; bit is a measure of balance sheet liquidity calculated by the sum of due from other banks,
marketable securities and cash on a bank’s balance sheet and finally ε is the error term. All our variables are in real terms.
We estimate equation (3.1) using a dynamic GMM model to control for potential endo-geneity of the regressors as some factors influencing securitization can also be influencing profitability and total assets.
variables in Eq.(3.1) in determining the securitization decision made by individual banks in our sample. To do so we estimated a probit model for the individual banks in our sample. Our probit estimation takes the following form:
Di,t =αi+β1equityi,t+β2prof iti,t+β3tai,t+β4bi,t+εit (3.2)
whereDi,t takes the value of 1 if bankisecuritized in quesrtertand 0 otherwise; the other
variables are the same as defined before and finallyεit is a mean zero, constant variance
disturbance term, assumed to be normally distributed. The probit model is defined as:
P r(Yi = 1|xi, β) = 1−Φ(−x
′
iβ) = Φ(x
′
iβ), (3.3)
where Φ is the standard normal cumulative distribution function. The basic idea is to relate this equation to the existence of an underlying latent variable y∗ that is linearly
related to x:
y∗
i =x
′
iβ+ui, (3.4)
whereuis a normally distributed random term. The dependent variable is determined by whether y∗
i exceeds a threshold value:
2
yi =
1, if y∗
i >0
0, if y∗
i ≤0.
(3.5)
4
Data
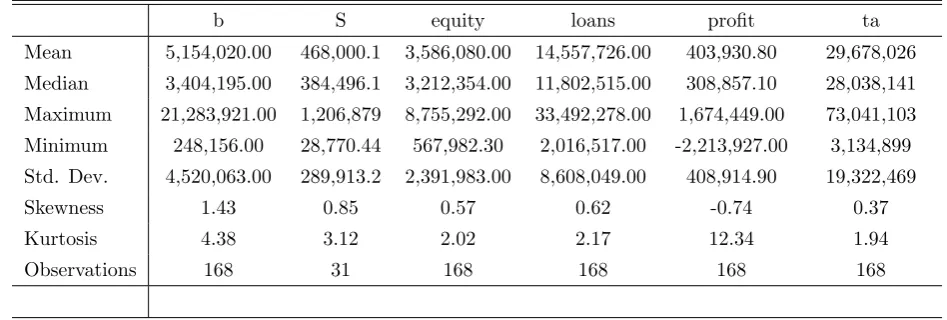
Our banking and securitization data for the Turkish banking system is obtained from Turkish Banks Association. It includes 8 depository institutions that have successfully issued securities in international markets during the five and a half year period of quarterly data that covers 2004 to the second quarter of 2009. These banks represent the biggest banking institutions in Turkey with assets totaling over 80% of the overall assets of the system. The banks in the sample also have a loan portfolio of 14.5 billion TL and a total asset average of 29.7 billion TL. Table 1 provides the descriptive statistics of our sample. The average securitization level per bank per quarter is around 468 million TL or 312 mil USD adjusted for inflation and only constitutes about 3% of average loan holdings by
2
Table 1: Descriptive Statistics
b S equity loans profit ta
Mean 5,154,020.00 468,000.1 3,586,080.00 14,557,726.00 403,930.80 29,678,026 Median 3,404,195.00 384,496.1 3,212,354.00 11,802,515.00 308,857.10 28,038,141 Maximum 21,283,921.00 1,206,879 8,755,292.00 33,492,278.00 1,674,449.00 73,041,103 Minimum 248,156.00 28,770.44 567,982.30 2,016,517.00 -2,213,927.00 3,134,899 Std. Dev. 4,520,063.00 289,913.2 2,391,983.00 8,608,049.00 408,914.90 19,322,469
Skewness 1.43 0.85 0.57 0.62 -0.74 0.37
Kurtosis 4.38 3.12 2.02 2.17 12.34 1.94
Observations 168 31 168 168 168 168
Descriptive statistics for the variables used in the study. All variables are in terms of thousand Turkish Liras and are adjusted for inflation by deflating each series by the cpi. The number of banks in the study is 8.Sis the total securitization amount by the bank in each quarter in terms of Turkish Liras.brepresents on-balance sheet liquidity, and is measured by summing up bank’s cash, due from other banks and total marketable securities;equityrepresents shareholders’ equity;loansrepresents banks’ overall loan portfolio;prof it is banks’ profit before taxes;tarepresents bank’s total assets
banks during the period. This ratio is number is much below the same for more developed economies(In the US at the end of 2007, the ratio of securitized loans to outstanding loans stood at around 27% for consumer credit, and at 2.6% for loans to business (Loutskina 2010).)
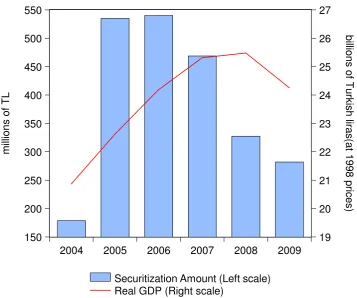
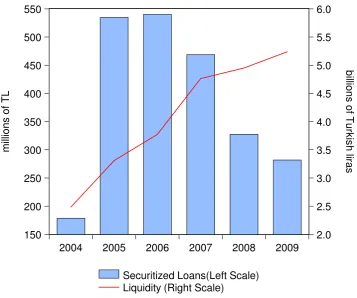
Figure 1 shows the level of securitization activity versus the real gdp for the years under analysis. As can be seen there is a direct and strong correlation between the two variables(with a correlation coefficient of ...) We do not observe the same high type of strong correlation when we evaluate securitization with respect to liquidity in the system. Figure 2 shows the banks’ on-balance sheet liquidity versus their securitization activity during the study period. We can observe that until 2007 both variables increased at the same time while after 2007 there is an inverse relationship between the two variables.
150 200 250 300 350 400 450 500 550 19 20 21 22 23 24 25 26 27
2004 2005 2006 2007 2008 2009
Securitization Amount (Left scale) Real GDP (Right scale)
[image:7.595.134.492.212.510.2]b illi o n s o f T u rki sh lir a s (a t 1 9 9 8 p ric e s) m ill io n s o f T L
Figure 1: Securitization Activity versus Real GDP
150 200 250 300 350 400 450 500 550
2.0 2.5 3.0 3.5 4.0 4.5 5.0 5.5 6.0
2004 2005 2006 2007 2008 2009
Securitized Loans(Left Scale) Liquidity (Right Scale)
m
ill
io
n
s
o
f
T
L
b
illi
o
n
s
o
f T
u
rk
is
h
lir
a
[image:8.595.134.492.214.512.2]s
Figure 2: Securitization Activity versus Liquidity
Figure 3: Securitization Activity versus Liquidity
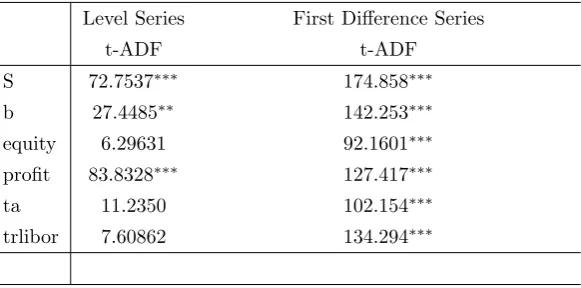
Table 2: Unit Root Tests
Level Series First Difference Series
t-ADF t-ADF
S 72.7537∗∗∗ 174.858∗∗∗
b 27.4485∗∗ 142.253∗∗∗
equity 6.29631 92.1601∗∗∗
profit 83.8328∗∗∗ 127.417∗∗∗
ta 11.2350 102.154∗∗∗
trlibor 7.60862 134.294∗∗∗
This table presents the ADF test results foer all variables in our dataset. The variables are in real terms.Sis the total securitization amount by the bank in each quarter in terms of Turkish Liras.brepresents liquidity, and is measured by summing up bank’s cash, due from other banks and total marketable securities;equityrepresents shareholders’ equity;
prof itis bank’s profit before taxes;tarepresents bank’s total assets andtrliboris the quarterly average of the Turkish lira interbank lending rate. * , ** and *** denote rejec-tion of the null hypothesis of unit root at, 10%, 5% and 1% significance level, respectively. Lags are chosen using Schwarz criterion.
5
Estimation Results
5.1
GMM Estimation
First, we checked for the stationarity of our dataset and find that profit, liquidity and securitization are non-stationary in levels. However, all the non-stationary variables are stationary in first difference. The results of the ADF-Fisher unit root tests for stationarity of the data are reported in Table 2. The lag structure was determined using the Schwarz criterion. We thus estimate our Equation (3.1) using the series in differences.
and efficiency of our estimates using the GMM. 3
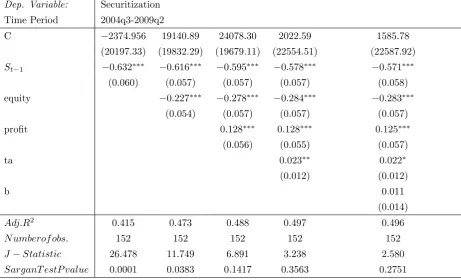
Table 3 provides the results of our estimation using specification (3.1). As can be seen changes in bank equity, profits, total asset and previous period securitization activity are all important drivers of securitization. We observe that securitization activity in the previous period has a significant and persistent negative effect on the amount of securitization banks undertake in each quarter. The coefficient of this variable ranges from -0.57 to -0.63 suggesting that an increase of 1 million Turkish liras in bank securitization activity in the previous period decreases a bank’s need to securitize in the current period by almost 600 thousand liras. The coefficient of the equity variable is also highly significant and also negative suggesting that as banks increase their equity levels their need for securitization also decreases. Although the coefficient of this variable is not as high as the change in the level of previous period securitization(ranges from -0.22 to -0.28), it suggests that an increase of 10 million Turkish liras in bank equity levels decreases the amount securitized by the banks in the current period by 2.5 million liras.We also observe that increase in profits or bank’s total assets decrease their need to securitize further highlighting the importance of strong balance sheets and bank efficiency in securitization activity. However, the insignificance of the bank liquidity variable(b) is worth mentioning. This suggests that banks’ liquidity positions are not necessarily a key factor in explaining their securitization activity.
5.2
Probit Estimation
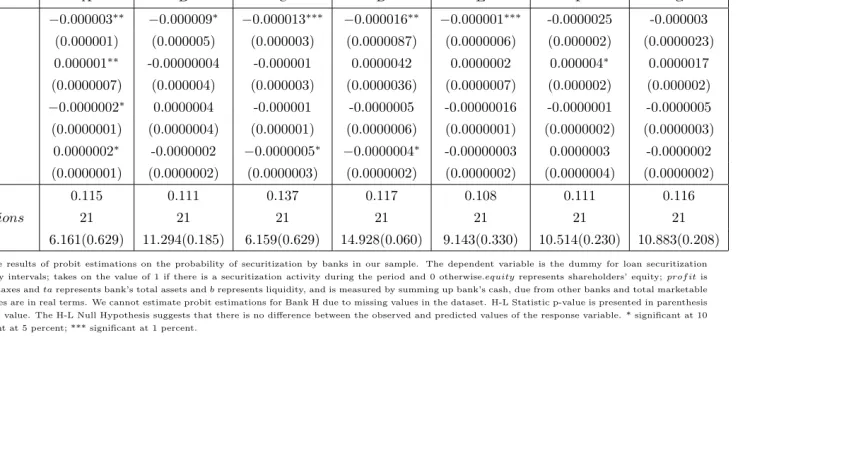
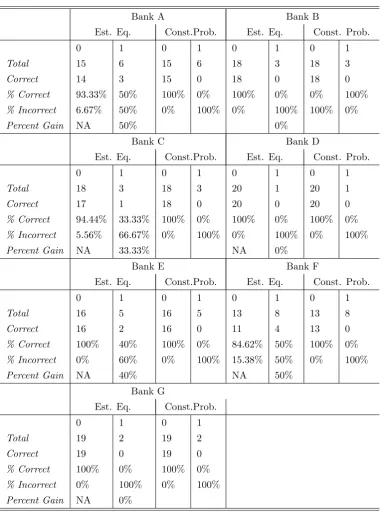
The results of our probit estimations for the banks in our sample are presented in Table 4. We do not use the actual securitization amounts but a dummy variable instead. McFadden R square and Hosmer-Lemeshow Statistics are also presented.
3
Table 3: Determinants of Securitization
Dep. Variable: Securitization Time Period 2004q3-2009q2
C −2374.956 19140.89 24078.30 2022.59 1585.78 (20197.33) (19832.29) (19679.11) (22554.51) (22587.92)
St−1 −0.632∗∗∗ −0.616∗∗∗ −0.595∗∗∗ −0.578∗∗∗ −0.571∗∗∗
(0.060) (0.057) (0.057) (0.057) (0.058) equity −0.227∗∗∗ −0.278∗∗∗ −0.284∗∗∗ −0.283∗∗∗
(0.054) (0.057) (0.057) (0.057) profit 0.128∗∗∗ 0.128∗∗∗ 0.125∗∗∗
(0.056) (0.055) (0.057)
ta 0.023∗∗ 0.022∗
(0.012) (0.012)
b 0.011
(0.014)
Adj.R2
0.415 0.473 0.488 0.497 0.496
N umberof obs. 152 152 152 152 152
J−Statistic 26.478 11.749 6.891 3.238 2.580
SarganT estP value 0.0001 0.0383 0.1417 0.3563 0.2751
All variables are adjusted for inflation by deflating each series by the cpi. Due to the existence of unit roots in our data series, we use the first difference of all variables in our specification.Sis the total securitization amount by the bank in each quarter in terms of Turkish Liras.
Table 4: Probability of Securitization Activity
Dependent Variable: Securitization of Loans†
T imeP eriod 2004Q2−2009Q2
A B C D E F G
equity −0.000003∗∗ −0.000009∗ −0.000013∗∗∗ −0.000016∗∗ −0.000001∗∗∗ -0.0000025 -0.000003
(0.000001) (0.000005) (0.000003) (0.0000087) (0.0000006) (0.000002) (0.0000023) profit 0.000001∗∗ -0.00000004 -0.000001 0.0000042 0.0000002 0.000004∗ 0.0000017
(0.0000007) (0.000004) (0.000003) (0.0000036) (0.0000007) (0.000002) (0.000002) ta −0.0000002∗ 0.0000004 -0.000001 -0.0000005 -0.00000016 -0.0000001 -0.0000005
(0.0000001) (0.0000004) (0.000001) (0.0000006) (0.0000001) (0.0000002) (0.0000003) b 0.0000002∗ -0.0000002 −0.0000005∗ −0.0000004∗ -0.00000003 0.0000003 -0.0000002
(0.0000001) (0.0000002) (0.0000003) (0.0000002) (0.0000002) (0.0000004) (0.0000002) M cF addenR2
0.115 0.111 0.137 0.117 0.108 0.111 0.116
N o.of observations 21 21 21 21 21 21 21
H-L Statistic 6.161(0.629) 11.294(0.185) 6.159(0.629) 14.928(0.060) 9.143(0.330) 10.514(0.230) 10.883(0.208)
This table shows the results of probit estimations on the probability of securitization by banks in our sample. The dependent variable is the dummy for loan securitization observed at quarterly intervals; takes on the value of 1 if there is a securitization activity during the period and 0 otherwise.equityrepresents shareholders’ equity;prof itis bank’s profit before taxes andtarepresents bank’s total assets andbrepresents liquidity, and is measured by summing up bank’s cash, due from other banks and total marketable securities.All variables are in real terms. We cannot estimate probit estimations for Bank H due to missing values in the dataset. H-L Statistic p-value is presented in parenthesis next to H-L Statistic value. The H-L Null Hypothesis suggests that there is no difference between the observed and predicted values of the response variable. * significant at 10 percent; ** significant at 5 percent; *** significant at 1 percent.
We checked for the goodness-of-fit of our model using the Hosmer-Lemeshow(HL) test. This Pearson χ2
-type test has as a null that the model provides sufficient fit to the data. We accept the null hypothesis in all specifications suggesting that our model had a good fit for our analysis. We observe equity has a negative and significant impact in explaining bank securitization for the five of the banks in our sample (Banks A through E). The sign of this variable is also worth mentioning. The negative coefficient of this variable suggests as bank equity increases in real terms banks’ probability to securitize their loans decrease. This finding confirms the results of our GMM estimation reported in Table 3 and also supports previous research findings in literature regarding the behavior of banks in more developed economies. In that regard, we observe that Turkish banks behave similarly as banks in more developed systems that have a longer history of securitization.
Another variable that takes on an expected sign in our findings is the profit variable. As was the case in the GMM estimations, in our probit estimations we observe that profit level influences a banks’ securitization decision. Although in only two of the probit estimations the profit variable has a significant positive coefficient, we can say that banks that are more profitable are more likely to securitize their loan portfolios.
Our estimations also reaffirm our expectations that as banks’ balance sheet liquidity increases their likelihood of securitizing decreases. The liquidity variable(b) takes on a negative and significant coefficient for two of the seven banks for which we were able to run a probit estimation.
21 quarters(28.6%), for Bank E 5 out of 21 quarters(23%), and for Bank F 8 out of 21 quarters(38%))
Table 5: Prediction Tables For Securitization of Loans
Bank A Bank B
Est. Eq. Const.Prob. Est. Eq. Const. Prob.
0 1 0 1 0 1 0 1
Total 15 6 15 6 18 3 18 3
Correct 14 3 15 0 18 0 18 0
% Correct 93.33% 50% 100% 0% 100% 0% 0% 100%
% Incorrect 6.67% 50% 0% 100% 0% 100% 100% 0%
Percent Gain NA 50% 0%
Bank C Bank D
Est. Eq. Const.Prob. Est. Eq. Const. Prob.
0 1 0 1 0 1 0 1
Total 18 3 18 3 20 1 20 1
Correct 17 1 18 0 20 0 20 0
% Correct 94.44% 33.33% 100% 0% 100% 0% 100% 0%
% Incorrect 5.56% 66.67% 0% 100% 0% 100% 0% 100%
Percent Gain NA 33.33% NA 0%
Bank E Bank F
Est. Eq. Const.Prob. Est. Eq. Const. Prob.
0 1 0 1 0 1 0 1
Total 16 5 16 5 13 8 13 8
Correct 16 2 16 0 11 4 13 0
% Correct 100% 40% 100% 0% 84.62% 50% 100% 0%
% Incorrect 0% 60% 0% 100% 15.38% 50% 0% 100%
Percent Gain NA 40% NA 50%
Bank G
Est. Eq. Const.Prob.
0 1 0 1
Total 19 2 19 2
Correct 19 0 19 0
% Correct 100% 0% 100% 0%
% Incorrect 0% 100% 0% 100%
Percent Gain NA 0%
6
Conclusion
Although it has been more than 10 years since the first Turkish bank has successfully sold its outstanding loan portfolio in international capital markets, the securitization market constitutes a relatively small portion of the the total credit market in the Turkey. However securitization is a growing area for Turkish banks and also for researchers that work on emerging markets. By using data from the Turkish Banks Association, in this paper we estimated the determinants of securitization during the 2004-2009 period in Turkey. We believe our research contributes to the current debate on securitization in emerging markets by being one of the first on this issue with focus on Turkey.
Appendix
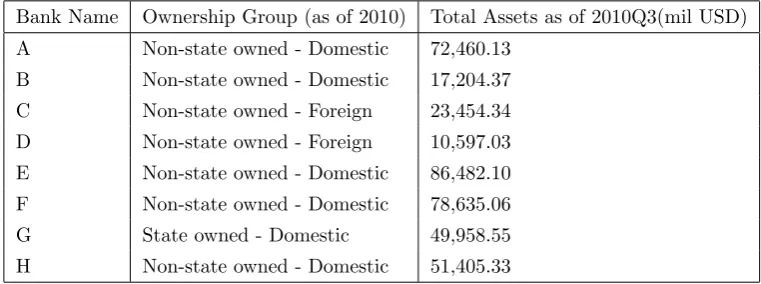
Table 6: Banks in the sample(Alphabetical)
Bank Name Ownership Group (as of 2010) Total Assets as of 2010Q3(mil USD) A Non-state owned - Domestic 72,460.13
B Non-state owned - Domestic 17,204.37 C Non-state owned - Foreign 23,454.34 D Non-state owned - Foreign 10,597.03 E Non-state owned - Domestic 86,482.10 F Non-state owned - Domestic 78,635.06 G State owned - Domestic 49,958.55 H Non-state owned - Domestic 51,405.33
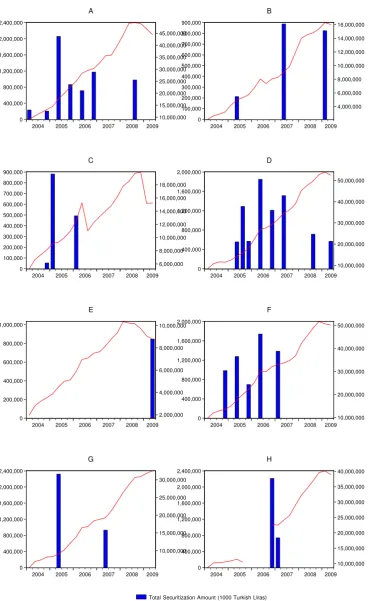
0 400,000 800,000 1,200,000 1,600,000 2,000,000 2,400,000 10,000,000 15,000,000 20,000,000 25,000,000 30,000,000 35,000,000 40,000,000 45,000,000
2004 2005 2006 2007 2008 2009
A 0 100,000 200,000 300,000 400,000 500,000 600,000 700,000 800,000 900,000 4,000,000 6,000,000 8,000,000 10,000,000 12,000,000 14,000,000 16,000,000
2004 2005 2006 2007 2008 2009
Total Securitization Amount (1000 Turkish LIras) Outstanding Loans(1000 Turkish Liras)
B 0 100,000 200,000 300,000 400,000 500,000 600,000 700,000 800,000 900,000 6,000,000 8,000,000 10,000,000 12,000,000 14,000,000 16,000,000 18,000,000
2004 2005 2006 2007 2008 2009
C 0 400,000 800,000 1,200,000 1,600,000 2,000,000 10,000,000 20,000,000 30,000,000 40,000,000 50,000,000
2004 2005 2006 2007 2008 2009
D 0 200,000 400,000 600,000 800,000 1,000,000 2,000,000 4,000,000 6,000,000 8,000,000 10,000,000
2004 2005 2006 2007 2008 2009
E 0 400,000 800,000 1,200,000 1,600,000 2,000,000 10,000,000 20,000,000 30,000,000 40,000,000 50,000,000
2004 2005 2006 2007 2008 2009
F 0 400,000 800,000 1,200,000 1,600,000 2,000,000 2,400,000 10,000,000 15,000,000 20,000,000 25,000,000 30,000,000
2004 2005 2006 2007 2008 2009
G 0 400,000 800,000 1,200,000 1,600,000 2,000,000 2,400,000 10,000,000 15,000,000 20,000,000 25,000,000 30,000,000 35,000,000 40,000,000
2004 2005 2006 2007 2008 2009
[image:18.595.130.499.68.670.2]H
References
Affinito, M., and E. Tagliaferri(2010): “Why do (or did?) banks securitize their
loans? Evidence from Italy,” Temi di discussione (Economic working papers) 741, Bank of Italy, Economic Research Department.
Arellano, M., and S. Bond (1991): “Some Tests of Specification for Panel Data:
Monte Carlo Evidence and an Application to Employment Equations,” Review of Economic Studies, 58(2), 277–97.
Berger, A. N., R. J. Herring, and G. P. Szego (1995): “The role of capital in
financial institutions,” Journal of Banking & Finance, 19(3-4), 393–430.
Dell’Ariccia, G., D. Igan, and L. Laeven (2008): “The U.S. subprime mortgage
crisis: a credit boon gone bad?,” Proceedings, (May), 201–204.
DeMarzo, P. M. (2005): “The Pooling and Tranching of Securities: A Model of
In-formed Intermediation,” The Review of Financial Studies, 18(1), pp. 1–35.
Jobst, A. A.(2010): “Sovereign Securitization in Emerging Markets,”Journal of
Struc-tured Finance, Vol. 12, No. 3, 2006.
Jones, D. (2000): “Emerging problems with the Basel Capital Accord: Regulatory
capital arbitrage and related issues,” Journal of Banking & Finance, 24(1-2), 35– 58.
Loutskina, E. (2010): “The Role of Securitization in Bank Liquidity and Funding
Management,” Journal of Financial Economics (JFE), Forthcoming.
Parlour, C. A., and G. Plantin (2008): “Loan Sales and Relationship Banking,”