Munich Personal RePEc Archive
An Analysis of Core Factors Contributing
to U.S – China Trade Imbalance
Ahmed, Khalid and Long, Wei
Wuhan University of Technology, P.R China
2012
Online at
https://mpra.ub.uni-muenchen.de/44733/
AN ANALYSIS OF CORE FACTORS CONTRIBUTING U.S – CHINA TRADE IMBALANCE
Khalid Ahmed
Wuhan University of Technology, P.R. of China mangrio85@yahoo.com
Wei Long
Department of Economics Wuhan University of Technology, P.R. of China
ABSTRACT
This paper aims to highlight the trade imbalance between United States and China based on the analysis of core factors contributing the imbalance. These factors are comprises of trade inequality, exchange rate issue, difference in basic economic structure of both the countries, and methodology of calculating trade figures. This paper also highlights that where both the countries differ in their point of view on their bilateral trade and why? Beyond doubt this imbalance leads United States to face huge deficit and China to enjoy the giant surplus in mutual trade. Now, how can we adjust the figures and narrow down the differences? The paper isalso discussing the other issues which have reasonable implication on U.S -China trade relations. It also enumerates the future consequences on their bilateral trade keeping in view the current scenario. The importance of this paper isfurther enhanced as the trade imbalance is also counted as one of the factors of 2008 recession which is not yet fully over because there is very slow recovery in developed countries and relatively faster in developing countries. The analysis is based on the U.S trade data from 2001 to 2010.
Key Words: Imports, exports, Exchange Rate, Economic Structure
1. INTRODUCTION
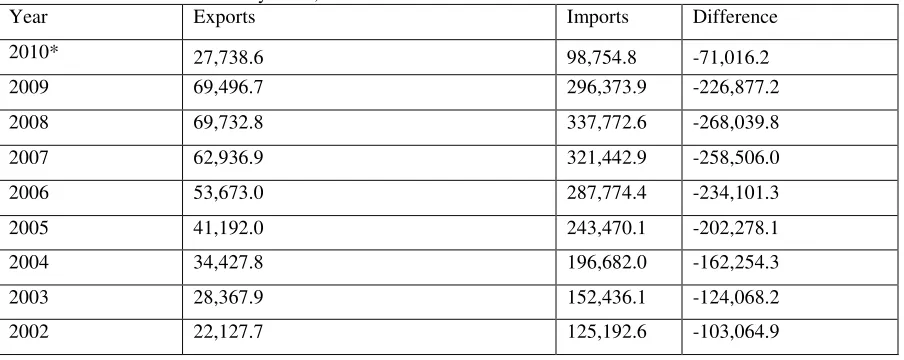
United States is considered as the worlds most developed country and has been the leading exporter of the world. But first it was pushed back by the Germany and now outclassed by China. Once General Motors was the world’s largest company but in year 2007 Toyota Motors from Japan replaced it with higher production and became the world’s largest Automobile manufacturer. Moreover, in the year 2008 China became the world’s biggest market for automobiles overtaking United States. United States dollar is loosing its value and Euro is more incirculation in the market than U.S dollar. For the first time in history the United States trade deficitreached $268 billions in trade with China in 2008. China has gained the status of third largest trade partner of United States after Canada and Mexico and has emerged as the fourth biggest economy of the world. China is still behind Canada and Mexico by huge margin as United States has free trade agreement with these countries. The total trade deficit of U.S reached its peak in 2006, although it started contracting in 2007 and 2008 but it continues to rise with China (See Table 01). In recent years China’s increasing trade surplus is a matter of unrest for U.S but it is not a hard nut to crack. There are some implications and technical
exports to China and protectionist policies adopted by U.S. The other controversial issues like; China’s downward manipulation of Yuan, the emergence of China as the biggest creditor to U.S, United State’s weak control over its financial system? And increasing intervention of foreign central banks especially China and Japan has caused financial collapse and trade imbalance of United States. In the context of some exchange rate regime Analysts including David Pilling, the Asia editor of the Financial Times, and Brad Setser, an economist formerly at the Council on Foreign Relations and now at the National Economic Council, argue that far from a sign of strength, ‘‘Beijing’s accumulation of vast foreign reserves is the side-effect of an
economic model too reliant on exports.’’ Writes Pilling:
“The enormous trade surplus is the product of an undervalued [RMB] that has allowed others to consume Chinese goods at the expense of the Chinese people themselves. Beijing cannot dream of selling down its Treasury holdings without triggering the very dollar collapse it purports to dread. Nor are its shrill calls for the U.S. to close its twin deficits—which would inevitably involve buying fewer Chinese goods—entirely convincing. Rather than exposing the superiority of China’s state-led model, the global financial crisis has laid bare the compromising embrace in which the U.S. and China find themselves”
2. PRESENT SCENARIO
2.1. TRADE BY VOLUME
In recent years China has emerged as the third largest exporter of all goods and services in the global economy followed by Germany and the US –In 2006, China accounts for around 7% of totalworld trade. By 2030 it is expected to rise to 15% (et al Sarah, 2005). More than half of China's exports are currently capitalized by foreign companies. Most of this capitalization comes from neighboring Asian companies in Japan and South Korea. United States and China are major trade partners, China stands third biggest trade partner of United States after Canada and Mexico and on the other hand United States is top trade partner to the China. The Chinese trade surplus started to rise from1985 and touched the highest point in 2008.
[image:3.612.91.543.530.710.2]Although China does not enjoy any free trade agreements with United States like Canada and Mexico yet the percentage rise change in the trade of United States with China during 2000 to 2007 has been recorded as is 301%. However, which has risen by only 44% with rest of the world during same time period it is only 44% with the rest of the world during the same period (U.S Census Bureau 2008). This volume is continued to rise until 2008 recession, when financial crisis collapsed the U.S financial market and affected the global economy severally rest of the world. This increasing trade deficit was ignored by the U.S consequently could not focus the bilateral trade and it continues to add to deficit.
Table 01: U.S China trade history since, 2001
2001 19,182.3 102,278.4 -83,096.1
SOURCE: U.S. Census Bureau, Foreign Trade Division, Data Dissemination Branch, Washington, D.C. 20233
NOTE: All figures are in millions of U.S. dollars, and not seasonally adjusted unless otherwise specified. *till April 2010
2.2. GOODS TRADED
China’s major exports to United States include electric machinery, power generation equipment and games & toys. Whereas United States’ main exports to china includeComputer & equipment, transport machinery, chemical and scrap. If we analyze the percentage change in exports goods to United States, steel and plastic articles are at the top Chinese exports to US where steel exports alone increased by 24% in the year 2008 as compared to previous year 2007 and slightly decline in 2009. The goods traded between China and United States does not reflect the trade equality, especially when it comes to high
tech trading, the Chinese high tech exports rose by 10% over the period but its only 3% by the United States over the same period. The special case is of Aircraft and Spaceships, which shows 29% decline over the period (China's Customs Statistics). As we see that Canada is the biggest trade partner of United States and high tech goods have reasonable proportion of their trade if same pattern is adopted and United States allow China to import the same high tech goods with lower tariffs and increasing quota can reduce U.S trade deficit. This issue is considered as less economical more political.
2.3. PROPORTION IN WORLD TRADE
In recent years, Western business and political leaders have voiced concerns that China’s economic rise is posing severe competition. They generally identify two types of threats: a quantitative and a qualitative. First, there is a perceived quantitative threat related to China's stellar export performance. Since 1992, China's exports have grown at an annualized rate of 18 percent, more than twice the growth rate of world exports. As a result, its share of world exports has surpassed that of Japan to become the world’s third largest in 2008, after United States and Germany. This has garnered the fear that China is eating away Western countries’ market shares. Second, there is a perceived qualitative threat that the goods that China exports are becoming increasingly sophisticated. Where fifteen years ago China was primarily an exporter of low-tech products such as apparel, toys and footwear, today it has become the world's largest exporter of electronics products.
This has caused concern that China is rapidly moving up the technology ladder and becoming competitive in areas of comparative advantage for Western economies (Chang Hong, 2008).
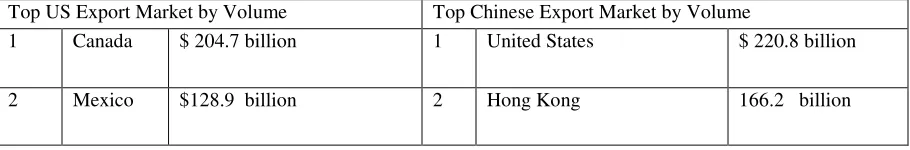
[image:4.612.86.541.631.706.2]United States is still a world’s largest economy as for as trade is concerned, and china comes at 4th number. Now keeping in view the China’s increasing share in world trade and its rapid access to Asian and European markets, after the United States, Japan, South Korea, Germany, Australia, and Russia its main trade partners. The volume of trade is increasing over the period with trading partners both in Imports and exports (See table:2). Now as a result United States is loosing its trade share gradually in these regions. After the financial collapse U.S economy is facing dual trade loss first at its domestic and then rest of the world. The negative saving ratio has made the situation more severe.
Table 02: Top U.S and China export markets by volume
Top US Export Market by Volume Top Chinese Export Market by Volume
1 Canada $ 204.7 billion 1 United States $ 220.8 billion
3 China* $ 69.5 billion 3 Japan $ 97.9 billion
4 Japan $ 51.1 billion 4 South Korea $ 53.7 billion
5 U.K $ 45.7 billion 5 Germany $ 49.9 billion
[image:5.612.88.540.73.160.2]Source: US Department of Commerce, US International Trade Commission & PRC General Administration of Customs, China's Customs Statistics.
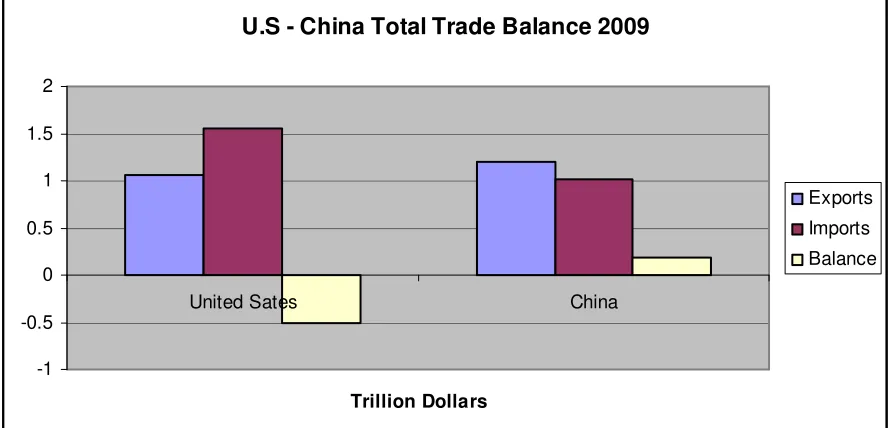
Figure: 1 U.S and China individual net trade balance
U.S - China Total Trade Balance 2009
-1 -0.5 0 0.5 1 1.5 2
United Sates China
Trillion Dollars
Exports Imports Balance
Source: U.S Census Bureau and China Statistical Yearbook, 2009.
3. ANALYSIS OF CORE FACTORS
3.1.TRADE FIGURE DIFFERS ENORMOUSLY
Both the countries are agreed that there is trade imbalance between both the countries but there is a contradiction in how big the imbalance is? The different figures are quoted while calculating the trade statistics. So there is a large and growing difference between the official trade statistics released by the United States and those released by People’s Republic of China. According to the United States, the 2009 bilateral trade deficit with China was $226.8 billion. According to China, its trade surplus with the United States was $143.273 billion—$83.5 billion less than U.S recorded figure (See Table: 3).
Table: 3 list the official trade statistics from the United States and China for the years 2001 to 2009, using official trade data according to both the countries; the U.S. trade deficit with China is
large and growing. Where the two sides differ is how big the deficit is and how fast it is growing. From the U.S. perspective, its bilateral trade deficit with China more than tripled in value over the last eight years, from just over $83 billion in 2001 to over $226 billion in 2009. However, from the Chinese view, its bilateral trade surplus with the United States increased more than six fold over the last eight years, from about $28 billion in 2001 to nearly $143 billion in 2009.
[image:5.612.92.536.200.414.2]production of goods and loading them on to the cargo vessels which is generally followed by all countries but except United States. United states calculate it F.O.B less loading. Another principle is imports and exports should be calculated with same base such as, F.O.B. Hong Kong re-export make the problem more complicated. Initially goods are shipped to the Hong Kong subsequently re-exported to the different destinations including United States and China
(mainland). Buyer in Hong Kong takes legal possession and can undertake minor processing. For china it’s not clear that how successfully the government is tracking down the origins and final destinations of goods. For U.S reports, imports are assumed to be accurately recorded including re-export through Hong Kong and exports probably do not include those through Hong Kong re-export.
Table 3: U.S. and Chinese trade figures, 2001-2009 (Billion U.S. dollars)
U.S. Trade Figures Chinese Trade Figures Exports Imports To From Exports Imports United United
to China From China Trade States States Trade Year (F.A.S.) (C.V) Balance (F.O.B) (C.I.F) Balance ______________________________________________________________________________________ 2001 19.235 102.280 -83.045 54.277 26.204 28.073 2002 22.053 125.168 -103.115 69.959 27.228 42.731 2003 28.418 152.379 -123.961 92.510 33.883 58.627 2004 34.721 196.699 -161.978 124.973 44.653 80.320 2005 41.837 243.462 -201.625 162.939 48.735 114.204 2006 55.224 287.773 -232.549 203.516 59.222 144.294 2007 65.238 321.508 -256.270 232.761 69.861 162.900 2008 71.457 337.790 -266.333 252.327 81.486 170.841 2009 69.576 296.402 -226.826 220.706 77.433 143.273 ______________________________________________________________________________________
Source: World Trade Atlas, U.S. International Trade Commission
3.2. HUGE GAP IN SERVICE TRADE
Services trade is an important element of international trade and china is a net importer of services and deficit has increased since 1990’s, on the contrary United States is a World#1 exporter and importer of commercial services and a net exporter. The U.S services trade surplus with China was $ 5.4 billion in 2007. In this regard United States has privilege to lessen the merchandise trade deficit with China through
encouragement of services trade. If we take a glance of GDP configuration of both the countries by sector, United States’ services sector comprises 76.9 % of GDP and only 40.5 % for China. It reveals that U.S economy is more competitive than Chinese and shows the high innovative and standard. For china its merchandise trade is much more important as its industrial sector composes of almost 50% of GDP, but for United States merchandise trade has relatively small portion as compared to the services sector trade.
U.S and China GDP by Sector (% of GDP)
0 10 20 30 40 50 60 70 80 90
Agriculture Industry Services
China U.S
Source: China Statistical year Book & U.S Census Bureau, 2009
3.3. DIFFERENCE IN BASIC ECONOMIC STRUCTURE
Since United States and China represent different economic categories consequently have different economic structure. China represents emerging economies and counted amongst the developing countries category. China is still a transition economy with many perverse incentives in the much diminished but still significant state-owned enterprise (SOE) sector, and the monopoly state banking system. The existence of these perverse incentives, it efficiently handled through quantitative targets enforced by administrative means than through the impersonal price mechanisms in these particular markets. it is aware, of course, that we are talking about using what are usually regarded as "second-best" economic policies to address some of China's macroeconomic challenges, and that this is a path well-trodden by deregisterstates toward the slippery slopes of economic mismanagement (et al, Wing, 2005). Chinese policy stance is based on their assessment market oriented practices are yet not the norm in many parts of Chinese economic life, and that it would be ideological rather than analytical to be a market fundamentalist in economic management. Free-market policy tools work well only in a free market economy, and China is not yet fully a free-market economy. China is basically a partially reformed economy and striving towards liberalization. Chinese economy mainly produces secondary goods and heavily relies on it. Most of
the technology and services are imported from the developed countries like United States, Japan, Germany and South Korea etc. Chinese comparative advantage lies in cheap labor and tendency of low price is the leading factor in determining its fast growing share in global trade.
United States economy is fully equipped economy and considered as the world’s most advanced economy. So their economy has no primary industry, relatively small portion of secondary sector and huge tertiary (service) sector. As we already discussed in previous paragraph, it represent about 80% of total GDP. It is because as the countries grew richer their demand shifts away from the traded goods (such as food, clothing, and manufactures) towards non traded goods (such as housing, healthcare, education and other services). It has taken place in United States: the share of personal consumption expenditure devoted to the services has risen steadily in recent decades at the expense of expenditure on durable goods and non durable goods. This evolution of demand has shift in the configuration of U.S economy away from the production of the merchandise goods towards the production of services. (The more rapid productivity growth in goods-producing sectors, which has diminished the price of goods relative to services, has also contributed to this result.) As a result, the traded goods sectors of the economy—specifically, agriculture, mining, and manufacturing—have declined over the time
So this is a normal behavior of economies when they enter from one phase to another there are some structural changes which take place and same happened in U.S and Chinese trade. United States import most of merchandise goods which it either doesn’t produce or produce at small
level. People spend more on services rather than on durable and non durable goods. On the other hand Chinese economy heavily depends upon the secondary industry mostly include mining, manufacturing, production and construction etc.
3.4. EXCHANGE RATE (DOLLAR-YUAN)
United States blame that Yuan is manipulated and is undervalued, now question arises that, who will benefit from the rise of Yuan? This is very critical issue because china does not want to take risk at the cost of growth rate which it thinks it’s imperative to maintain at 10%, and valuable exports share in the world market. The 20% appreciation of Yuan will reduce the U.S trade deficit by $40-55 billion and simultaneously help China to reduce the agriculture good deficit in which U.S has surplus and as a result China can import more wheat and corn. It can also bring competitiveness in china’s agriculture which may hurt farmers but benefit consumers.
For dollar the suggestion like, “The huge current and trade deficits of the United States cannot continue indefinitely because doing so would develop a permanent gift to the U.S. economy. The process that will cause this gift to shrink and that will eventually cause it to reverse is a reduction in the value in the dollar. The dollar will loose value as private investors and governments become unwilling to accept the risk of increasing value of dollars in their investments, especially in a context in which they realize that the dollar must fall to reduce the trade imbalance. Although a more competitive dollar is the mechanism that will because the U.S. trade deficit to decline, the basic requirement for a lower trade deficit is an increase in the U.S. national saving rate. So a rise will be driven by higher household savings of the coming years as the two primary forces that depressed savings in recent years are reversed: the exceptionally rapid rise in household wealth and the high level of mortgage refinancing with equity withdrawal. (Martin S. Feldstein 2008).
3.5. FOREIGN INVESTMENT FIRMS IN CHINA AND EXPORT PROCESSING
Foreign investment firms in China have substantial proportion in the exports and played significant role in export volume. Large number of foreign investment firms are involved in processing trade especially those with investment by businesses in the neighboring economies. While china is having increasing rising trade surplus with the U.S it is running increasing trade deficit with some neighboring economies including Korea, Japan and Taiwan, part of increasing trade surplus with U.S is a result of these regional manufacturing relocations.
A particular characteristic of China’s exports is the large importance of export processing trade. Since China's Opening Up in 1979, China has set up a number of export-processing zones along China's coastal region to attract foreign investment and technology transfers. As many companies from North America, the European Union, Japan and the Newly Industrialized Economies (Singapore, the Republic of Korea, Hong Kong and Taiwan) moved their labor-intensive assembly plants to China in a bid to cut production cost, this has led to a rapid rise in China's export-processing trade (Naughton, 2007). The large role of export-processing trade may have been significantly biased upward the perceived competitive threat from China.
Source: Author
Protectionism
In the United States, the 109th U.S. Congress introduced 27 pieces of anti- China trade legislation. And the current 110th U.S. congress introduced over a dozen in just its first three months in office (Scheve and Slaughter, 2007).The protectionism policy will further hurt the U.S economy rather than to improve. The great depression and current global crisis have close similarities as both start with sharp assets price fall and near collapse of financial system, both are global in reach, fall in stock price then housing prices while increasing uncertainty in consumers and business. The substantial fall in demand, consumption and investment affect the GDP. The protectionism can not be the intention of United States as it has already a lesson from great depression. This time it means that U.S alienate the rest of world which will affect the investment in U.S treasury as foreigners will sell all the holdings overnight and can cause panic.
4. CONCLUSION
In this paper I have demonstrated that U.S - China trade imbalance is not a matter of much concern because it is obvious when economies pass through the evolution (from Underdeveloped to developing and developed) their behavior changes, just like in case of China, its economy is undergoing the transformational processes and will assess and rectify itself with the passage of time. Therefore, owing to difference in economic structure and basic constituents, the increasing demand for Chinese goods in U.S is for those goods which U.S either don’t produce anymore or less than its domestic demand. Chinese surplus is solely spread over the merchandise goods. However, U.S can balance this through services trade, military and high tech goods exports which are either banned for china or quota is imposed. As a result United States should move out of preferential trade zone like NAFTA and EU and should broaden the circle of free trade which is in its interest. The strong criticism from the US and the increasing pressure for exchange regime reform may not be very well-grounded as the trade U.S.
China Other
Economies
Other Economies Exports
Exports
Exports
Invest
figures are distorted due to various factors. This is obvious and economic principle when dollar will be higher than its subjected value will tend to enhance the risk for investors and government eventually, it will move downward to attain the balance which will further help to reduce U.S trade deficit. The exchange rate is not only a factor of imbalance, the regional manufacturing relocations, and export processing of foreign firms is also one of the factors. The huge inflow of FDI is contributing to China’s GDP and international trade Moreover, U.S saving rate must be increased and dollar must revalued. The trade relations should not be politicized and
should refrain from imposing quotas and duties which hurt bilateral trade relations and cause gap. In general the trade disputes are better solved through cooperation. Strong and harmonious trade relation are in the interest of both.
As there is a huge difference in bilateral trade data. Now, in order to calculate the Trade Data, both countries should adopt the similar statistical method as to avoid the errors and double counting especially in case of Hong Kong.
REFERENCES
Sarah Y Tong, 2005, Dept. of Economics, East Asian Institute, National University of Singapore, 2005/12
Wing Thye Woo (2005), “The Structural Nature of Internal and External Imbalances in China”, Economics Department University of California.
Ari Van Assche, Chang Hong (IMF) and Veerle Slootmaekers, (2008), China’s International Competitiveness:Reassessing the Evidence,
LCIEP, discussion paper 205.
Economist, 14 April 2007, pg12.
Michael F.Martin Congress Research Service, Analyst in Asian Trade & Finance, 2009/03/27
Baron JC Pfetten-Iseux, China Service Industry, October 2009.
K.C. Fung,Lawrence J. Lau and Yangyan Xiong. June 2006. Stanford Center for International Development, Working Paper No. 278, Adjusted Estimates of United States-China Bilateral Trade Balances—An Update.
Martin S. Feldstein, (2008 April )NBER Working Paper No. 13952.
Carolyn Bartholomew, Chairman,( 2009).U.S – China Economic and Security Review Commission, Annual Report to Congress Nov,
Jiawen Yang, Ph.D, Professor George Washington University.
Thomas Klitgaard and Karen Schiele, (May 1997) Federal Reserve Bank of NewYork, Current Issues in Economics and Finance,
Volume 3 Number 7, Douglas A. Irwin, (2005), Free Trade Under Fire: Second Edition, Princeton University Press Ari Van Assche, Chang Hong (IMF) and Veerle
Slootmaekers, Licos Discussion Paper Series, 205/2008
U.S Census Bureau,
http://www.census.gov/foreign-trade/balance/index.html National Bureau of Statistics, China Trade in Cyber state,
http://www.techamerica.org/trade
World Bank Data & Statistics,