An Ensemble Method for Intrusion Detection with
Conformity to Data Variability
MWITONDI, Kassim, SAID, R and ZARGARI, Shahrzad
<http://orcid.org/0000-0001-6511-7646>
Available from Sheffield Hallam University Research Archive (SHURA) at:
http://shura.shu.ac.uk/16538/
This document is the author deposited version. You are advised to consult the
publisher's version if you wish to cite from it.
Published version
MWITONDI, Kassim, SAID, R and ZARGARI, Shahrzad (2017). An Ensemble
Method for Intrusion Detection with Conformity to Data Variability. In: 8th Annual
International Conference on ICT : Big Data, Cloud and Security (ICT-BDCS 2017,
Singapore, 21-22 August 2017. (Unpublished)
Copyright and re-use policy
See
http://shura.shu.ac.uk/information.html
Page
1
of
7
An Ensemble Method for Intrusion Detection with Conformity to Data Variability
Mwitondi1, K., Said, R. and Zargari2, S.
Sheffield Hallam University, Department of Computing1,3
[email protected]; [email protected]
Al Ain University of Science and Technology, Al Ain, UAE
Abstract
The high volume of traffic across modern networks entails use of accurate and reliable automated tools for intrusion detection. The capacity for data mining and machine learning algorithms to learn rules from data are typically constrained by the random nature of training and test data; diversity and disparity of models and related parameters and limitations in data sharing. We propose an ensemble method for intrusion detection which conforms to variability in data. Trained on a high-dimensional 82332x27 data attributes cyber-attack data variables for classification by Decision Trees (DT). Its novelty derives from iterative training and testing several DT models on multiple high-dimensional samples aimed at separating the types of attacks. Unlike Random Forests, the number of variables, p, isn’t altered to enable identification of the importance of predictor variables. It also minimises the influence of multicollinearity and strength of individual trees. Results show that the ensemble model conforms to data variability and yields more insightful predictions on multinomial targets.
Keywords: Bagging, Classification, Cross-Validation, Cyber-Security, Data Mining, Decision Trees, Intrusion Detection, Over-fitting, Random Forest
1 Introduction
The need for reliable automated tools for intrusion detection has been steadily growing with data traffic across networks. Various data mining and machine learning applications have been developed and applied in cyber-security [1] and [2]. However, the capacity for these algorithms to learn and generalise rules from data are typically constrained by the random nature of training and test data; diversity and disparity of models and related parameters and limitations in data sharing. We propose an ensemble method for intrusion detection which conforms to variability in data. It consists of multiple models trained and tested on high-dimensional subsamples from an 82,332x27 data source, iteratively compiling and averaging classification results over repeated runs. While its main ideas derive from Bayesian statistics [3], domain partitioning [4] and Bagging [5], it proceeds from dimensional reduction to classification utilising multiple
samples and multiple models. That way, it addresses issues of randomness in predictive modelling. The algorithm’s novelty derives from the foregoing features and its adaptability to different algorithms. The paper’s objectives are two-fold 1) To develop, train and test an ensemble model that
conforms to data variability.
2) To carry out predictive modelling of intrusion using high-dimensional historical data.
The paper is organised as follows. Section 2 presents previous work relating to cyber-attack predictions. Methods follow in Section 3 and data analyses, results and discussions are in Section 4. Concluding remarks and recommended potential future directions are in Section 5.
2 Background
Exploitation of vulnerabilities in computer systems remains a major issue among system administrators responsible for protecting data in all fields. System administrators typically resort to a variety of techniques in their quest to evade intrusion - including a variety of intrusion detection/intrusion prevention (IDS/IPS) solutions, typically in combination with firewalls [6]. These highly-correlated detection and prevention activities are generic in monitoring package traffic flows, recording, analysing intervening where necessary [7]. Related approaches include “host-network-application” based intrusion detection techniques which compare inbound and outbound packet flow patterns to “expected” patterns [8]. Signature-based intrusion detection techniques trace “specific signatures” such as byte combinations but despite their relatively higher accuracy, they remain vulnerable due to their sole dependency on the contents of current ontologies. Research efforts continue to build more robustness into the method with one recent work proposing a methodology for transforming behaviour rules to a state machine to help detect intrusion into medical devices [9].
Page
2
of
7
serious limitations in the Big Data and Cloud Computing era as security moves increasingly towards virtual machines [10]. In the next exposition, we outline the methods used to fulfil the two objectives in Section 1.
3 Methods
A large, high-dimensional dataset is required to train and test multiple algorithms on multiple samples. This section describes key aspects of the data attributes – generation, cleansing, exploration and preparation for mining as well as the mechanics of the proposed ensemble.
3.1 Data Sources
Data was obtained from thousands of raw network packets of the UNSW-NB1 15 created by the IXIA PerfectStorm tool in
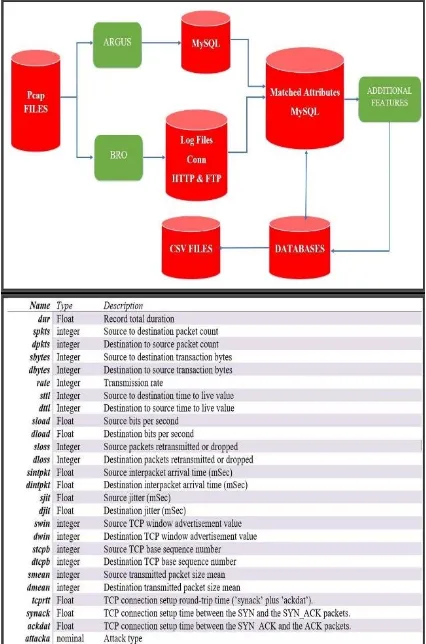
[image:3.595.322.551.175.646.2] [image:3.595.51.264.311.633.2]the Cyber Range Lab of the Australian Centre for Cyber Security (ACCS). The dataset, created using twelve algorithms [11] [2], running through the process in Figure 1 (bottom) represent a matrix of attributes in the top panel of Figure 1.
Figure 1: Data generation [2] (top) and resulting data attributes (below)
1
https://www.unsw.adfa.edu.au/australian-centre-for-cyber-security/cybersecurity/ADFA-NB15-Datasets/
The comma separated values (CSV) in Figure 1 represent a high-dimensional data denoted by
Ω = [𝜉𝑖𝑗], 𝑖 = 1,2,3, … , 𝑛 𝑎𝑛𝑑 𝑗 = 1,2,3, … , p (1) where 𝑛 is the number of observations and 𝑝 is the number of variables. Our analyses utilise 82,332 observations on 27 variables. We denote the multivariate data as follows.
X ⊂ Ω | X = [𝑥𝑖𝜏], 𝑖 = 1,2,3, … , 𝑛 𝑎𝑛𝑑 𝜏 = 1,2,3, … , m ≤ p
(2)
Page
3
of
7
The LHS panel in Figure 2 presents the class label with ten levels – nine attack types and the normal traffic whereas the RHS panel adds a binary class label combining all 9 attack types into one class and normal traffic in another. Our modelling strategy is outlined below.
3.2 Modelling Strategy
Assuming a correct classification incurs no loss, then given data X and two classes 𝐶1,2 a prediction rule is defined as 𝑃(𝑋|𝐶1)
𝑃(𝑋|𝐶2)>
𝑐21𝑃(𝐶2)
𝑐12𝑃(𝐶1) where 𝑃(𝐶1,2) are the class priors and
𝑐21/12 represent the cost of incorrectly allocating an
observation to a class which also implies that the probability of class given data is greater than the corresponding loss i.e.,
𝑃(𝐶1|𝑋) > 𝑐21
𝑐12+𝑐21 . It can be shown that the Bayesian
decision rule for minimum risk is the weighted sum
Ψ = 𝑐12𝑃(𝐶1)𝜔1+ 𝑐21𝑃(𝐶2)𝜔2 (3)
where 𝜔1 and 𝜔2 are the probabilities of misclassifying 𝐶1
and 𝐶2 respectively [12]. Generally,
Ψ =1
𝑛∑ ℒ(𝑦̂𝑖, 𝑦𝑖) 𝑛
𝑖=1
where ℒ(𝑦̂𝑖, 𝑦𝑖) = {
0 for 𝑦̂𝑖= 𝑦𝑖 1 for 𝑦̂𝑖≠ 𝑦𝑖
(4)
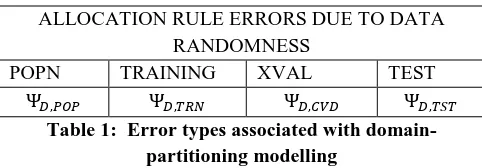
These parameters are data dependent with the empirical rule typically being associated with randomness due to the allocation region and randomness due to assessing the rule by random training and validation data [13] as exhibited in Table 1.
ALLOCATION RULE ERRORS DUE TO DATA RANDOMNESS
POPN TRAINING XVAL TEST
[image:4.595.37.278.475.559.2]Ψ𝐷,𝑃𝑂𝑃 Ψ𝐷,𝑇𝑅𝑁 Ψ𝐷,𝐶𝑉𝐷 Ψ𝐷,𝑇𝑆𝑇
Table 1: Error types associated with domain-partitioning modelling
To minimise the error our algorithm repeatedly samples from the sub-space X ⊂ Ω and applies multiple DT models for both training and testing as outlined below.
3.2.1 Decision Trees and Random Forests
If the data attributes in Section 3.1 are used, one at a time, to split the data into “normal” and “abnormal” flows by only considering the number of observations at node 𝑁∗ then,
given the attribute 𝑥𝑗 ∈ 𝑋 and adopted threshold, the decision
tree rule is defined as
{𝐶1= {𝜂 ∈ 𝑁 ∗: 𝑥
𝑗 ≤ 𝑚
𝐶2= {𝜂 ∈ 𝑁∗: 𝑥𝑗 > 𝑚
(5)
The observations in each of the two sets lie on either side of the hyper-plane 𝑥𝑗= 𝑚 chosen in such a way that a given
measure of impurity is minimised. While training and testing this rule on different (random) datasets are the main causes of the variations in Table 1, other variations in decision tree model results derive from setting model parameters.
3.2.2 Ensembled Implementation, Assessment and Comparison
Page
4
of
7
[image:5.595.329.545.182.399.2] [image:5.595.52.263.520.714.2]The algorithm learns a model 𝐹(𝜑) = 𝑃⏟ (𝑥,𝑦)~𝐷
[𝜑(𝑥) ≠ 𝑦], where D is underlying distribution, and it provides the mechanics for assessing the models. Its outputs provide great insights into the overall behaviour of the data particularly how the attributes relate to the target variable.
4 Data Analyses, Results and Discussions
Optimal results of random forests obtained from multiple runs are presented in Figure 3 with an estimated Out-of-Bag (OOB) error of 18.41% obtained from training sample aggregation of 1500 trees in the LHS panel while the predicted traffic structures are in the RHS panel.
Figure 3: Optimal results of random forests obtained after multiple runs yielded a 18.41% OOB error
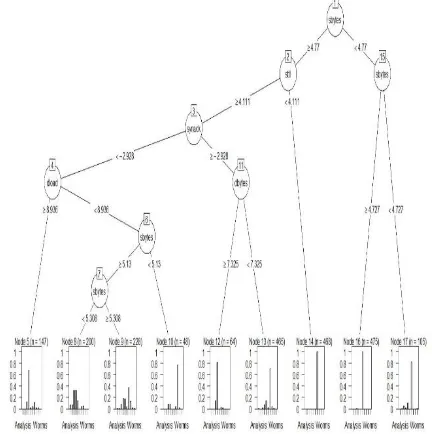
As noted above, we circumvent the shortcomings of random forests by applying the algorithm in Section 3.2.2. One of its key outputs is the tree partitioning in Figure 4 with its overall results showing that the importance of the splitting variables is in the order sbytes (20), smean (11), dload (11), rate (11), sload (8), dur7, sttl (6), dbytes (6), dmean (5), dpkts (4), dloss (4), synack (3), tcprtt (3), sjit (2), ackdat (2), dinpkt (2), sloss (1), swin (1) and djit (1). Note that the order of the attack types (bottom bar charts) of Figure 4 is the same as in Figure 3.
Figure 4: Individual random trees showing the main tree splitting variables and proportions at nodes
The binary response version of the tree is shown in Figure 5 the overall results of which order the importance of variables as follows: sttl (14), dload (12), dbytes (7), dpkts, dloss, tcprtt, dmean, smean, dinpkt and synack (6), sjit, djit and
Page
5
of
7
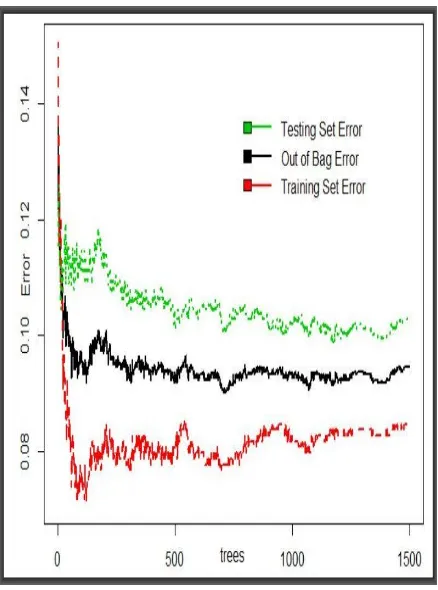
Figure 5: The binary target version of the tree modelSystem administrators will typically be interested in identifying the specific nature of the attacks and while this knowledge may help them develop specialist deterrents, the dynamic behaviour of attacks can add an extra burden on them - both technically and financially. For example, the nine different attack types identified in this paper are likely to be highly dynamic and so it is reasonable to expect some attacks evolving into other previously unknown variants or two or more merging. A better option is probably being able to generalise – i.e., isolating normal from malicious data flow. Below is a comparative performance based on specific and general target variables. Figure 6 exhibits error plots based on the binary variable “label” with an OOB of just over 6% compare this to the 18.41% for the multi-level target above.
Figure 6: Multiple DT models on the binary variable
[image:6.595.49.267.38.251.2]While it is technically obvious to see why the binary target yields more accurate results than the multi-level target variable, it is imperative to focus on the analytical impact of randomness in the intrusion types as implied in Table 1. One way of achieving that goal is to focus on the variability of the model results which is what this paper sought to achieve.
Table 2: Performance of the algorithm on binary target data
Various model variability outputs can be captured for comparative purposes. For DT models, for instance, these may include the key parameters in Table 2 - the complexity parameter, number of splits and variation of validation. We can assess the predictive performance of the model by looking at the root node error in conjunction with the values in this table. The relative error is equivalent to 1 − R2 and it
[image:6.595.323.551.442.559.2]Page
6
of
7
validation errors are obtained by multiplying RE and CVE by the XSTD respectively.
5 Concluding Remarks
The random nature of analytical studies is the reason behind many comparative analyses-based classifier design, datasets used and other experimental setups. We presented an iterative algorithm that is trained and tested on multiple random datasets with the ultimate objectives being to identify key predictors of intrusion and predict likelihoods of future attacks. It is an ensemble of derivative data mining techniques embedded with data adaptation capabilities for intrusion detection. Its main idea is to combine existing domain knowledge and automated learning techniques for intrusion detection which fits in nicely with the overall objective of data mining – extraction knowledge from data [15]. The two examples drawn from binary and multi-level target variable were motivated by the fact that frameworks for attaining the two objectives are based on pre-defined ontologies with inherently highly dynamic parameters. These parameters tend to randomise not only the training and testing datasets, but also the predictive power of the models [16]. The proposed algorithm can be applied with many learning algorithms and as we seek to achieve generalisation rules in isolating malicious from normal data flows, we expect that this work will pave the way for more model comparisons across applications.
References
[1]
Zargari, S. & Voorhis, D., “Feature Selection in the Corrected KDD
-
dataset,” in
Third
International Conference on Emerging Intelligent Data and Web Technologies, Bucharest, 2012.
[2] Moustafa, N. &
Slay, J., “UNSW
-NB15: A comprehensive data set for network intrusion
detection systems (UNSW-
NB15 network data set),” 2015.
[3] R. Wilcox, Fundamentals of Modern Statistical Methods: Substantially Improving Power and
Accuracy, New York: Springer, 2010, pp. 200-213.
[4] Breiman, L., Friedman, J. Stone, C. J. and Olshen, R. A., Classification and Regression Trees, New
York: Chapman and Hall, 1984.
[5]
L. Breiman, “Bagging Predictors,”
Machine Learning, vol. 24, no. 2, pp. 123-140, 1996.
Page
7
of
7
[7] García-Teodoro, P., Díaz-Verdejo, J., Maciá-
Fernández, G. & Vázquez, E., “Anomal
y-based
network intrusion detection: Techniques, systems and challenges.,”
Computers & Security, vol.
28, no. 6-7, p. 18
–
28., 2009.
[8]
Vigna, G. and Kemmerer, R., “NetSTAT: a network
-
based intrusion detection approach,” in
Proceedings 14th Annual Computer Security Applications Conference (Cat. No.98EX217),
Phoenix, Arizona, 1998.
[9] Mitchell, R. and Chen, I-
R., “Behavior Rule Specification
-Based Intrusion Detection for Safety
Critical Medical Cyber Physical Systems,”
IEEE Transactions on Dependable and Secure
Computing, vol. 12, no. 1, pp. 16-30, 2015.
[10]
L. Kaufman, “Can Public
-
Cloud Security Meet Its Unique Challenges?,”
IEEE Security & Privacy,
vol. 8, no. 4, pp. 55-57, 2010.
[11]
Moustafa, N. & Slay, J., “The
evaluation of Network Anomaly Detection Systems: Statistical
analysis of the UNSW-
NB15 data set and the comparison with the KDD99 data set,”
Moustafa,
Nour, and Jill Slay. "The evaluation of Network Anomaly Detection Systems: StatistiInformation
Security Journal: A Global Perspective, pp. 1-14, 2016.
[12] Webb, A., Statistical Pattern Recognition, Chichester, West Sussex: John Wiley & Sons, 2005.
[13]
Mwitondi, K., Moustafa, R. & Hadi, A., “A Data
-Driven Method for Selecting Optimal Models
Based on Gr
aphical Visualisation of Differences in Sequentially Fitted ROC Model Parameters,”
Data Science, vol. 12, pp. WDS247-WDS253, 2013.
[14]
Breiman, L., “Random Forests,”
Machine Learning, vol. 45, no. 1, pp. 5-32, 2001.
[15]
Wu, S. X. & Banzhaf, W., “Th
e use of computational intelligence in intrusion detection systems:
A review,”
Applied Soft Computing, vol. 10, no. 1, pp. 1-35, 2010.
[16] Mwitondi, K. &
Said, R., “A Data
-based Method for Harmonising Heterogeneous Data