ISSN Online: 2160-0422 ISSN Print: 2160-0414
DOI: 10.4236/acs.2018.82019 Apr. 30, 2018 286 Atmospheric and Climate Sciences
Circulation-Type Classification over Mexico by
the Era-Interim Database and Cost733
Sergio Natan González-Rocha
1,2, Juan Cervantes-Pérez
1, Fredy Juárez-Pérez
3,
Z. Arturo González-Cerezo
1, Lizeth Ríos Velasco
1, Inés Palomino-Méndez
1,
José María Baldasano Recio
2,41Universidad Veracruzana, Veracruz, Mexico 2Barcelona Supercomputing Center, Barcelona, Spain
3Instituto Tecnologico Superior de Alama Temapache, Xoyotitla, Mexico 4Universitat Politecnica de Catalunya, Barcelona, Spain
Abstract
In this paper an approach of a synoptic classification by cluster k-means (CKM) and the European Großwettertypes (GWT) was performed and ex-ecuted in COST733 package. The methodology used a CKM with nine clusters and GWT with 16. The COST733 evaluated a dataset of 30-years since 1986 to 2015. The variables selected were mean sea level pressure (mslp), geopotential height (z500 and z850), wind speed and direction (u10, v10 and u, v at 850 hPa) and relative vorticity (vo) with a 0.75˚ × 0.75˚ resolution of the data grid at 00:00, 06:00, 12:00 and 18:00 UTC and 0 steps. These results were evaluated using COST733 to find the quality of measurements by the explained variance (EV) or reduction ratio in error and pseudo F value (PF) to determine the certainty of the results. GWT-16 showed better yearly values in the evaluation with 32.7 (EV) and 354.3 (PF) against the CKM-9 of 54.2 (EV) and 1621.8 (PF). Finally, it was concluded that GWT-16 could be used for classification of synoptic systems over Mexico and the analysis of meteorological phenomena triggers on increases or decreases of atmospheric pollution in areas over Mex-ico.
Keywords
Cluster k-Mean, Synoptic Patterns, European Großwettertypes
1. Introduction
Classification of meteorological systems has its history in climatology and mete-orology. It began with manual classifications in regions on the globe, these
clas-How to cite this paper: González-Rocha, S.N., Cervantes-Pérez, J., Juárez-Pérez, F., González-Cerezo, Z.A., Velasco, L.R., Palomino-Méndez, I. and Recio, J.M.B. (2018) Circulation-Type Classification over Mex-ico by the Era-Interim Database and Cost733. Atmospheric and Climate Sciences, 8, 286- 305.
https://doi.org/10.4236/acs.2018.82019
Received: February 18, 2018 Accepted: April 27, 2018 Published: April 30, 2018
Copyright © 2018 by authors and Scientific Research Publishing Inc. This work is licensed under the Creative Commons Attribution International License (CC BY 4.0).
http://creativecommons.org/licenses/by/4.0/
DOI: 10.4236/acs.2018.82019 287 Atmospheric and Climate Sciences
sifications are called “Catalogs of Synoptic Types” and their use was restricted in meteorological forecast and climatic variability studies. Advances in computer technology increased the use of this type of tool due to the quick processing of large amounts of information [1]. Catalogs and tools have increased due to technology used in climate sciences, meteorology and environment. Global level studies have been carried out with these catalogs of synoptic meteorological pat-terns and they have been applied over Europe, North America and the Carib-bean.
As mentioned previously, the increase in several fields of research allowed the development of the European project “Harmonization and Applications of Weather Classifications for European Regions-COST733” in which a wide cata-log of these methodocata-logies were developed for specific regions of Europe [2] [3]. Also, researches on climate, air quality, and forest fires among other disciplines used these methodologies [4] [5] [6] [7] [8].
Pares et al. [9] reviewed, e.g. circulation patterns on the Gulf of California by using satellite data (NSCAT and Quickscat) and they found a south-east wind direction and wind intensity mainly in winter season. They also found an im-portant east-west gradient in wind magnitude over the penninsula side unlike those on the continental side. Douglas et al. [10] analyzed the monsoon of sou-theastern North America and they concluded that the “Sierra Madre Occidental” in Mexico promotes both, the mesoscale convective phenomena and the con-vergence center of humid air masses with origin in Mexican tropics and the Ca-ribbean. Also, they explain how the monsoon circulation over northeastern Mexico brings more humidity in the Pacific than the Atlantic.
Chadde and Clark [11] performed a classification of circulation patterns on the Caribbean through the analysis of datasets of Reanalysis NCEP/DOE at 850 hPa between 1979 and 2010-year. They used the cluster technique with k-mean algorithm. They found seven atmospheric patterns in which, one-third, presents an anticyclonic pattern with 2 or 3 days half-life that rarely occurs between July and September. At the same time, they found a decrease in frequency of tran-sient anticyclones over the Gulf of Mexico oppose to the increase in frequency of south-east wind patterns over the Caribbean. Cortez and Matsumoto [12] re-viewed the circulation over Mexico and its effects on intra-seasonal changes. They analyzed mean values for five days of wind fields, temperature and geopo-tential heights with data extracted from the ECMWF.
Jauregui [13] in “Variations of long period of the types of time of surface in Mexico” and Mosiño [14] represented patterns of 47 years from 1919 to 1966 over the Mexican Republic. Jauregui found variations in polar patterns, similar to zonal index observations of streams of west winds in the North Atlantic, con-firming thus, conclusions of Bradbury [15] that mentioned the high index scene-ries in North America and the incidence of anticyclones in low latitudes during winter.
DOI: 10.4236/acs.2018.82019 288 Atmospheric and Climate Sciences
atmospheric circulation to be used in air quality researches over Mexico. This was carried out through the analysis of 30-years ERA-Interim daily datasets from 1986-2015, the cluster k-means (CKM) methodology and the European Großwettertypes (GWT) classification of the catalog of classifications of COST733 project.
The paper is structured as follows: Introduction, section two which describes the methodology and materials, section three show the results obtained and dis-cussions and in the last sections the conclusions, acknowledgments and refer-ences.
2. Methodology and Materials
2.1. Domain and Data
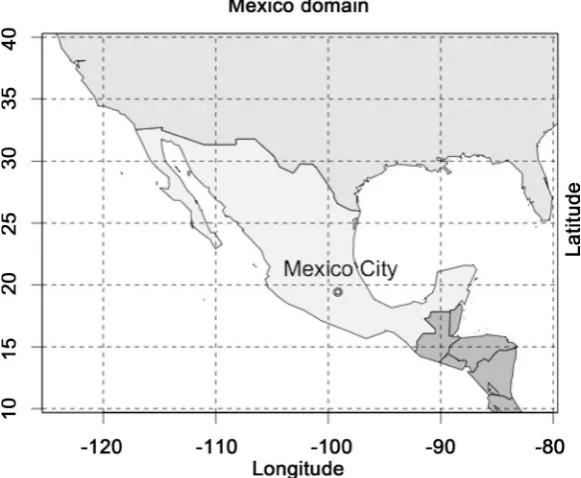
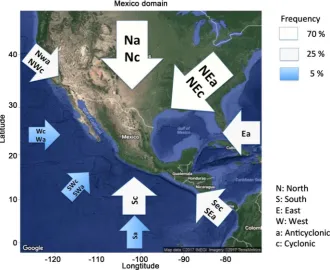
The research area extends from longitudes in the Eastern Pacific (−125˚W) to the Gulf of Mexico and the Caribbean (−80˚W) and latitudes from 40˚N to 10˚N (Figure 1). The domain was chosen to analyze and to corroborate patterns in the Intertropical Convergence zone (ITCZ) from the North Pacific Highs, north winds, easterlies, southerlies and low jet streams that converge and influence over Mexico. The domain of the area is represented in Figure 1.
2.2. Era Interim Data Base
The datasets used were downloaded from the European Center For Me-dium-Range Weather Forecasts (ECMWF). ERA-Interim daily reanalysis data
[16] available at
[image:3.595.228.519.452.691.2]http://apps.ecmwf.int/datasets/data/interim-full-daily/levtype=sfc/, datasets in
Figure 1. Mexico domain, Latitude 40˚N to 10˚N, Longitude −120˚W to −80˚W, source
DOI: 10.4236/acs.2018.82019 289 Atmospheric and Climate Sciences
netcdf format for a period of 30 years from 1986 to 2015. The variables selected were mean sea level pressure (mslp), geopotential height (z500 and z850), wind speed and direction (u10, v10 and u, v at 850 hPa) and relative vorticity (vo) with a 0.75˚ × 0.75˚ resolution of the data grid at 00:00, 06:00, 12:00 and 18:00 UTC and 0 steps.
2.3. Cost733class and Classification Methodologies
Cost733class (COST733) is an open source software package developed by
Phil-lip et al. [17] to evaluate the correspondence between different classifications of
atmospheric circulation through a catalog of 33 methods for 12 European coun-tries available at http://cost733.geo.uni-augsburg.de. It was decided to use the COST733 package for its ease of use and computing capacity that allows us to analyze patterns, correlations and frequency in time series.
The methodology for the analysis and selection of the models that allowed finding the classification was adapted from Valverde et al. [18]. Started with the selection and download of datasets with the variables selected and according to the model used. The variables evaluated were mslp, meters above sea level (masl), geopotential height of 500 and 850 (z500 and z850), wind direction and wind speed of 10 meters (u10, v10).
COST733 primarily considered its use in Europe by predefined methodologies based on Eigenvectors, leader algorithm, random classifications and cluster op-timization algorithms incorporated in its calculation method. The methods se-lected for the analysis in Mexico considered only two classifications, the CKM with nine clusters and the GWT with sixteen patterns, these clusters were consi-dered for a comparison with classification of the meteorological committee at the state of Veracruz in Mexico.
The synoptic patterns, atmospheric circulation classifications, predominant annual and monthly cyclonic and anticyclonic patterns were evaluated to find out the effects on atmospheric pollution and its transport over México.
The result of these patterns were compared with classification proposed by the meteorological committee at the state of Veracruz in Mexico that classifies me-teorological phenomena in Mexico and their effects over the state.
(http://proteccioncivil.gob.mx/work/models/ProteccionCivil/Resource/2285/1/i mages/programaveracruz.pdf).
2.4. CKM, Cluster K-Means Analysis
DOI: 10.4236/acs.2018.82019 290 Atmospheric and Climate Sciences
differences are calculated by Equation (1).
2 1
1 n
i i
RMSD R
n =
=
∑
(1)where Ri is the difference between the centroids of the class evaluated on the day
of analysis and N is the number of grid points. In case of using more than one atmospheric variable, normalization must be carried out to maintain compara-bility and maintain the additive nature of the distances [20]. This repetitive process classifies and re-calculates the centroids of the remaining days, as a con-sequence of the algorithm, the distances between the classes of centroids de-crease, while on the other hand, the variability of each class increases. Finally, the classifications are obtained according to the number of clusters chosen as a consequence of the algorithm executed by COST733.
2.5. GWT, Prototype for Large-Scale Circulation Types
The GWT method makes use of three prototype patterns and calculates three Pearson correlations between each field on the data set and the prototypes [21]. The prototypes used are a zonal pattern with values that increase from north to south. The second is a strict southern pattern with values that increase from west to east and the third prototype is a cyclonic pattern with a minimum in the cen-ter and incremental values outside the field. Depending on the three correlations and combinations of each input field the corresponding classification is given. This method uses only pressure fields and possible combinations are 8, 10, 11, 16, 18, 19, 24, 26 and 27.
Eight types of wind sectors are patterns N, NE, E, SE, S, SW, W and NW. If ten combinations are chosen then two pure pattern types are aggregates to the previous patterns, one cyclonic and another anticyclonic. In this work to find the patterns of both, the wind field sector and cyclonic and anticyclonic patterns, the GWT16 classification was chosen to find out the patterns, 1 to 8 are cyclonic (Nc, NEc, Ec, SEc, Sc, SWc, Wc, NWc ) and from 9 to 16 are anticyclonic (Na, NEa, Ea, SEa, Sa, SWa, Wa and NWa).
2.6. COST733 Classification Assessment
Patterns found in selected classifications were evaluated using COST733 to find the quality of measurements by the explained variance (EV) or reduction ratio in error and pseudo F value (PF) to determine the certainty of the results. These statistical metrics characterize classifications in terms of class separability and variability within classes [3].
COST733 allows to find EVPF considering for EV the Equation (2) that cal-culates based on the ratio of the sum of squares within the classes or circulation types (WSS) and the total sum of squares (TSS).
1 WSS
EV
TSS
DOI: 10.4236/acs.2018.82019 291 Atmospheric and Climate Sciences
calculated as the division between the sum of the squares between classes (BSS) and the sum of the squares within the classes (WSS) considering the number of cases (n) and classes (k), as shown in Equation (3).
(
)
(
)
1
BSS k PF
WSS n k
− =
− (3)
2.7. Comparison of Found Classifications
The comparison of classifications will determine the similarity between the set of observations used and calculated by COST733 with the Catalog comparison rou-tine (CPART). This rourou-tine calculates the Rand Index, ARI, Jaccard Index (JI), Mutual Information (MI), Standardized Mutual Information (NMI) according to Rand [23], Southwood [24], Hubert and Arabie [25], Milligan and Cooper
[26], Kalkstein et al. [27], Strehl and Gosh [28] and Kuncheva and Hadjitodorov
[29].
In this paper the Rand Index (RI) was used to indicate the best comparison values between two classifications that may or may not have the same number of clusters. The index values range from 0 to 1, where high RI values indicate that clusters compared are similar in both classifications.
3. Results and Discussions
According to methodology described in the previous chapter, both classification groups were found using COST733 software, the findings are described below.
3.1. Classification Cluster Analysis K-Means CKM
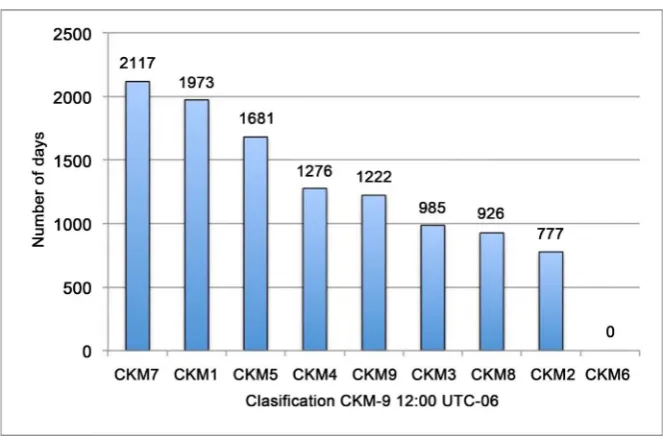
[image:6.595.208.540.477.697.2]As it can be seen in Figure 2, the clusters found correspond to eight categories, where the highest frequencies were CKM7, CKM1, CKM5, CKM4, CKM9,
Figure 2. CKM-9 cluster found and their frequency in days, source ERA interim dataset
DOI: 10.4236/acs.2018.82019 292 Atmospheric and Climate Sciences
CKM3, CKM8 and CKM2. Zero days in the CKM6, most likely because there is no comparison in the algorithm used by COST7333, which would cover the sta-tistical requirements of the correlations used.
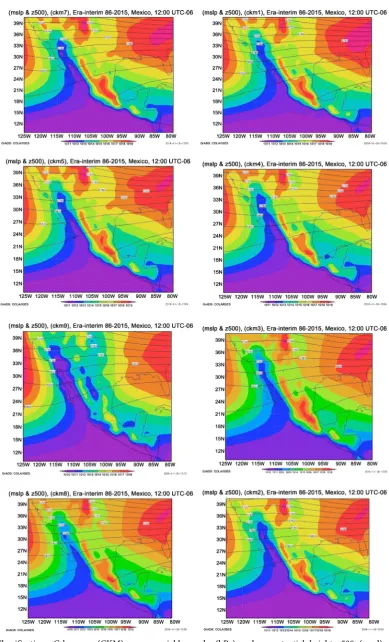
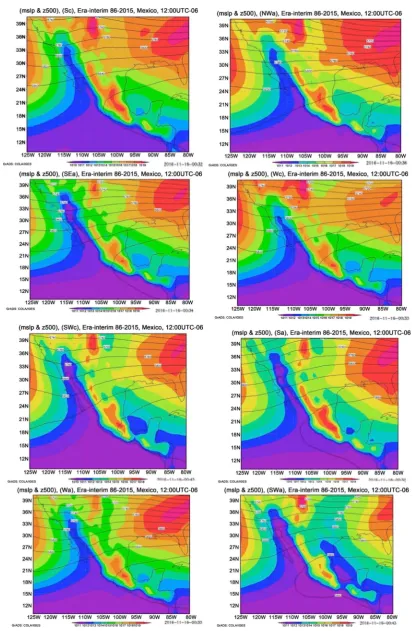
In addition, the analysis carried out of mslp variable and variable z500 (masl) returned for each cluster the analysis of circulation patterns in the period ana-lyzed (Figure 3).
CKM7, CKM1, CKM5 and CKM4 classifications show high-pressure systems in order of 1014 to 1019 hPa in the N, NE and NW areas of Mexico that come from the southern United States of America (E.E.U.U.), Pacific and Atlantic Ocean. Low-pressure systems of the order of 1011 to 1013 hPa predominantly from the S, SW and SE areas from the Pacific Ocean and little incidence in the Caribbean Sea were found in the Pacific and Caribbean areas on the Pacific coast in Mexico. The observed systems create in central Mexico high-pressure systems with values between 1014 and 1019 hPa in the Gulf of Mexico, in the Caribbean zone range from 1013 to 1016 hPa, and in the Pacific zone on the latitudes of “Baja California Sur” low-pressure systems between 1011 and 1013 hPa.
The CKM9 classification presented a slightly different system, since two sys-tems of high-pressures predominate from 1014 to 1018 HPa, one NW that comes from the North Pacific, near the state of North Baja California and the second one that comes from south zone at east of the E.E.U.U. and the Atlantic Ocean that accedes towards the Gulf of Mexico into NE of Mexico. The low-pressure pattern of the Pacific Ocean in southern Mexico extends to the Sea of Cortes and the state of Sonora with pressures in a range from 1010 to 1012 hPa. These three systems have a different impact on the systems within the Mexican Republic, observing in the central zone of Mexico high pressure sys-tems between 1014 and 1017 hPa, in the coasts of the south west of Mexico, sea of Cortes, South Baja California And Sonora, low-pressure systems from 1010 to 1012. On coasts of the Gulf of Mexico there are predominantly 1011 hPa pres-sures on the states of Tabasco, southern Veracruz and Campeche and from 1012 to 1014 in coasts of Tamaulipas and Veracruz states.
DOI: 10.4236/acs.2018.82019 293 Atmospheric and Climate Sciences
Figure 3. Classifications C-k mean (CKM) maps, variables mslp (hPa) and geopotential height z500 (masl), Era interim
DOI: 10.4236/acs.2018.82019 294 Atmospheric and Climate Sciences
from southern E.E.U.U. and move to Mexico and Central America.
3.2. GWT Classifications
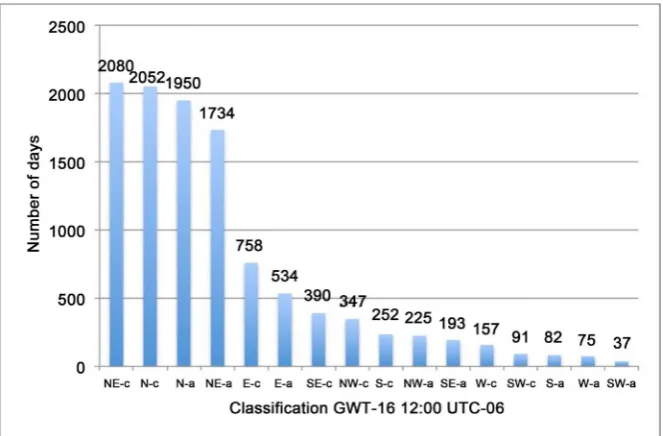
The analysis with COST7333 through the GWT model at 16 clusters resulted in N, NE, E, SE, S, SW, W and NW patterns with their respective cyclone (c) or an-ticyclone (a). Figure 4 shows the results of this model classified from highest to lowest frequency. It can be observed in Figure 4 that predominant patterns were the systems from north (NEc, Nc, Na, NEa), followed by the east and southeast patterns (Ec, Ea and SEc) and less frequent systems like NWc, Sc, NWa, SEa, Wc, SWc, Sa, Wa and SWa.
Figure 5 shows maps generated of 16 cyclonic (c) and anticyclonic (a) classi-fications. In the NEc, Nc, Na and NEa classifications, there are predominant high-pressure systems that affect the northern area of Mexico and it come from south and south east of the E.E.U.U. and the Pacific Northwest Ocean, these systems located in the N, NE and NW of Mexico show mslp values between 1014 and 1020 hPa. The second predominant systems were observed at south, south west of Mexico and the Caribbean zone, which show mslp values from 1011 to 1013 hPa in the Pacific Ocean and Sea of Cortes, and in the Caribbean from 1011 to 1014 hPa. The Gulf of Mexico coasts are affected by the first mentioned sys-tems promoting mslp values between 1013 and 1016 hPa. In Mexican territory, derived from the systems described above, it is shown in its central and high area of Chiapas, high-pressure systems from 1019 to 1014 hPa.
[image:9.595.209.541.472.690.2]Ec and Ea classifications systems from south and south east of the E.E.U.U. and the Pacific Ocean in the north of Mexico were observed and described in previous paragraphs with mslp values from 1014 to 1020 hPa. Downward va-riants of systems incoming from the south and south west of Mexico show
Figure 4. GWT-16 clusters found and their frequency in days, source ERA interim
DOI: 10.4236/acs.2018.82019 296 Atmospheric and Climate Sciences
Figure 5. GWT-16 classifications maps, variables mslp (hPa) and geopotential height z500 (masl), Era interim 1986 - 2015,
DOI: 10.4236/acs.2018.82019 297 Atmospheric and Climate Sciences
values range from 1010 to 1013 hPa in the Pacific Ocean and sea of Cortes. In the Caribbean and Gulf of Mexico areas, mslp values range in order of 1012 to 1015 hPa. In a similar way, high-pressure systems were promoted mainly in cen-tral and high plateaus of Chiapas in Mexico with values from 1015 to 1020 hPa.
The SEc classification again shows similar systems from south and south east of E.E.U.U. and the Pacific Ocean to the north of Mexico with values from 1015 to 1020 hPa. In the south, southwest and in the sea of Cortes there were low-pressure systems with values from 1010 to 1013 hPa. The Mexican Carib-bean area had values between 1012 and 1015 hPa. The Gulf of Mexico presented high-pressure systems from 1013 to 1016 hPa. These systems promote high-pressure mainly in the central and high plateaus of Chiapas in Mexico with mslp values from 1015 to 1019 hPa.
The NWc classification shows changes in systems from south, southeast of E.E.U.U. and from the Pacific Ocean at the north of Mexico, and mslp values from 1016 to 1019 hPa were observed. In south, southwest and the sea of Cortes low-pressures systems were observed with values from 1010 to 1014 hPa. The Mexican Caribbean zone show values between 1012 to 1014 hPa and in the Gulf of Mexico high-pressure systems were from 1013 to 1017 hPa. Once more in the continental part of Mexico, the synoptic systems promote high-pressure mainly in central and high plateaus of Chiapas in Mexico with values ranging from 1016 to 1021 hPa.
The Sc classification presented high-pressure systems from the south and southeast of E.E.U.U. with pressure values of 1014 to 1020 hPa, and values of 1014 to 1018 hPa from the Pacific to the north of Mexico. In the south, south-west and the sea of Cortes in Mexico, there were low-pressure predominant sys-tems ranging from 1010 to 1013 hPa. In the area of the Mexican Caribbean and over the coasts of the Gulf of Mexico the systems ranged from 1013 to 1016 hPa. The systems mentioned above promote in the central and high areas of Chiapas, high-pressure values from 1015 to 1020 hPa.
The NWa system show mslp values ranging from 1015 to 1020 hPa and came from south and south east of the E.E.U.U. and the Pacific Ocean to the north of Mexico. In the south, southwest and in the sea of Cortes the systems are of low pressures with values from 1010 to 1013 hPa. In the southeast in the Mexican Caribbean and to the east in the Gulf of Mexico, systems tending to high-pressure were observed with values of 1013 to 1015 hPa. These systems promote high pressure mainly in the central and high plateaus of Chiapas in Mexico with values ranging from 1015 to 1020 hPa.
DOI: 10.4236/acs.2018.82019 298 Atmospheric and Climate Sciences
and the Mexican Caribbean Sea the pressure values of 1013 to 1016 hPa affect both littoral. In this classification, the synoptic systems promote high pressure values in central and high areas of Chiapas in Mexican territory with 1014 to 1019 hPa and over the south of Veracruz, Tabasco, and Oaxaca states, mslp val-ues from 1013 to 1014 hPa.
The Wc classification show a high pressure system in the northwest of Mexico from the Pacific Ocean with values of 1014 to 1021 hPa that affects Baja Califor-nia North and Baja CaliforCalifor-nia South. Coming from the south and south-east of the E.E.U.U. high-pressure systems from 1016 to 1021 hPa affecting northern Mexico were observed. Low-pressure systems with values of 1010 to 1013 hPa were observed from the south, southwestern Mexico and sea of Cortes. In the Gulf of Mexico and Mexican Caribbean Sea were observed mslp values range from 1013 to 1016 hPa. These systems promote in Mexico, high-pressure sys-tems in the high plateau of the Central Highlands, the Western Sierra and the highlands of Chiapas with values from 1014 to 1020 hPa. In Tehuantepec´s isthmus between the Gulf of Mexico and Oaxaca, the system shows differences in pressure from 1013 and 1014 hPa.
The SWc classification affects the Mexican territory with high-pressure values of 1014 to 1020 hPa incoming from the south and southeast of E.E.U.U. In the northwestern part of Mexico over the Pacific Ocean the system show values from 1013 to 1020 hPa. In south, southwest and over the sea of Cortes the sys-tem show values from 1010 to 1012 hPa. In the Gulf of Mexico and Mexican Ca-ribbean the system went from 1011 to 1014 hPa. These systems promote high-pressure values ranging from 1014 to 1019 hPa in the highlands of Chiapas, central highlands of Mexico and Sierra Madre Occidental. Over the highlands of Chiapas mslp values went from 1014 to 1015 hPa, and a low-pressure system went from the south of Veracruz, Tabasco and Oaxaca states with values of 1012 to 1013 hPa.
The Sa classification show high-pressure systems from south and southeast of the E.E.U.U. with values of 1014 to 1020 hPa coming from the Pacific Ocean in northwestern Mexico, these system show values of 1013 tending to high-pressure with a maximum of 1018 hPa. In south, southwest of Mexico and sea of Cortes the low-pressure predominant systems show values from 1010 to 1013 hPa. High-pressure systems were observed in areas of the Gulf of Mexico and Carib-bean Sea with values from 1013 to 1017 hPa. High pressure values from 1015 to 1020 hPa were promoted and observed in central Mexico, northern highlands, western highlands and highlands of Chiapas, in addition a low pressure system of 1012 to 1013 hPa was observed in the Gulf of Mexico shores in southern states of Veracruz and Tabasco.
DOI: 10.4236/acs.2018.82019 299 Atmospheric and Climate Sciences
southwest of Mexico and Sea of Cortes, the systems show low-pressure values of 1010 to 1013 hPa. The Gulf of Mexico and the Mexican Caribbean show low- pressure systems at high pressure of 1013 to 1017 hPa. In Mexican territory, high pressure values of 1014 to 1020 hPa were observed in central Mexico, northern highlands, western highlands and highlands of Chiapas. A high-pressure system was observed again with values from 1013 to 1014 hPa in the Gulf of Mexico in southern states of Veracruz, Tabasco and Campeche.
The SWa classification shows some important changes in systems from the south and southeast of E.E.U.U. with high-pressure values ranging from 1013 to 1019 hPa. The system incoming from the Pacific Ocean at northwest of Mexico on Baja California Peninsula show values between 1012 and 1019 hPa. In south, southwest of Mexico and Sea of Cortes, low-pressure systems change from 1010 to 1012 hPa. In the Gulf of Mexico and Mexican Caribbean the systems change significantly with values from 1011 to 1016 hPa. These systems promote high- pressure values from 1014 to 1019 hPa at central area of Mexico, the northern highlands, western highlands and highlands of Chiapas. On Gulf of Mexico shores over the states of Tamaulipas, Veracruz, Tabasco and Campeche, low-pressure values were observed from 1011 to 1013 and it was observed as it affects shores of Oaxaca at the zone of Tehuantepec´s Isthmus. In the Mexican Caribbean coast the values went from 1011 to 1014 hPa.
Values of z500 in all classifications were observed from 5700 to 5860 masl, where the lower altitude values were observed coming from southern E.E.U.U. and moving to Mexico and Central America.
3.3. EVPF Evaluation of Classifications
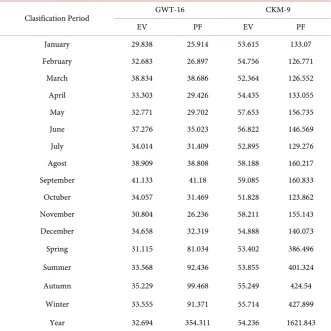
The evaluation module of COST733 gave us values corresponding to the ex-plained variance (EV) and pseudo-f (PF) in the GWT and CKM classifications in order to verify the quality on both models as shown in Table 1.
Table 1 shows mayor number of clusters in the analysis improves the certain-ty of results in each model, since on the one hand the GWT makes use of 16 ways to classify versus the nine clusters used in the CKM methodology. Consi-dering this aspect the GWT-16 classification gave better results when it is ap-plied in the Era-interim database in the period from 1986 to 2015.
3.4. CKM and GWT Comparatives
A test was performed by comparison between CKM-9 and GWT-16, obtaining the results shown in Table 2.
DOI: 10.4236/acs.2018.82019 300 Atmospheric and Climate Sciences
Table 1. Results of variance explained (EV) and pseudo-f (PF) values, applied to the
GWT-16 and CKM-9 classifications.
Clasification Period GWT-16 CKM-9
EV PF EV PF
January 29.838 25.914 53.615 133.07
February 32.683 26.897 54.756 126.771
March 38.834 38.686 52.364 126.552
April 33.303 29.426 54.435 133.055
May 32.771 29.702 57.653 156.735
June 37.276 35.023 56.822 146.569
July 34.014 31.409 52.895 129.276
Agost 38.909 38.808 58.188 160.217
September 41.133 41.18 59.085 160.833
Octuber 34.057 31.469 51.828 123.862
November 30.804 26.236 58.211 155.143
December 34.658 32.319 54.888 140.073
Spring 31.115 81.034 53.402 386.496
Summer 33.568 92.436 53.855 401.324
Autumn 35.229 99.468 55.249 424.54
Winter 33.555 91.371 55.714 427.899
Year 32.694 354.311 54.236 1621.843
Table 2. COST733: Results of comparison between CKM-9 versus GWT-16.
CKM-1 CKM-2 CKM-3 CKM-4 CKM-5 CKM-6 CKM-7 CKM-8 CKM-9 GWT-16 0.936 0.89 0.936 0.139 0.841 0.936 0.89 0.936 0.139
[image:15.595.207.537.466.500.2]DOI: 10.4236/acs.2018.82019 301 Atmospheric and Climate Sciences
Table 3. Frequency rates observed in the CKM-9 and GWT-16 classifications of
COST7333.
CKM Classification Percentage GWT Classification Percentage
CKM1 19 NEc 19
CKM7 18 Nc 19
CKM5 15 Na 16
CKM4 12 NEa 16
CKM9 11 Ec 7
CKM3 9 Ea 5
CKM8 8 SEc 4
CKM2 7 NWc 3
CKM6 0 Sc 2
NWa 2
SEa 2
Wc 1
SWc 1
Sa 1
Wa 1
SWa 1
Total 100 100
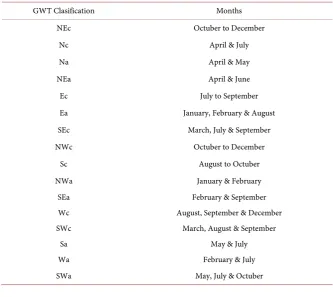
Table 4. More representative months of GWT-16 classification.
GWT Clasification Months
NEc Octuber to December
Nc April & July
Na April & May
NEa April & June
Ec July to September
Ea January, February & August
SEc March, July & September
NWc Octuber to December
Sc August to Octuber
NWa January & February
SEa February & September
Wc August, September & December
SWc March, August & September
Sa May & July
Wa February & July
[image:16.595.205.539.437.734.2]DOI: 10.4236/acs.2018.82019 302 Atmospheric and Climate Sciences
4. Conclusions
The analysis for the 30-year period since 1986 to 2015 from the ECMWF Era-interim Daily databases of mslp, z500 and surface wind fields at 12:00 UTC-06 made it possible to corroborate the patterns of Mosiño [14], Jauregui
[13], and these were analyzed by Philipp et al. [3] and Huth et al. [2] in COST733 software package, using the c-k mean (CKM-9) and European Großwettertypes (GWT-16) algorithms.
The resolution used in the Era-interim databases at 0.75˚ × 0.75˚ allowed a synoptic meteorological analysis to be carried out on Mexican territory, and the evaluation and classification by COST733 software package give us a great cor-respondence found by other authors who used another type of methodology e.g. Enke et al. [19] [20] and Kalkstein et al. [27].
For CMK-9 classification, it was found eight clusters that represent patterns on the Mexican domain through the analysis of mslp. These patterns fit with synoptic patterns mentioned by authors such as Bradbury [15], Mosiño [14], Jauregui [13] and Douglas et al. [10]. However, we found only eight significant patterns in the data set analyzed, which were ordered in day frequencies from highest to lowest: CKM7, CKM1, CKM5, CKM4, CKM9, CKM3, CKM8, CKM2 and the CKM6 which value was zero. When representing these systems with GRADS software, it was found that patterns had minor differences and variances between clusters found. This was confirmed later by the EVPF evaluation that shows high EV and PF values between both CKM-9 and GWT-16 classifications.
The GWT-16 classification allows finding predominant systems, cyclonic and anticyclonic types. The predominant patterns were north related such as NEc, Nc, Na, NEa, followed by east and southeast patterns Ec, Ea and Sec, and the less frequent systems were NWc, Sc, NWa, SEa, Wc, SWc, Sa, Wa and SWa. Also, It was found that the NEc, Nc, Na and NEa patterns grouped 70% of the analyzed data frequency. Ea, SEc, NWc, Sc, NWa and SEa groups 25% and Wc, SWc, Sa, Wa and SWa group the remaining 5%. The systems found by the GWT-16 were grouped according to the origin wind direction as show in Figure 6. The type of system found fits much better to the main goal of the paper, corroborating the patterns described previously by authors like Mosiño [14] and Jauregui [13]. It can be concluded that GWT-16 showed better values of EV and PF in the evalu-ation versus the CKM-9.
Regarding values observed in GWT-16 and CKM-9 classifications, it can be observed synoptic behaviors promoting low-jet streams systems in to the North of Mexico, ITCZ on Mexican Pacific coasts, monsoon systems in the Peninsula of Baja California, winds over Isthmus of Tehuantepec, and north, east and south winds patterns that affect Mexico.
DOI: 10.4236/acs.2018.82019 303 Atmospheric and Climate Sciences
Figure 6. Synoptic patterns identified over Mexico according GWT-16 classification.
Cortes, low-pressure systems were observed between 1010 and 1013 hPa. Thus, the COST733 software package and the GWT-16 could be used as a proposal of classification of the synoptic systems over Mexico.
Finally, it can be concluded that GWT-16 can be used for analysis of meteo-rological phenomena triggers on increases or decreases of atmospheric pollution in areas over Mexico.
Acknowledgements
First author thanks the CONACyT and the BSC by the support of their postdoc-toral research and also for the space to execute the simulations in the Mare No-strum III supercomputer. Also thanks to Universidad Veracruzana for the sup-port in this postdoctoral stay at BSC.
References
[1] Ramos, A.M., Barriopedro, D. and Dutra, E. (2015) Circulation Weather Types as a Tool in Atmospheric, Climate, and Environmental Research. Frontiers in Environ-mental Science, 3, 44. https://doi.org/10.3389/fenvs.2015.00044
[2] Huth, R., Beck, C., Philipp, A., Demuzere, M., Ustrnul, Z., Cahynová, M., Kyselý, J. and Tveito, O.E. (2008) Classifications of Atmospheric Circulation Patterns: Recent Advances and Applications. Annals of the New York Academy of Sciences, 1146, 105-152.https://doi.org/10.1196/annals.1446.019
Tym-DOI: 10.4236/acs.2018.82019 304 Atmospheric and Climate Sciences
vios, F.S. (2010) Cost733cat—A Database of Weather and Circulation Type Classi-fications. Physics and Chemistry of the Earth, 35, 360-373.
https://doi.org/10.1016/j.pce.2009.12.010
[4] Kysely, J. and Domonkos, P. (2006) Recent Increase in Persistence of Atmospheric Circulation over Europe: Comparison with Long-Term Variations since 1881. In-ternational Journal of Climatology, 26, 461-483. https://doi.org/10.1002/joc.1265
[5] Demuzere, M., Trigo, R.M., Vila-Guerau de Arellano, J. and Van Lipzig, N.P.M. (2009) The Impact of Weather and Atmospheric Circulation on O3 and PM10 Le-vels at a Rural Mid-Latitude Site. Atmospheric Chemistry and Physics, 9, 2695-2714.
http://www.atmos-chem-phys.net/9/2695/2009/
https://doi.org/10.5194/acp-9-2695-2009
[6] Kasomenos, P. (2010) Synoptic Circulation Control on Wild Fire Occurrence.
Physics and Chemistry of the Earth, 35, 544-552.
https://doi.org/10.1016/j.pce.2009.11.008
[7] Lorenzo, M.N., Ramos, A.M., Taboada, J.J. and Gimeno, L. (2011) Changes in Present and Future Circulation Types Frequency in Northwest Iberian Peninsula.
PLoS ONE, 6, el6201. https://doi.org/10.1371/journal.pone.0016201
[8] Zheng, M., Chang, E.K., Colle, B.A., Luo, Y. and Zhu, Y. (2017) Applying Fuzzy Clustering to a Multimodel Ensemble for US East Coast Winter Storms: Scenario Identification and Forecast Verification. Weather and Forecasting, 32, 881-903.
https://doi.org/10.1175/WAF-D-16-0112.1
[9] Pares-Sierra, A., Mascarenhas, A., Marinone, S.G. and Castro, R. (2003) Temporal and Spatial Variation of the Surface Winds in the Gulf of California. Geophysical Research Letters, 20, 1312. https://doi.org/10.1029/2002GL016716
[10] Douglas, M.W., Maddox, R.A., Howard, K. and Reyes, S. (1993) The Mexican Monsoon. Journal of Climate, 6, 1665-1677.
https://doi.org/10.1175/1520-0442(1993)006<1665:TMM>2.0.CO;2
[11] Chadee, X.T. and Clarke, R.M. (2015) Daily Near-Surface Large-Scale Atmospheric Circulation Patterns over the Wider Caribbean. Climate Dynamics, 44, 2927.
https://doi.org/10.1007/s00382-015-2621-2
[12] Cortez, M. and Matsumoto (2001) Cambios intraestacionales en la circulación regional sobre México. Investigaciones geográficas, 46, 30-44.
http://www.scielo.org.mx/scielo.php?script=sci_arttext&pid=S0188-4611200100030 0004&lng=es&tlng=es
[13] Jáuregui, O.E. (1979) Variaciones de largo periodo de los tipos de tiempo de superficie en México. Boletín del Instituto de Geografía, 4, 9-22.
[14] Mosiño, A.P. (1958) Una clasificación de las configuraciones de flujo aéreo sobre la República Mexicana. Journal Ingeniería Hidráulica en México, 12, 29-54.
[15] Bradbury, D. (1958) On the Behaviour Pattern of Cyclones and Anticyclones as Re-lated to Zonal Index. Bulletin American Meteorology Society, 39.
[16] Dee, D.P., Uppala, S.M., Simmons, A.J., Berrisford, P., Poli, P., Kobayashi, S., An-drae, U., Balmaseda, M.A., Balsamo, G., Bauer, P., Bechtold, P., Beljaars, A.C.M., Van de Berg, L., Bidlot, J., Bormann, N., Delsol, C., Dragani, R., Fuentes, M., Geer, A.J., Haimberger, L., Healy, S.B., Hersbach, H., Hólm, E.V., Isaksen, L., Kållberg, P., Köhler, M., Matricardi, M., McNally, A.P., Monge-Sanz, B.M., Morcrette, J.-J., Park, B.-K., Peubey, C., De Rosnay, P., Tavolato, C., Thépaut, J.-N. and Vitart, F. (2011) The ERA-Interim Reanalysis: Configuration and Performance of the Data Assimila-tion System. Quarterly Journal of the Royal Meteorological Society, 137, 553-597.
DOI: 10.4236/acs.2018.82019 305 Atmospheric and Climate Sciences
[17] Philipp, A., Beck, C., Huth, R. and Jacobeit, J. (2014) Development and Comparison of Circulation Type Classifications using the COST 733 Dataset and Software. In-ternational Journal of Climatology, 36, 2673-2691.
[18] Valverde, V., Pay, M.T. and Baldasano, J.M. (2015) Circulation-Type Classification Derived on a Climatic Basis to Study Air Quality Dynamics over the Iberian Penin-sula. International Journal of Climatology, 35, 2877-2897.
https://doi.org/10.1002/joc.4179
[19] Enke, W. and Spekat, A. (1997) Downscaling Climate Model Outputs into Local and Regional Weather Elements by Classification and Regression. Climate Re-search, 8, 195-207.https://doi.org/10.3354/cr008195
[20] Enke, W., Schneider, F. and Deutschländer, T. (2005) A Novel Scheme to Derive Optimized Circulation Pattern Classifications for Downscaling and Forecast Pur-poses. Theoretical and Applied Climatology, 82, 51-63.
https://doi.org/10.1007/s00704-004-0116-x
[21] Beck, C., Jacobeit, J. and Jones, P.D. (2007) Frequency and Within-Type Variations of Large-Scale Circulation Types and Their Effects on Low-Frequency Climate Va-riability in Central Europe since 1780. International Journal of Climatology, 27, 473-491. https://doi.org/10.1002/joc.1410
[22] Calinski, T. and Harabasz, J. (1974) A Dendrite Method for Cluster Analysis.
Communications in Statistics, 3, 1-27.
https://doi.org/10.1080/01621459.1971.10482356
[23] Rand, W.M. (1971) Objective Criteria for the Evaluation of Clustering Methods.
Journal of the American Statistical Association, 66, 846-850.
[24] Southwood, T.R.E. (1978) Ecological Methods. 2nd Edition, Chapman and Hall, London.
[25] Hubert, L. and Arabie, P. (1985) Comparing Partitions. Journal of Classification, 2, 193-218.https://doi.org/10.1007/BF01908075
[26] Milligan, G. and Cooper, M. (1985) An Examination of Procedures for Determining the Number of Clusters in a Data Set. Psychometrika, 50, 159-179.
https://doi.org/10.1007/BF02294245
[27] Kalkstein, L.S., Tan, G. and Skindlov, J.A. (1987) An Evaluation of Three Clustering Procedures for Use in Synoptic Climatological Classification. Journal of Applied Meteorology, 26, 717-730.
https://doi.org/10.1175/1520-0450(1987)026<0717:AEOTCP>2.0.CO;2
[28] Strehl, A. and Gosh, J. (2002) Cluster Ensembles—A Knowledge Reuse Framework for Combining Partitions. Journal of Machine Learning Research, 3, 583-617. [29] Kuncheva, L. and Hadjitodorov, S.T. (2004) Using Diversity in Cluster Ensembles.
IEEE International Conference on Systems, Man and Cybernetics, The Hague, 10-13 October 2004, Vol. 2, 1214-1219.