EFFECT OF Co DOPING ON STRUCTURAL AND OPTICAL
PREPARED BY CHEMICAL
*Nabeel A. Bakr, Ziad T. Khodair
Department of Physics, College of Science, University of Diyala, Diyala, Iraq
ARTICLE INFO ABSTRACT
In this work,
successfully deposited on glass substrates by chemical spray pyrolysis (CSP) technique at substrate temperature of (400 °C) and thickness of about 300 nm. The structural and op
films have been studied using XRD, AFM, and UV
that all films are polycrystalline in nature with Hexagonal structure and preferred orientation along (111),(002),(101),(102),(110) and (1
formula and it is found that the undoped
results showed homogenous and smooth thin films. The absorbance and transmittance spectra have been recorded in the wavelength range of (300
optical energy gap for allowed direct electronic transition was calculated using Tauc equation. It is found that the band gap increases as the Co concentrat
the range of 3.27
parts of dielectric constant) were also calculated as a function of photon energy. Refractive index and extinction coefficient for Zinc
Copyright © 2015 Nabeel A. Bakr et al.This is an open access article distributed under the Creative Commons Att use, distribution, and reproduction in any medium, provided the original work is properly cited.
INTRODUCTION
ZnO is a wide band gap (~3.37 eV) material that has potential applications in the fabrication of devices such as ultraviolet
(UV) light-emitters, varistors, transparent high
electronics, piezoelectric transducers, gas
windows and solar cells (Raidou et al., 2010
materials of the II–VI family of Semiconductors which have been studied extensively for many years
2008). Transparent conducting oxides (TCOs) thin films have been extensively studied because of their variety of applications keeping in view the need of low
are required in various fields of science and technology (Shinde et al., 2008). Transparent conducting ZnO thin films are emerging as the most attractive alternative to ITO and various other TCOs (Tsang et al., 2008)
interesting material for many different applications in both microelectronic and optoelectronic devices
2009). It is a wide-band gap oxide semiconductor with a direct
energy gap of about 3.37 eV (Wei Lin et al., 2007
optical transparency in the visible and
near-electromagnetic spectrum, and has a high refractive index (1.9).
*Corresponding author: Nabeel A. Bakr,
Department of Physics, College of Science, University of Diyala, Diyala, Iraq.
ISSN: 0975-833X
Vol.
Article History:
Received 08th December, 2014 Received in revised form 15th December, 2014 Accepted 27th January, 2015 Published online 26th February,2015
Key words:
ZnO thin films, Co Doping,
Chemical Spray Pyrolysis, Optical Properties, Structural Properties,
Atomic Force Microscope (AFM).
RESEARCH ARTICLE
DOPING ON STRUCTURAL AND OPTICAL PROPERTIES OF ZnO THIN FILMS
PREPARED BY CHEMICAL SPRAY PYROLYSIS METHOD
Nabeel A. Bakr, Ziad T. Khodair and Israa A. Alghalabi
Department of Physics, College of Science, University of Diyala, Diyala, Iraq
ABSTRACT
In this work, Zinc-cobalt oxide (Zn(1-x)CoxO) thin films, where x = 0, 4, 6 and 8 % have been
successfully deposited on glass substrates by chemical spray pyrolysis (CSP) technique at substrate temperature of (400 °C) and thickness of about 300 nm. The structural and op
films have been studied using XRD, AFM, and UV-Visible spectroscopy. The XRD results showed that all films are polycrystalline in nature with Hexagonal structure and preferred orientation along (111),(002),(101),(102),(110) and (103) planes. The crystallite size was calculated using Scherrer formula and it is found that the undoped ZnO sample has maximum crystallite size (
results showed homogenous and smooth thin films. The absorbance and transmittance spectra have een recorded in the wavelength range of (300- 900) nm in order to study the optical properties. The optical energy gap for allowed direct electronic transition was calculated using Tauc equation. It is found that the band gap increases as the Co concentration increases and the band gap values were in the range of 3.27-3.32 eV. The optical constants including (absorption coefficient, real and imaginary parts of dielectric constant) were also calculated as a function of photon energy. Refractive index and
inction coefficient for Zinc-Cobalt Oxide thin films were estimated as a function of wavelength.
is an open access article distributed under the Creative Commons Attribution License, which use, distribution, and reproduction in any medium, provided the original work is properly cited.
ZnO is a wide band gap (~3.37 eV) material that has potential applications in the fabrication of devices such as ultraviolet
emitters, varistors, transparent high-power
electronics, piezoelectric transducers, gas-sensors, smart ., 2010). It is one of the VI family of Semiconductors which have been studied extensively for many years (Vijayan et al., . Transparent conducting oxides (TCOs) thin films have been extensively studied because of their variety of applications keeping in view the need of low-cost TCOs that are required in various fields of science and technology ent conducting ZnO thin films are emerging as the most attractive alternative to ITO and ). ZnO is a very interesting material for many different applications in both microelectronic and optoelectronic devices (Ashour et al., band gap oxide semiconductor with a direct ., 2007), with high -infrared region of electromagnetic spectrum, and has a high refractive index
Department of Physics, College of Science, University of Diyala,
Due to these properties, ZnO is a promising material for solar cell applications, such as antireflection coatings
2008). ZnO thin films can also be used for gas sensing because of high sensitivity to many gases
Dilute magnetic semiconductors (DMS) produced by doping transition metal (TM) ions into non
have attracted a great deal of interest
Comparing with other TM (e.g., Fe, Ni, V, Cr, Mn) doped ZnO, the identical viewpoint is that the ZnCoO system is a promising material because of the high
excellent ferromagnetic near ro
et al., 2009). ZnO thin films have been deposited by several techniques such as sputtering (
pulsed laser (Ngoma et al., 2009 et al., 2006), and spray pyrolysis
Weon-Pil Tai, 2007). In contrast, the spray pyrolysis technique has been only rarely used although this process presents many advantages: (i) it is a low
technique, and (ii) it allows the possibilit with a large area (Belghazi et al
report the growth of Zn1-xCoxO thin films (x=0, 4, 6, 8) % on glass substrates by spray pyrolysis technique and the influence of cobalt doping on the structural and optical pr
ZnO thin films. Cobalt (Co) lies
the periodic table. The atomic number of Cobalt is 27 with anatomic mass of 58.933195 g/mol
sturdy, gray metal which resembles iron and Zinc.
Available online at http://www.journalcra.com
International Journal of Current Research
Vol. 7, Issue, 02, pp.12411-12417, February, 2015
INTERNATIONAL
z
PROPERTIES OF ZnO THIN FILMS
SPRAY PYROLYSIS METHOD
Alghalabi
Department of Physics, College of Science, University of Diyala, Diyala, Iraq
O) thin films, where x = 0, 4, 6 and 8 % have been successfully deposited on glass substrates by chemical spray pyrolysis (CSP) technique at substrate temperature of (400 °C) and thickness of about 300 nm. The structural and optical properties of these Visible spectroscopy. The XRD results showed that all films are polycrystalline in nature with Hexagonal structure and preferred orientation along 03) planes. The crystallite size was calculated using Scherrer’ ZnO sample has maximum crystallite size (23.11nm). AFM results showed homogenous and smooth thin films. The absorbance and transmittance spectra have 900) nm in order to study the optical properties. The optical energy gap for allowed direct electronic transition was calculated using Tauc equation. It is increases and the band gap values were in The optical constants including (absorption coefficient, real and imaginary parts of dielectric constant) were also calculated as a function of photon energy. Refractive index and
Cobalt Oxide thin films were estimated as a function of wavelength.
ribution License, which permits unrestricted
Due to these properties, ZnO is a promising material for solar cell applications, such as antireflection coatings (López et al., . ZnO thin films can also be used for gas sensing because of high sensitivity to many gases (Kaid and Ashour, 2007). Dilute magnetic semiconductors (DMS) produced by doping transition metal (TM) ions into non-magnetic semiconductors a great deal of interest (Fitzgerald et al., 2005). Comparing with other TM (e.g., Fe, Ni, V, Cr, Mn) doped ZnO, the identical viewpoint is that the ZnCoO system is a g material because of the high solubility and the excellent ferromagnetic near room temperature (Ling Wei
. ZnO thin films have been deposited by several (Jeng-Lin Chung et al., 2008), ., 2009), sole-gel (Yaodong Liu , and spray pyrolysis (Young-Sung Kim and
. In contrast, the spray pyrolysis technique has been only rarely used although this process presents many advantages: (i) it is a low-cost and simple technique, and (ii) it allows the possibility of obtaining films et al., 2009). In this work, we O thin films (x=0, 4, 6, 8) % on glass substrates by spray pyrolysis technique and the influence of cobalt doping on the structural and optical properties of ZnO thin films. Cobalt (Co) lies with the transition metals on the periodic table. The atomic number of Cobalt is 27 with anatomic mass of 58.933195 g/mol (Saleh, 2013). Cobalt is a sturdy, gray metal which resembles iron and Zinc.
MATERIALS AND METHODS
ZnO and CZO (Co doped ZnO) thin films were deposited
using the spray pyrolysis technique on glass substrates at temperature of (400 ºC). A homogeneous solution was prepared by dissolving zinc acetate (Zn(CH3COO)2.2H2O) and cobalt acetate Co(CH3COO)2.4H2O separately in distilled water at the concentration of 0.1 M. Final solutions were prepared by mixing the two initial solutions in appropriate volumetric proportions to get various concentrations of Co (0, 4, 6, 8) wt. %.The resultant solution was sprayed on glass substrates. The glass substrates were cleaned in acetone, rinsed in distilled water, and subsequently dried before deposition. The substrates are then placed on hot plate which was heated before progressively until the deposition temperature is reached. All films were deposited at 400 ˚C. Other deposition conditions such as spraynozzle to substrate distance (30 cm), spray time (10 s), spray interval (2 min) and pressure of the carrier gas (1.5 bar) were kept constant for each concentration. The X-ray diffraction patterns for the prepared films were obtained in a (Shimadzu XRD-6000) goniometer using copper target (CuKα, 1.5418 Å) and Atomic Force Microscopy (AFM) micrographs were recorded by using scanning probe microscope type (SPM- AA3000), contact mode, supplied by Angstrom Advanced Inc. Optical properties in the wavelength
range of (300-900) nm were investigated by using UV-VIS-NIR spectroscopy (Shimadzu, UV-1800). This
spectrophotometer was used to measure the relative transmittance and absorbance of as-deposited ZnO and Cobalt doped ZnO thin films.
RESULTS AND DISCUSSION
Figure (1) shows the photo image of Zinc-Cobalt Oxide
(Zn(1-x)CoxO) thin films, where x = 0, 4, 6 and 8 %. It is
reported that the stoichiometrically correct ZnO thin films are expected to have white color; however, the Co doped ZnO thin film deposited in the present study has light green color which can be attributed to d-d transitions of tetrahedrally coordinate Co2+ (Dinia et al., 2005).
Figure 1. Photo images of (Zn1-xCoxO) thin films, where x = 0, 4, 6 and 8 %
Structural analysis
The crystallite size was calculated by using the Scherrer’s formula, (Barret and Massalki, 1980).
Dav= …… (1)
Where, Dav is the crystallite size, K is a constant known as Shape factor (= 0.94), β is the Full width at half
maximum (FWHM) given in radians and θB is the
Bragg’s angle. The interplaner spacingd was calculated by using the Bragg’s relation (Elliot, 1983).
2dsinθ
nλ
...… (2)And, for the calculation of lattice parameter, the following formula was used (Elliot, 1983):
... (3)
In order to study the effect of the Co concentration on the structural properties of Zn(1−x)CoxO thin films, various dopants levels were used to obtain x values of (0, 4, 6 and 8) %. The XRD patterns of the Codoped ZnO films are shown in Figure (2). As can be seen, the observed peaks are located at (100), (002), (101), (102), (110) and (103) favorite directions respectively which is in agreement with the Joint Committee of Powder Diffraction Standards (JCPDS) card number 36-1451. The diffraction patterns reveal a good crystalline behavior without any appreciable changes from pure ZnO films and are genuinely polycrystalline with the hexagonal wurtzite structure. This indicates that Co doping did not change the crystal structure of the ZnO samples which implies that there were no secondary phases such as Co clusters or oxides. It may be due to very small amount of Co doping which was not enough for changing the crystal structure significantly. This behavior shows good agreement with the study done by Li et al. (2007). It can be noticed that 2θ for (002) direction decreases with increasing the Co concentration as shown in Table (1) expect for the sample where x=0.08 which has (100) favorite direction. It can be noticed also that the lattice constant (ao) increases as the Co concentration increases but (co) decreases. It should be mentioned here that the standard ao value for ZnO is 3.249 Å and the standard co value is 5.206 Å.
Figure 2. XRD patterns of Co doped ZnO thin films
The crystallite size decreases with increasing Co concentration expect for the sample where x=0.08 which has maximum crystalline size of 61.20nm. The values of the other structural parameters are shown in Table (1).
The texture coefficient (Tc) represents the texture of a particular plane, in which greater than unity values imply that there are numerous of grains in that particular direction. The
texture coefficients Tc(hkl) for all samples have been
[image:2.595.315.551.458.627.2] [image:2.595.42.287.528.588.2]calculated from the X-ray data using the formula (Pankove, 1971):
I
I
I
I
o(hkl) (hkl)
o(hkl) (hkl)
(hkl)
M
1
[image:3.595.42.284.161.389.2]Tc
…… (4)Table 1. Structural parameters of Co-doped Zinc Oxide thin films
Where I(hkl) is the measured intensity, Io(hkl) taken from the
JCPDS data, M is the reflection number and hkl are Miller indices. The texture coefficient is calculated for crystal plane (002) and (100) of the undoped and Co doped ZnO films. All values of texture coefficient were greater than 1 which indicates the abundance of grains in the (002) and (100) directions. The lattice constants ao and co are in a good agreement with the standard values (3.249Ǻ) and (5.206Ǻ) taken from (JCPDS) card file data. In hexagonal ideal hcp structure, the ratio of the lattice constants, c/a, is 1.602. In the present work two cases can be noticed, first the ratio is less than 1.602, which means that the atoms are compressed in the c-axis direction and second, the ratio is greater than 1.602 which means that the atoms are elongated along the c-axis.
AFM results
The 3D AFM micrographs of Co doped ZnO thin films are shown in Figure (3).
The size of the scanned area was (2x2) μm2. The images show
homogenous and smooth films. The average grain size obtained from the AFM granularity report, average roughness and root mean square (RMS) roughness for some samples are given in Table (2).
Table 2. The average grain size, average roughness and root mean square (RMS) roughness for some samples estimated from AFM
Optical properties
Optical absorption spectra of the films in spectral range of
(300-900 nm) were recorded by using UV–visible
spectrophotometer. The analysis of the dependence of absorption coefficient on photon energy in the high absorption region is performed to obtain the detailed information about the energy band gaps of the films (Sahin et al., 2014). Figure (4) shows the relation between transmittance for CodopedZnO thin films. It can be noticed that the transmittance increases rapidly as the wavelength increases in the range of (350- 450) nm for all films, which correspond to absorption band edge. Furthermore, small absorption bands can be noticed in the range of (590-690) nm for the Co doped ZnO samples. The absolute strength of these absorption bands increases almost linearly with the increase in Co concentrations and since the ionic radius of Co2+ (72 pm) being similar to that of Zn2+ (74 pm) in the tetrahedral coordinated structure, this phenomenon can be attributed to the d-d transitions of tetrahedrally coordinate Co2+ (Dinia et al., 2005). These transitions causes to change of sample color from white to green. The spectrum shows high transmittance in the visible and infrared regions, and low in the ultraviolet region.
[image:3.595.53.544.625.758.2]ZnOZn0.94Co0.06O Zn0.92Co0.08O
Figure 3. 3D AFM images of some of deposited films
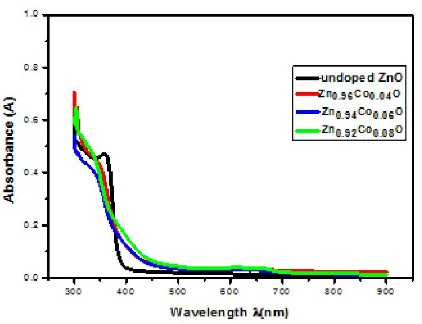
It can also be observed that the fundamental absorption edge is sharp in the region at the wavelength (~ 390 nm) of the spectrum. The maximum transmittance observed of was about 95% for undoped ZnO sample. Figure (5) shows the relation between absorbance (A) and wavelength for the deposited thin films. The absorbance decreases rapidly at short wavelengths corresponding to the energy gap of the film. This evident increase of energy is due to the interaction of the material electrons with the incident photons which have enough energy for the occurrence of electron transitions. It is observed that the absorbance increases as the Co-concentration increases.
Figure 4. Transmittance versus wavelength for Co doped ZnO thin films
Figure 6. Absorbance versus wavelength for Codoped ZnO thin films
The absorption coefficient can be estimated from the absorbance using the well-known formula:
α = (2.303×A)/t …… (5)
[image:4.595.63.269.195.346.2]Where A is the absorbance, t is the thickness and α is the absorption coefficient. It has been noticed that all the prepared thin films have high absorption coefficient in visible range of spectrum, and this could be seen in Figure (7). The absorption coefficient increases with increase in photon energy (hυ). The absorption coefficient of the deposited thin films at different Co doping levels has values of (α >104 cm-1) which implies the increase of the probability of the occurrence of direct transitions.
Figure 7. Absorption coefficient versus photon energy for CodopedZnO thin films
The optical energy band gap (Eg) is given by the classical relation (Omer, 1975):
r g
E hv B
hv ( )
…… (6)
Where α is the absorption coefficient, hν is the photon energy, Eg is the optical band gap, A is a constant which does not depend on photon energy and r has four numeric values (1/2) for allowed direct, 2 for allowed indirect, 3 for forbidden direct and 3/2 for forbidden indirect optical transitions. In this work, direct band gap was determined by plotting a graph between (αhv)2 and (hv) in eV, a straight line is obtained which gives the value of the direct band gap. The extrapolation of straight line to (αhv)2 = 0 gives value of the direct band gap of the material, and this could be seen in Figure (8). It is noticed that the band gap value increases with increase in Co doping concentration (4, 6, and 8) wt. %. This may be attributed to Burstein-Moss Shift (Kaiser and Fan, 1955). The refractive index has been calculated using the relation (Chopra and Kaur, 1983):
R
R k
R R
no o
1 1 1
1
1 2 1/2
2 2
…… (7)
Where n0 is the refractive index, R is the reflectance and ko is the extinction coefficient. The relation between refractive index and wavelength for ZnO thin films at different molarities is shown in Figure (9). It can be seen that the refractive index of the prepared films have values in the range of (2.71-1.41). The relation between extinction coefficient and wavelength for Co doped ZnO thin films is shown in Figure (10). The
extinction coefficient Ko decreases rapidly at short
wavelengths (300-400) nm and after that the value of Ko remains almost constant. The rise and fall in the value of Ko is directly related to the absorption of light. The lower value of Ko in the wavelength range (400-900) nm implies that these films absorb light in this region very easily. Results show that the extinction coefficient values of Co doped ZnO thin films are in the range of (0.012 - 0.13). The dielectric constant can
be represented by the following equation (Sudad S. Ahmed et
[image:4.595.60.271.380.542.2]= − …… (8) Where ε1 is the real part of the complex dielectric constant and ε2 is the imaginary part of it. For the calculation of the dielectric constant in its two parts one can use the following expressions:
= − …… (9)
[image:5.595.49.530.147.547.2]= 2 …… (10)
Figure 9. Refractive index versus wavelength of Co doped ZnO thin films
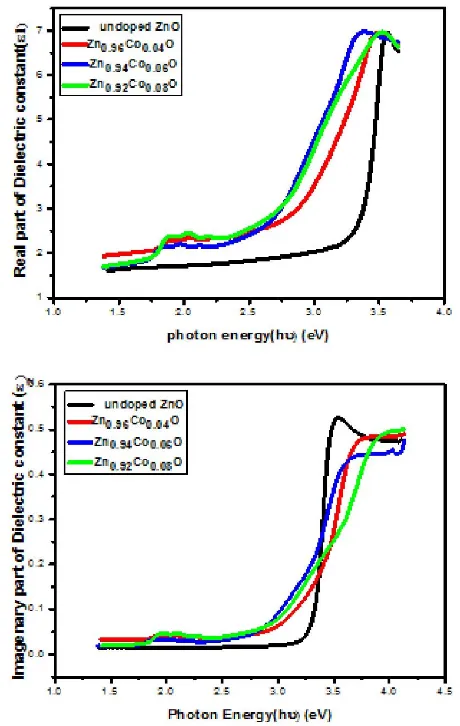
The relation between real and imaginary parts of dielectric constant and photon energy for Co doped ZnO thin films is show in Figure (11). It can be seen that both the real and imaginary parts of the dielectric constant increase as photon energy increases in the range of (1.25-3.5) eV and after that the value of the real and imaginary parts decrease. It is observed that both the real and imaginary parts of the dielectric constant increases with increase in Co doping concentration.
Figure 10. Extinction coefficient versus wavelength of CodopedZnO thin films
Figure 8. The relation between (αhυ)2 and (hυ) for Co doped ZnO thin films
1.0 1.5 2.0 2.5 3.0 3.5 4.0 4.5
0
1x10¹⁰
2x10¹⁰
3x10¹⁰
4x10¹⁰
5x10¹⁰
Zn0.96Co0.04O
h
^
2(eV
/C
m)^
2
Photon Energy(eV)
Eg=3.29eV
0.1M
1.0 1.5 2.0 2.5 3.0 3.5 4.0 4.5
0
1x10¹⁰
2x10¹⁰
3x10¹⁰
4x10¹⁰
Zn
0.92Co
0.08O
h
^2(eV/
Cm)^2
Photon Energy(eV)
Eg=3.32eV
0.1M
1.0 1.5 2.0 2.5 3.0 3.5 4.0 4.5
0.0
5.0x10⁹
1.0x10¹⁰
1.5x10¹⁰
2.0x10¹⁰
2.5x10¹⁰
3.0x10¹⁰
Zn0.94Co0.06O
h
^2
(eV
/Cm
)^2
Photon Energy(eV)
Eg=3.30eV
0.1M
1.0 1.5 2.0 2.5 3.0 3.5 4.0 4.5
0.0
2.0x10¹⁰
4.0x10¹⁰
6.0x10¹⁰
8.0x10¹⁰
1.0x10¹¹
0.1M_undoped ZnO
h
^
2(eV/
C
m)^
2
Photon Energy(eV)
Eg=3.27eV
[image:5.595.307.545.540.718.2]Figure 11. Real and imaginary parts of dielectric constant versus photon energy of Co doped ZnO thin films
Conclusion
In this study Zinc-Cobalt Oxide (Zn(1-x)CoxO) thin films, where x = 0, 4, 6 and 8 % were successfully deposited on glass substrates at (400 ºC) by chemical spray pyrolysis technique using Zinc and Cobalt acetate as the Zn and Co source. XRD patterns of the Co doped Zinc Oxide thin films reveal a good crystalline behavior with the hexagonal wurtzite structure. The main characteristic peaks are assigned to the (100), (200) and (220) planes. The adding of Co dopant led to a decrease in the average crystalline size and a stable maximum increase in the transmittance in (IR) region which can be useful in optoelectronic devices. The transmittance increases rapidly as the wavelength increases in the range of (350- 450) nm for all films, which correspond to absorption band edge. Small absorption bands had been noticed in the range of (590-690) nm for the Co doped ZnO samples. The absolute strength of these absorption bands increases almost linearly with the increase in Co concentration. This phenomenon can be attributed to the d-d transitions of tetrahedrally coordinate Co2+. These transition causes to change of sample color from white to green. AFM results showed homogenous and smooth thin films. The undoped ZnO thin film has highest grain size, average roughness and RMS roughness. The band gap increases as the Co concentration increases and the band gap values range between 3.27 eV and 3.32eV and this may be attributed to Burstein-Moss Shift.
REFERENCES
Ashour, A., M. A. Kaid, N. Z. El-Sayed, and A. A. Ibrahim, 2009. "Physical properties of ZnO thin filmsthin films grown by pulsed laser deposition", Applied Surface Science, Vol. 255, pp. 4153–4158.
Barret, C. and T. B. Massalki, 1980. "Structure of Metals", Oxford Pergamon.
Belghazi, Y., M. AitAouaj, M. El Yadari, G. Schmerber, C. Ulhaq-Bouillet, C. Leuvrey, S. Colis, M. Abd-lefdil, A. Berrada, and A. Dinia, 2009. “Elaboration and characterization of Co-doped ZnO thin films deposited by
spray pyrolysis technique”, Microelectronics Journal,
Vol. 40(2), pp. 265-267.
Chopra, K. L., I. J. Kaur, 1983. "Thin Film Device Applications", Plenum Press, New York.
Dinia, A., G. Schmerber, C. M´eny, V. Pierron-Bohnes, and E. Beaurepaire, 2005. “Room-temperature ferromagnetism in
Zn1−xCoxO magnetic semiconductors prepared by
sputtering”, J. Appl. Phys., Vol. 97, 123908 (5p.).
Elliot, S. R. 1983. "Physics of Amorphous Materials", Longman Group limited.
Fitzgerald, C. B., M. Venkatesan, J. G. Lunney, L. S. Dorneles, and J. M. D. Coey, 2005. “Cobalt-doped ZnO– a room temperature dilute magnetic semiconductor”, Applied Surface Science, Vol. 247, pp. 493–496.
Jeng-Lin Chung, Jyh-Chen Chen, and Chung-Jen Tseng, 2008. “The influence of titanium on the properties of zinc oxide films deposited by radio frequency magnetron sputtering”, Applied Surface Science, Vol. 254, pp. 2615–2620. Kaid, M. A. and A. Ashour, 2007. “Preparation of ZnO-doped
Al films by spray pyrolysis technique”, Applied Surface Science, Vol. 253, pp. 3029–3033.
Kaiser, W. and H. Y. Fan, 1955. “Infrared absorption of
indium antimonide”, Phys. Rev., Vol. 98, pp.966–968.
Li, J. H., D. Z. Shen, J. Y. Zhang, D. X. Zhao, B. S. Li, Y. M. Lu, Y. C. Liu and X. W. Fan, 2007. "The Effect of Mn2+ doping on structure and Photoluminescence of ZnOnano films synthesized by Sol gel method," J. Lumin., Vol. 122-123, pp. 352-354.
Ling Wei, Zonghui Li, and W. F. Zhang, 2009. “Influence of Co doping content on its valence state in Zn1-xCoxO (0 ≤ x ≤ 0.15) thin films”, Applied Surface Science, Vol. 255, pp. 4992–4995.
López, M. C., J. P. Espinos, D. Leinen, F. Martín, S.P. Centeno, R. Romero, and J. R. Ramos-Barrado, 2008. “Growth and characterization of the ZnO/ZnS bilayer obtained by chemical spray pyrolysis”, Appl. Surf. Sci., Vol. 255, pp. 2118–2124.
Ngoma, B. D., T. Mpahane, N. Manyala, O. Nemraoui, U. Buttner, J. B. Kana, A. Y. Fasasi, M. Maaza, and A. C. Beye, 2009. “Structural and optical properties of nano-structured tungsten-doped ZnO thin films grown by pulsed laser deposition”, Applied Surface Science, Vol. 255, pp. 4153–4158.
Omer, M. A. 1975. "Elementary of Solid State Physics", Addison Wesley Publishing Co., London.
Pankove, J. I. 1971. "Optical Process in Semiconductors", Dover Publishing Inc., New York.
Thin Films Deposited by Silar Method,” M. J. Con. Mat., Vol. 12(2), p. 125.
Sahin, B., F. Bayansala, M. Yukselc, N. Biyiklib, 2014. "Effect of Co Doping on Structural and Optical Properties of NiO Thin Films Prepared By Chemical Spray Pyrolysis Method", J. Ceramics International, Vol. 40, pp. 5237-5243.
Saleh, A. F., 2013. “Structural and morphological studies of NiO thin films prepared by Rapid thermal oxidation
method”, International Journal of Application or
Innovation in Engineering & Management (IJAIEM), Vol. 2(1), pp. 16-21.
Shinde, S. S., P.S. Shinde, S.M. Pawar, A.V. Moholkar, C.H. Bhosale, and K.Y. Rajpure, 2008. "Physical properties of transparent and conducting sprayed fluorine doped zinc oxide thin films", Solid State Sciences, Vol. 10, pp. 1209-1214.
Sudad S. Ahmed, Eman K. Hassan, Ghuson H. Mohamed, 2014. "Investigation of Optical Properties of NiO0.99Cu0.01 Thin Film by Thermal Evaporation Technique", International Journal of Advanced Research, Vol. 2(2), pp.633-638.
Tsang, W. M., F. L. Wong, M. K. Fung, J. C. Chang, C. S. Lee, and S. T. Lee, 2008. "Transparent conducting aluminum-doped zinc oxide thin film prepared by sol-gel process followed by laser irradiation treatment", Thin Solid Films, Vol. 517(2), pp. 891-895.
Vijayan, T. A., R. Chandramohan, S. Valanarasu, J. Thirumalai, S. Venkateswaran, T. Mahalingam and S. R. Srikumar, 2008. "Optimization of growth conditions of ZnOnano thin films by chemical double dip technique", International Journal of Emerging Technologies in Computational and Applied Sciences (IJETCAS), Vol. 9, 035007 (5p.).
Wei Lin, Ruixin Ma, Wei Shao, and Bin Liu, 2007. “Structural, electrical and optical properties of Gd doped and undoped ZnO: Al (ZAO) thin films prepared by RF magnetron sputtering”, Applied Surface Science, Vol. 253, pp. 5179–5183.
Yaodong Liu, Lei Zhao and JiansheLian, 2006. “Al-doped ZnO films by pulsed laser deposition at room temperature”, Vacuum, Vol. 81, pp. 18-21.
Young-Sung Kim and Weon-Pil Tai, 2007. “Electrical and optical properties of Al-doped ZnO thin films by sol-gel process”, Applied Surface Science, Vol. 253, pp. 4911-4916.