INVESTIGATIONS ON THE DURABILITY PARAMETERS OF DIFFERENT
GRADES OF CONCRETE
M.Gayatri
1, N. Ashok kumar
2, K. Ravi Theja
31
Student, M.Tech, Civil Department, SVTM, Madanapalle, A.P, India
2,3Assistant Professor, Civil Department, SVTM, Madanapalle, A.P, India
---***---Abstract:- Durability of concrete is of vital importance to its long term performance. The durability is linked to the permeability of the concrete. A number of different parameters are used to characterize the durability. This study aims to characterize different types of concrete with respect to their durability parameters. The parameters include the conventional indices such as water absorption and rapid chloride permeability, as well as newly developed indices such as water absorptivity and oxygen permeability. The results of this study indicate that not all the durability parameters are related well to the strength of the concrete, which is conventionally used as a measure of the durability of the concrete. This is because the factors responsible for strength and durability need not be the same. The influence of water to cement ratio and cement content on the variation of the durability indices was also evaluated in this study.
Cement concrete despite of its inherent deficiencies, is the most extensively used material for the construction of large infrastructure facilities. During last 90 years, there has been substantial advancement in the science and practice of concrete technology, out of which the last 30 years have seen phenomenal progress. Normal concrete typically has 20MPa to 40MPa compressive strength, which is adequate for most structural applications. Recent concerns about the long-term performance of concrete led to interest being focused on parameters which control the durability and methods of test which meaningfully quantify these parameters. There is a growing realization that the cube crushing strength, for long the sole indicator of quality, is insufficient to ensure long-term durability for concrete as a material and serviceability of a structure made from it.
Penetration of moisture and other hydrogenous liquids in buildings, constructions and other building materials is of great importance in the building industry. Many countries around the world are located in very aggressive environments and using different types and grades of concrete. Reinforced Concrete Structures are exposed to harsh environments even though these are expected to last for long periods of time (often 100 years or more) with little or no repair or maintenance. With the increasing diversity of concretes available, there is a need to move to concrete durability study and comparison of various durability parameters. The synergisms existent among the saline environment, high temperatures, relative humidity and the poor quality control of concrete production process (workmanship, materials and procedures inadequate) can lead to damages in reinforced concrete structures.
The penetration of moisture into structures can cause damage by the action of chemical containment agents transported by water; by the action of microorganisms growing in the humid environment or by the mechanical action of freezing and thawing. On the other hand, most of the penetrating water leaves the porous system by drying, which can cause shrinkage and carbonation in cementations materials. As many building materials are porous, the understanding of moisture transport in the porous system represents an important issue. The ability of concrete to withstand the penetration of liquid and oxygen can be described as the durability of concrete. The durability of concrete, can in turn, be quantified by certain characteristics of the concrete such as the porosity, absorptivity and permeability.
cementitious materials and aggregates, etc. Therefore, in order to improve the durability of concrete, the mixture proportions of concrete should be carefully selected considering the effects on durability.
The permeability of the concrete is depending on the porosity, and on the connectivity of the pores. The more open
the pore structure of the concrete, the more vulnerable the material is to degradation mechanisms caused by penetrating substances. Recent concerns about the long-term performance of concrete led to interest being focused on parameters which control the durability and methods of test which meaningfully quantify these parameters. There is a growing realization that the cube crushing strength, for long the sole indicator of quality, is insufficient to ensure long-term durability for concrete as a material and serviceability of a structure made from it. Other material factors should be explored with a view to establishing whether meaningful additional information could be provided, and whether such information could be determined in a manner which is commensurate with the application of concrete. Pore structure has long been recognized as strongly relating to many, if not all, aspects of durability, and it is felt that some form of permeability test might be devised which would have the necessary features. Of primary interest in a typical concrete structure is the surface region which protects the reinforcement from corrosion and which is subject to penetration by oxygen, carbon dioxide and water.
1.1. NEED FOR PRESENT STUDY
Almost 90% of the constructions are made with Ordinary Portland cement (OPC) and typically the grade of concrete is in the range 20-40 with water cement ratios in the range 0.35-0.65 and cement contents in the range 300-400 kg/m3. We must have a thorough knowledge of the durability parameters of concretes with Water to cement (w/c) ratios and cement contents in this range and their variation so that these issues can be addressed during mix design and the maintenance efforts will be minimal to nil. The durability index results are required for concrete mix design, mix acceptance and onsite quality control.
1.2.OBJECTIVES
To evaluate the water absorption, water absorptivity, oxygen permeability and chloride permeability of different grades ofconcrete.
To investigate the effect of water to cement ratio and cement content on the durability parameters and indices.
To assess the link between compressive strength and durability parameters and indices.1.3. SCOPE
The test methods selected for assessing the durability of concrete are Oxygen permeability test, Water sorptivity test, Surface water permeability test, Rapid chloride permeability test and water absorption test and the study is based on laboratory experimentation. Only three water cement ratios namely 0.35, 0.5 with constant cement content and 0.65 with three different
cement contents (300, 350 and 400 kg/m3) are used in this study. Commercially available 53 Grade OPC, locally available
aggregates, one grade of concrete and one set of chemical admixtures are used for the study and the properties of material are assumed to be constant and the variability between different batches of material as well as the ambient conditions has not been accounted for.
1.4 NEED FOR STUDY
There are a number of tests, based on a variety of mechanisms, which can be used for measurement of rates of fluid transport through concrete. Air (or oxygen) permeability, water permeability, carbonation depth, chloride permeability, and/or resistivity are often conducted to develop correlations among these characteristics. For a specific investigation, acceptable correlations can usually be established. However, the correlations are dependent on the specific parameters involved in each study and therefore cannot be generalized. Hence, correlations between different durability index tests for the different grades of concrete are deemed necessary.
2. Experimental Investigations
2.1. MATERIALS USED
scope of the study. Three levels of w/c 0.35, 0.50 and 0.65 with constant cement content were studied and three different cement contents of 300, 350, and 400 kg/m3 at a w/c of 0.65 were studied to find the effect of w/c and cement content on the durability indices of concrete.
2.1.1 Cement
[image:3.612.178.438.216.376.2]The cement used for the study was a 53 grade Ordinary Portland Cement (OPC) confirming to IS 12269 (1987). The physical and mechanical characteristics of the cement used are given in Table 2.1.
Table 2.1 Properties of Cement
2.2.2 Coarse and Fine Aggregates
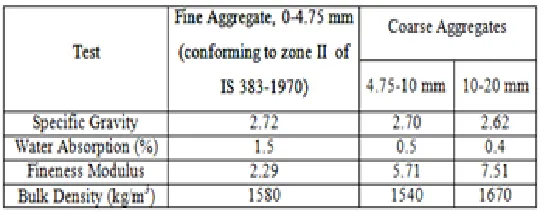
The aggregate characteristics such as particle size distribution, water absorption, and specific gravity were determined according to IS 2386 (1963) and the results are given in the following sections for 0-4.75 mm siliceous sand, 4.75-10 mm and 10-20 mm crushed granite gravel.
The sieve analysis was done according to IS 2386, 1963 (Method of test for aggregates for concrete, Part I – Particle Size and Shape). The results of the tests on fine and coarse aggregates are as shown if Fig.3.1 and 3.2. The sand has a fineness modulus of 2.30 and is confirming to grading zone II of table 4 of IS 383, 1970 (Specification for coarse and fine aggregates from natural sources for concrete).
The specific gravity and bulk density were determined for each aggregate according to IS 2386, 1963 (Method of test for aggregates for concrete, Part III – Specific Gravity, Density, Voids, Absorption & Bulking). The specific gravity and bulk
density for 20 - 10 mm, 10 - 4.75 mm and 4.75 - 0 mm aggregates were 2.72 and 1580 kg/m3, 2.70 and 1540 kg/m3 and
2.62 and 1670 kg/m3 respectively. The summary of aggregate test results is shown in Table 2.2
Table 2.2 Summary of Tests on Aggregates
[image:3.612.171.445.595.701.2]aggregates for concrete, Part III – Specific Gravity, Density, Voids, Absorption & Bulking). The absorption coefficients for 20 - 10 mm, 10 - 4.75 mm and 4.75 mm aggregates were 0.4 %, 0.5% and 1.5% respectively.
2.3 MIXTURE PROPORTIONS
ACI method of mixture proportioning, namely, ACI 211.4R-99 is adopted as only a guide for arriving at the initial mixture proportions. However the final proportions were arrived after several trial mixes. In this study, five control mixtures, with water cement ratios of 0.35, 0.5 and 0.65, and with three cement contents, 300kg/m3, 350kg/m3 and 400kg/m3 were used. Appendix gives the mixture design procedure adopted for the present investigations, along with the various steps involved in arriving at the quantities of the materials. The details of the mixture proportions for the present study are given in Table 2.3.
Glenium B233 is used as superplasticizer. Coarse aggregates were blended in the ratio 60: 40 of 20 and 10 mm sized aggregates respectively. The moisture content of each batch of aggregates was determined before mixing, by using the microwave method described in ASTM D 4643 (1987). The concrete was mixed in a pan type mixer having 60 litre capacity and the mixing time for all the mixes was kept as 5 minutes. The mixer drum was made just wet condition by wiping with a wet piece of sponge before the material is charged so that no water will draw from the mixing water for wetting the surface of the drum. Coarse aggregate was charged to the mixer followed by cement and sand. Dry mixing was done for one minute and 70% of the mixing water was added in the next 1.5 minutes. Then superplasticizer was added (for w/c ratio 0.35 mix only) followed by the remaining water and mixed for 2 minutes. The cubes were demolded after 24 hours and kept in curing tank containing water saturated with calcium hydroxide. Cubes were tested with a loading rate of 0.25 MPa/second as per IS 516 (1959).
3. EXPERIMENTAL ANALYSIS AND DISCUSSION OF TEST RESULTS
3.1.1. Compressive Strength
It is observed from the Table 3.1, for a cement content of 350kg/m3, 28 days compressive strength of the concrete mixtures increased by 59% when the w/c was reduced from 0.650 to 0.50 and it is increased by 43% when the w/c was reduced from 0.5 to 0.35. It concludes that there is higher strength gain when the w/c reduces from 0.65 to 0.50 than that of w/c 0.50 to 0.35.
For a w/c of 0.65, the 28 days compressive strength of the concrete mixtures increased by 6%, when the cement content
was increased from 300kg/m3 to 350kg/m3, and it is increased by 12%, when the cement content was increased from
350kg/m3 to 400kg/m3. It concludes that there is higher strength gain when the cement content increases from
350kg/m3 to 400kg/m3 as compared to increase from 300kg/m3 to 350kg/m3.
It is seen that the compressive strength of concrete mixture M1 at different ages expressed as a fraction of its 28 days compressive strength, increases from 71% at 3 days to 83% at 7 days. The corresponding values for M2, M3, M4 and M5
were 46%- 62%, 61%-63%, 40%-57% and 53%-67% at 3rd day and 7th day respectively. From this we can interpret
that at lower w/c ratios the strength gain at early ages of concrete is high.
3.2.DURABILITY INDEX RELATED PROPERTIES
3.2.1.Oxygen permeability Test
It is observed from the Table 3.3, for a cement content of 350kg/m3, the OPI values for the concrete mixture M1 are in
the range of 9.5-10, and is classified as “Good” according to durability class characterization chart prepared by Ronne and Alexander (2002). For M2 and M3 mixtures the OPI values are less than 9.0 which are classified as “Very Poor”, there is an increase in OPI values by 1.70% at 7 days and by 1.92% at 28 days when the w/c reduces from 0.65 to 0.50. And there is an increase in OPI values by 6.03% at 7 days and by 6.54% at 28 days when the w/c reduces from 0.50 to 0.35
3.3.2. Water sorptivity Test
3.3.4 Rapid Chloride Permeability Test
3.3.5 Water Absorption Test
4. CONCLUSIONS
The present chapter summarizes the observations made and conclusions drawn from the study of various durability index parameters, study of effect water to cement ratio and cement content on durability indices. In this chapter the conclusion followed by scope for further research.
4.2. CONCLUSIONS
The performance of five concrete mixtures are studied and the results can be concluded in the form of table
The ratings based on the relative comparison between two cases, (i) the decrease in w/c from 0.65 to 0.50 and (ii) the decrease in w/c ratio from 0.50 to 0.35.
The ratings based on the relative comparison between two cases, (i) the increase in cement content from 300 to 350kg/m3 and (ii) the increase in cement content from 350 to 400kg/m3.
The performance of five concrete mixtures are studied and the results can be concluded as
➢
Water to cement ratio affect the properties of the durability of concrete to a significant degree.➢
It is observed that there is higher strength gain when the cement content increases from 350kg/m3 to 400kg/m3as compared to increase from 300kg/m3 to 350kg/m3.
➢
It was observed that at lower w/c ratios the strength gain at early ages of concrete is high.➢
Up to a w/c of 0.50, there is a marginal difference in OPI values, beyond which a considerable increase is observed.➢
At higher w/c (0.65) and at higher cement contents, there is a marginal difference in OPI values, which may be do tohigher rate of hydration.
➢
Shows that the Age of curing has a significant effect on the permeability of concrete.➢
There is no significant difference in water sorptivity values from 7 day to 28 day results when w/c reducing form 065to 0.50
➢
The effect of cement content on water sorptivity is significant up to 350kg/m3 beyond which a marginal improvementin sorptivity values.
➢
There is no effect of w/c on the surface water permeability values. But the cement content has an effect on the surfacewater permeability as cement content increases the permeability values are decreasing.
➢
There is not much variation in chloride permeability values from 7 days to 28 days when the w/c decreases from0.65 to 0.50
➢
The effect of w/c ratio on water absorption is significant when the w/c ratio increases beyond 0.50.➢
The effect of cement content on the water absorption values are significant as the cement content increasesthere is a considerable decrease in water absorption.
➢
There is a linear relationship between the compressive strength and oxygen permeability index values.➢
The transport of chloride ions into concrete is a complicated, multi- mechanistic phenomenon.➢
It was observed that a linear relationship exist between the Total charge passed (chloride permeability) and thecompressive strength.
➢
It can also be inferred that the OPI values increase with the increase in the cement content from 300-350kg/m3 andthereafter only a marginal increase is there with increase in cement content.
➢
It was observed from the correlation between the compressive strength and water sorptivity, that the model is notfitted with the actual values at 28day of curing, while 7 days of curing the model seems to be well fitted.
➢
It was observed that the model is well fitted to the actual values. It can also be observed that for constant cementcontent and varying w/c, a linear relationship exists between compressive strength and Surface water Permeability values for both 7 and 28 days curves.
➢
The correlation analysis between compressive strength and surface water permeability showed that model is notfitted with the actual values at 28day of curing, while 7 days of curing the model seems to be well fitted, when the cement content varying with a constant w/c.
➢
The correlation analysis between compressive strength and total charge passed showed that for constant cement➢
A linear relationship between the compressive strength and water absorption exist for both 7 and 28 days curves. It can also be inferred that for the increase in the cement content there is decrease in the water absorptionREFERENCES
Abbas A., Carcasses M., Ollivier J.P. (1999), Gas permeability of concrete in relation to its degree of saturation, Materials and Structures, Vol. 32, No. 1, pp. 3-8.
ACI Committee 211.4. (1999), Guidelines for selecting proportions for High strength concrete with portland cement and Fly
ash, ACI Manual of concrete Practice.
ASTM C-642, “Standard Test Method for Specific Gravity, Water Absorption and Voids in Hardened Concrete”.
ASTM D 4643-87 (1987), “Standard Test Method for Determination of Water (Moisture) Content by the Microwave Oven
Method”.
Balayssac J.P., Detriche Ch. H., Grandet J. (1993), Validity of the Water Absorption Test for Characterizing Cover Concrete.
Materials and Structures, Vol. 26, No. 158, pp. 226-230.
Ballim Y. (1991), A low cost falling head permeameter for measuring concrete gas permeability. Concrete Beton, Vol. 61, pp.
13-18.
Ballim Y. (1993), Curing and the durability of OPC, fly ash and blast-furnace slag concretes, Materials and Structures, Vol. 26, No. 4, pp. 238-244.
Dinku A., Reinhardt H. W. (1997), Gas permeability coefficient of cover concrete as a performance control, Materials and
Structures, Vol. 30, No. 7, pp. 387-393.
Feldman R., Luiz R., Prudencio Jr., Gordon Chan (1999), Rapid chloride permeability test on blended cement and other
concretes: correlations between charge, initial current and conductivity, Construction and Building Materials, Vol. 13, No. 3,
pp. 149-154.
Ho D.W.S., Chua C.W., Tam C.T. (2003), Steam-cured concrete incorporating mineral admixtures, Cement and Concrete
Research, Vol. 33, No. 4, pp. 595–601.
Hootona R.D., M.P. Titherington (2004), Chloride resistance of high-performance concretes subjected to accelerated curing,
Cement and Concrete Research, Vol.34, No. 9, pp. 1561–1567.
IS – 4031 Part (V) – 1988 (Reaffirmed 1995), “Methods of Physical Tests for Hydraulic Cement – Determination of Consistency of Standard Cement Paste”, Bureau of Indian Standards, New Delhi, India.
IS – 4031 Part (V) – 1988 (Reaffirmed 2000), “Methods of Physical Tests for Hydraulic Cement – Determination of Initial and
Final Setting Times”, Bureau of Indian Standards, New Delhi, India.
IS 383 (1970), “Specification for coarse and fine aggregates from natural sources for concrete,” Bureau of Indian Standards.
IS – 8142 – 1976 (Reaffirmed 1997), “Method of Test for Determining Setting Time of Concrete by Penetration Resistance”
IS – 516 – 1959, “Methods of Tests for Strength of Concrete”, Bureau of Indian Standards, New Delhi, India.
IS – 12269 – 1987, “Specification for 53 grade ordinary Portland cement,” Bureau of Indian Standards.
IS – 2386 Part-1 (1963), “Methods of Test for Aggregates for Concrete - Part 1: Particle Size and Shape,” Bureau of Indian