Identifying the Topic-Specific Influential Users in Twitter
May Shalaby
Department of Computer Science and Engineering
The American University in Cairo
Ahmed Rafea
Department of Computer Science and Engineering
The American University in Cairo
ABSTRACT
Social Influence can be described as the ability to have an effect on the thoughts or actions of others. Influential members in online communities are becoming the new media to market products and sway opinions. Also, their guidance and recommendations can save some people the search time and assist their selective decision making. The objective of this research is to detect the influential users in a specific topic on Twitter. From a collection of tweets matching a specified query, the influential users are to be detected in an online fashion. In order to address this, the issue of which set of features can best lead us to the topic-specific influential users is investigated along with how these features can be expressed in a model to produce a list of ranked influential users.
Keywords
Twitter, Feature Selection
1.
INTRODUCTION
Tapping on the influential people in an online community can help understand the changing interests, foresee potential pitfalls and likely gains, and adapt plans timely and pro-actively. This is can be especially beneficial in developing business opportunities, forging political agendas, discussing social and societal issues, and can also lead to many interesting innovative applications [1]. The popularity of Twitter makes it an important tool for journalism, marketing, political campaigns and social change, and has thus drawn increasing interests from both the industry and research community. The objective of this research is to detect the topic-specific influential users on Twitter. From a collection of tweets matching a specified query, retrieved in reverse chronological order, relevant influential users are to be detected in an online fashion. Provided information about the tweets and their authors, which set of features can best lead to the topic-specific influential users is investigated along with how these features can be expressed to produce a ranked list of influential users. A number of ranking methods were developed and the outcome evaluated in reference to a manually assembled list of influential users. The rest of this paper is organized as follows: section 2 reviews some approaches covered in the literature. Section 3 describes the proposed approach. Section 4 shows the experiments carried out using the Twitter features and finally, in section 5, we conclude our work.
2.
APPROACHES FOR THE
IDENTIFICATION OF INFLUENTIAL
USERS
In this section, some approaches for the identification of influential users in an online social network are reviewed. Also
reviewed are a few of the evaluation approaches carried out in the literature.
Agarwal et al. [1] was of the first to propose a model quantifying an influential blogger. Akritidis et al. [2] used the same concept and proposed two ranking methods, but incorporate temporal aspects of the blogging activity. Akritidis et al. [3] then proposed two time-aware metrics identifying bloggers who are both productive and influential. Zhou et al.[4] introduced the concept of Opinion Networks, and proposed a PageRank-like algorithm. Weng et al. [5] proposed the topic-sensitive algorithm TwitterRank. Yao et al. [6] propose an improved method of the traditional PageRank algorithm to evaluate the influence of nodes in large-scale social networks. Xiao et al. [7] proposed a fuzzy mathematics-based method that measures user influence by covering multiple metrics.
For evaluation, as an alternative to the ground truth, Agarwal et al. [1] resorted to Digg (http://www.digg.com) to provide a reference point. Akritidis et al. [3] evaluated their proposed methods against the methods reported in [2]. Bakshy et al. [8] and Romero et al. [9] both resorted to Bit.ly (https://bitly.com). Zhou et al. [4] constructed a Golden Standard from a real trust network collected from Epinions (http://www.epinions.com). Other than that, the evaluation of the different influence measures is usually done manually, like in [5, 10 and 11]. It is obvious that each evaluation approach highly relies on the type of data being analyzed, where some studies would customize the dataset and scope of the research to be able to use a certain reference point for evaluation.
3.
THE PROPOSED APPROACH
After retrieving the necessary data from Twitter, the non-personal accounts were filtered out. Inspired by models in the literature utilizing post and user features, the effect of different features on detecting influence was studied, and a couple of user ranking approaches were proposed.
3.1
Collecting Data from Twitter
Utilizing the Twitter REST API, tweet collections matching specified search words were retrieved, accompanied by tweet and user metadata. The more popular a topic the more tweets there are to retrieve, so search keywords were selected by tracking local trending topics on Google Trends and Twitter Trends.
3.2
User Accounts Classification
managed and bot-controlled accounts do not exhibit the kind of influence we are looking for. Support Vector Machines (SVM) is used for automated account classification. The accounts were classified using a set of the user account features: the followers count, friends count, listed count, favorites count and the user’s activity rate. Using LIBSVM [12], the accounts are classified after the SVM model is trained with 10-fold cross validation.
3.3
Feature Selection
In order to consciously use features from Twitter to develop a model for ranking the users according to influence, the feature dependencies were tested. Using a collection of queried tweets, the correlation values between each of the features related to the user tweets were calculated; dependent features will show high correlation values.
Based on feature analysis and literature review, the following are a selected set of features believed to be relevant for detecting influential users. The features are generated from the tweets’ retrieved metadata. Statuses count; the number of tweets issued by the user. Account age (in days); the number of days since the account was created on Twitter. Activity rate (in days), since [9] found that influential individuals are often highly active users.
𝐴𝑐𝑡𝑖𝑣𝑖𝑡𝑦 𝑟𝑎𝑡𝑒 = 𝑠𝑡𝑎𝑡𝑢𝑠𝑒𝑠 𝑐𝑜𝑢𝑛𝑡 𝑎𝑐𝑐𝑜𝑢𝑛𝑡 𝑎𝑔𝑒
Account age_activity combination, combining the Account’s age and average activity rate, since the earlier they join and more active they are, the more likely they will be considered as leaders [4].
𝐴𝑐𝑐𝑜𝑢𝑛𝑡 𝑎𝑔𝑒 𝑎𝑐𝑡𝑖𝑣𝑖𝑡𝑦 𝑐𝑜𝑚𝑏𝑜 = 0.5 ∗ 𝑁𝑜𝑟𝑚𝑎𝑙𝑖𝑧𝑒𝑑 𝑎𝑐𝑐𝑜𝑢𝑛𝑡 𝑎𝑔𝑒 + 0.5 ∗
𝑁𝑜𝑟𝑚𝑎𝑙𝑖𝑧𝑒𝑑 𝑢𝑠𝑒𝑟′𝑠 𝑎𝑣𝑒𝑟𝑎𝑔𝑒 𝑑𝑎𝑖𝑙𝑦 𝑎𝑐𝑡𝑖𝑣𝑖𝑡𝑦 𝑟𝑎𝑡𝑒 Followers count, an approximate indicator to the size of that
user’s audience following the assumption that the more the followers the more impact the user may have. TFF Ratio, the ratio of a user’s followers’ count to friends count. This metric was used in [10], considering users with higher TFF Ratio as more relevant. Listed count; the number of public lists that this user is a member of, since those listed are usually the highly read users [13]. Collection tweets count; the number of tweets in the queried collections posted by the user; an indicator of a user’s involvement in the queried topic. A user is considered to be productive if they had posted several posts recently [3]. Average Retweet count, the average number of times a user’s tweet(s) has been reposted in the queried collection. Retweets are the most popular measure of a tweet’s popularity and act as endorsement to quality and the user's ability to generate content with pass-along value. Average Favorited count; the average number of times a user’s tweet(s) was marked as favorite. Average Tweet age (in minutes) of the user’s collection tweets. The age of a tweet may be looked at from two different perspectives. The first is novelty; authors of the older collection tweets may be viewed as those who first started discussing the topic. The second is taking into account the rapid changes, so for older posts to be kept alive, through retweets, is indication of its importance. Average Retweet frequency of the collection tweets, reflecting the rate at which the message spread across the network.
𝐴𝑣𝑒𝑟𝑎𝑔𝑒 𝑟𝑒𝑡𝑤𝑒𝑒𝑡 𝑓𝑟𝑒𝑞𝑢𝑒𝑛𝑐𝑦 = 𝑎𝑣𝑒𝑎𝑟𝑔𝑒 𝑟𝑒𝑡𝑤𝑒𝑒𝑡𝑠 𝑐𝑜𝑢𝑛𝑡 𝑎𝑣𝑒𝑟𝑎𝑔𝑒 𝑡𝑤𝑒𝑒𝑡 𝑎𝑔𝑒 + 1
The addition of 1 to the “average tweet age” is to avoid division by zero. Also, due to some of the users having more than one tweet within the collection, the average is used as a representative of the feature for the user.
3.4
Detecting Topic-Specific Influential Users
First the users are ranked according to each of the selected features to see their effect on the users' ranking. Then two different user ranking methods were developed. In the first, equations combining the best of the selected features were used to score and rank the users. In the second, the users are ranked according to each of the selected features and then divided according to their appearance frequency in the lists. Finally, to determine the method that gives the most satisfactory topic-specific user ranking and verify its effectiveness, the same two methods were carried out on a number of different tweet collections and their outcomes studied and compared.3.5
Model Evaluation Method
A manual evaluation approach was found to be the most reliable and suitable to the search. For a specific collection of tweets used in the experiments, a list of the topic-specific influential users in that collection was manually compiled. From the 1221 users in that collection, 31 influential users were identified. The number of users from the annotated list that made it to the top ranking according to the model is measured, and the precision calculated, representing the fraction of the users that are considered influential. This, however, can only be done on a limited scale. For the final verification experiment, which is carried out on twenty different collections of queried tweets, the outcome was evaluated by studying only the users proposed by the methods as influential; investigating each of the users the same way the 1221 users of the initial collection were annotated.
To annotate the 1221 users in the initial collection, the users were sorted according to each of the eight selected features and each of the top 50 ranking users were studied individually. To determine whether a user is influential or not, the content of the user’s tweet was judged based on its relevance to the queried topic, its readability and the message it conveys. Then by going to the user’s profile, the user’s mini-biography is studied. A good bio would include critical keywords describing the user and the nature of the posts. The user’s recent activity and the ratio of original posts to retweets are investigated. Also being observed are the content, writing style, topic interests; their consistency and relevance to the topic-specific queried tweets, and also the user’s target audience and their interactions with them.
4.
EXPERIMENTAL RESULTS
Before carrying out the experiments, the user accounts are classified, filtering out the non-personal accounts. The first experiment helps decide on which features to use to develop the users’ ranking model. Following that, the selected features are used to experiment with two different ranking models. Then to settle on the method that results in the most satisfactory ranking, a final verification experiment is carried out.
4.1
Feature Selection
Data Description. 5471 unique users were extracted from 10,539 tweets. Each user is associated with the features listed in section 3.3.
Method. The correlation values between each of the selected features are calculated to shed light on dependencies between them.
Results. High correlation values were found between several of the features. The highest correlation values found were 0.957 between users’ Followers count and Listed count, 0.909 between the Account Age and Age-Activity combo feature, 0.841 between the Average Favorite count and the Average Retweet count, 0.653 between the Activity Rate and the Statuses count, and finally 0.516 between the Statuses count and Age-Activity combo.
Discussion. With a correlation threshold of 0.5, it was decided to focus on Retweets count over the Favorited count since retweets have a bigger impact by spreading the message. It was also decided on the Followers count over the Listed count. Between a user’s Average Activity rate and Statuses count, it was decided that the Average Activity rate is a more accurate activity representation. Finally, the list of features that will be experimented with is: Feature 1: The user’s average daily activity rate, Feature 2: Account age activity combination, Feature 3: Followers count, Feature 4: TFF Ratio (Twitter Follower-Friend Ratio), Feature 5: Collection tweets count, Feature 6: Average Retweet count, Feature 7: Average Tweet age (in minutes), Feature 8: Average Retweet frequency (per minute).
4.2
Ranking Users: the top ranking features
In this experiment the effect of ranking the users according to each of the selected features is observed.
Data Description. 1221 unique users from tweets spanning 3 hours, queried on November 5th, 2013, with the words “
مساب
فسوي”.
Method. For each of the features settled on in section 4.1, the users are ranked accordingly in descending order, and their effectiveness evaluated in ranking the influential users. For evaluating, the manually assembled list of 31 influential users is referred to, according to which the rankings’ precision values are calculated.
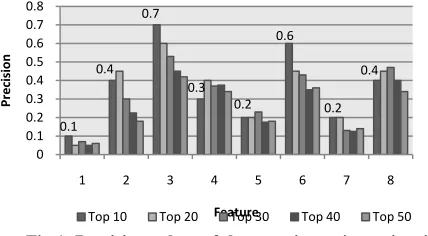
Results. The users are ranked according to each of the eight features and the precision at 10, 20, 30, 40 and 50 are calculated and plotted as may be seen in Figure 1 where the Features 2, 3, 6 and 8 have higher precision values than those of Features 1, 4, 5 and 7.
[image:3.612.321.535.79.197.2]Discussion. Based on the precision at 10 values, the feature with the highest precision was Feature 3 at 0.7, reflecting user popularity, followed by Feature 6 at 0.6. Feature 2 and Feature 8 followed, both with 0.4 precision. Features 6 and 8 reflect the attention the user's tweets got. Feature 2 consolidates the hypothesis that older, active accounts are likely considered as leaders.
Fig 1: Precision values of the experiment in section 4.2
4.3
Ranking Users: combining the best features
In this experiment the effect of combining the best features on the users’ ranking is observed.
Data Description. The same 1221 users from the tweets collection used in the experiment in section 4.2.
Method. The features from section 4.2 which resulted in the highest precision at 10 values are: Feature 2 (AAcombo), Feature 3 (F), Feature 6 (RT) and Feature 8 (RTfreq). Combining the best four, three and two features, the users were ranked according to
each of the following scores:
𝑆𝑐𝑜𝑟𝑒 1 = 1
4(𝑁𝑜𝑟𝑚𝑎𝑙𝑖𝑧𝑒𝑑 𝑨𝑨𝒄𝒐𝒎𝒃𝒐 + 𝑁𝑜𝑟𝑚𝑎𝑙𝑖𝑧𝑒𝑑 𝑭 + 𝑁𝑜𝑟𝑚𝑎𝑙𝑖𝑧𝑒𝑑 𝑹𝑻 + 𝑁𝑜𝑟𝑚𝑎𝑙𝑖𝑧𝑒𝑑 𝑹𝑻𝒇𝒓𝒆𝒒)
𝑆𝑐𝑜𝑟𝑒 2 = 1
3(𝑁𝑜𝑟𝑚𝑎𝑙𝑖𝑧𝑒𝑑 𝑨𝑨𝒄𝒐𝒎𝒃𝒐 + 𝑁𝑜𝑟𝑚𝑎𝑙𝑖𝑧𝑒𝑑 𝑭 + 𝑁𝑜𝑟𝑚𝑎𝑙𝑖𝑧𝑒𝑑 𝑹𝑻)
𝑆𝑐𝑜𝑟𝑒 3 = 1
3(𝑁𝑜𝑟𝑚𝑎𝑙𝑖𝑧𝑒𝑑 𝑭 + 𝑁𝑜𝑟𝑚𝑎𝑙𝑖𝑧𝑒𝑑 𝑹𝑻 + 𝑁𝑜𝑟𝑚𝑎𝑙𝑖𝑧𝑒𝑑 𝑹𝑻𝒇𝒓𝒆𝒒)
𝑆𝑐𝑜𝑟𝑒 4 = 1
2 𝑁𝑜𝑟𝑚𝑎𝑙𝑖𝑧𝑒𝑑 𝑭 + 𝑁𝑜𝑟𝑚𝑎𝑙𝑖𝑧𝑒𝑑 𝑹𝑻
The rankings resulting from each of scores will also be evaluated according to the manually assembled list of influential users. Results. For each of the four scores, the precision at 10, 20, 30, 40 and 50 are calculated and plotted in Figure 2. Figure 2 shows that Score 3 and Score 4 have the higher precision.
Discussion. The top 10 rankings produced the best precision values. The score combining the average retweets count (RT), followers count (F) and the average retweets frequency (RTfreq) produced a precision at 10 of 0.8, and when just the average retweets count (RT) and the followers count (F) are combined, it produced a precision at 10 of 0.9. This consolidates that influential users are recognized by many and that their posts resonate with other users and spread rapidly throughout the network.
0.1 0.4
0.7
0.3 0.2
0.6
0.2 0.4
0 0.1 0.2 0.3 0.4 0.5 0.6 0.7 0.8
1 2 3 4 5 6 7 8
Pre
cis
ion
Feature
Fig 2: Precision plotted for each of the top groups ranked according to the scores
4.4
Ranking Users: according to their
appearance frequency when ranked by the
features
In this experiment the hypothesis that the traits reflected by the selected features may lead us to the influential users is investigated.
Data Description. The same 1221 users from the tweets collection used in the experiment in section 4.2.
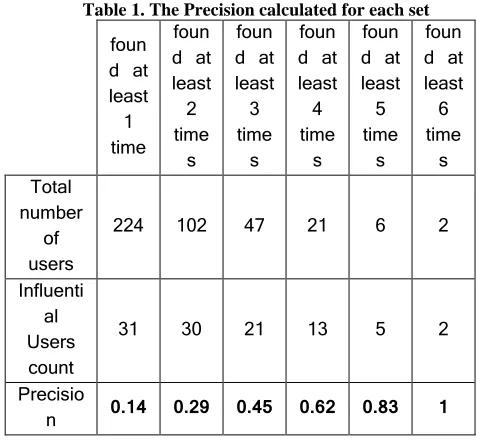
Method. Each of the features selected as a result of the experiment in section 4.2 reflects a trait presumed to be exhibited by influential users. The users are ranked according to each of the eight features, and the top 50 users of each ranked list are considered. Each user is then ranked according to their appearance frequency in these lists. The users found in the lists at least once, then at least two times, three times, four times, five times and six times are studied. The precision of the rankings will be calculated in reference to the manually assembled list of influential users.
Results. The users are sorted in descending order by their appearance frequency. The precision values are calculated for each top set as can be seen in Table 1.
Discussion. The influential users’ precision improved with the increase of the appearance frequency threshold. So if each of the features reflects a trait, then the more the traits a user exhibits the more likely they are influential.
Table 1. The Precision calculated for each set
foun d at least 1 time
foun d at least 2 time s
foun d at least 3 time s
foun d at least 4 time s
foun d at least 5 time s
foun d at least 6 time s Total
number of users
224 102 47 21 6 2
Influenti al Users count
31 30 21 13 5 2
Precisio
n 0.14 0.29 0.45 0.62 0.83 1
4.5
Ranking Model Verification
In this experiment the effectiveness of the different ranking methods are verified and their performance compared.
Data Description. In February and March of 2014, twenty of the local Egyptian trending topics on Google Trends and Twitter Trends were queried for this experiment. Each query retrieved over 1500 tweets with over 1000 unique users per query.
Method. The best resulting ranking methods from sections 4.2, 4.3 and 4.4 are tested on the new queries. Each of the collections queried were ranked according the followers count, the average retweets count, Score 3 and Score 4, and the users’ appearance frequency. The top users of each are manually evaluated and their precision calculated.
Results. Table 2 is a summary of the precision values in this experiment. Each column represents one of the ranking methods, and each row represents a query. For each ranking carried out on each query, the number of influential users found is measured and the precision calsulated. For the rankings according to Followers count, Average Retweets, scores 3 and 4, the precision at 10 is calculated. As for the other two rankings, the focus is on the users who appeared at least 5 or 6 times regardless of their count. In case none of the users were found at least 6 times, back-off to the users found at least 5 times. In the last row the average precision obtained by each of the ranking methods is calculated.
Discussion. It should be noted that in the cases of Queries 10 and 17 none of the users found at least 6 times turned out to be influential, which resulted in the precision value of influential users to be zero. On the other hand, in case no users were found at least 6 times, such as with Queries 8, 12, 13, 14 and 15, back-off to the users found at least 5 times took place. Each of the ranking methods was able to detect a set of influential users, however, their influential users’ precisions varied from one query to another. As may be seen in Table 2, the highest precision mean obtained is 0.68 for the set of users found at least 6 times.
5.
CONCLUSION
In order to produce calculable measures with the labor intensive manual evaluation approach, the users' tweets and profile pages were studied, and a set of relevant influential users were objectively decided upon, according to which precision values were calculated. Having settled on a set of eight independent features, they were used to develop the model that would detect the influential users. Having ranked the users according to each of the selected features, it was found that the Followers count, Average Retweets count, Average Retweet Frequency, and the Age Activity combination features were the best at ranking the influential users. Two ranking methods were then developed. In the first method, these four features were used as parameters in equations that would assign scores to each of the users. This method was able to obtain high precision at 10 values of up to 0.8 and 0.9 for the equations of Score 3 and Score 4. The second took advantage of the users’ rankings according to each of the eights selected features independently. The users were ranked according to their appearance frequency in the lists. The best results were in the set of users found at least 5 times and at least 6 times in the top 50 users lists ranked according to each of the eight selected features; with the highest precision values of 0.83 and 1.0 0.8
0.57
0.4 0.9
0.6
0.5 0.475
0 0.2 0.4 0.6 0.8 1
10 20 30 40 50
Pre
cis
ion
[image:4.612.46.285.501.721.2]respectively. The best of the ranking methods were then conducted on 20 queries to verify their effectiveness and compare their performance. The set of users found at least 6 times (in the top 50 ranked according to each of the eight selected features) was found to have the most consistent outcome and the highest precision mean of 0.68.
The contribution of this study can be summarized into highlighting the features that help detect influential users and
[image:5.612.66.555.184.619.2]proposing two methods for identifying the influential users. Future work investigation would include exploring data regularization technologies to handle the issue of correlated features and consider stage-wise technologies for feature selection. Also, investigate new features, including opinion polarity and study its effect on influence, and investigate considering NLP approaches on the tweets' text.
Table 2. The influential users count and the precision values in the experiment of section 4.5
Search Query
Followers count
Average
Retweets Score 3 Score 4
Users found at least 5 times
Users found at least 6 times
Infl
ue
ntial
U
se
rs
co
un
t
Precis
io
n
at
10
Infl
ue
ntial
U
se
rs
co
un
t
Precis
io
n
at
10
Infl
ue
ntial
U
se
rs
co
un
t
Precis
io
n
at
10
Infl
ue
ntial
U
se
rs
co
un
t
Precis
io
n
at
10
Infl
ue
ntial
U
se
rs
co
un
t
Precis
io
n
Infl
ue
ntial
U
se
rs
co
un
t
Precis
io
n
1 "يسيسنا" 10 1.0 8 0.8 8 0.8 10 1.0 4 0.8 2 0.67
2 "ريرحتنا ناديم" 6 0.6 7 0.7 7 0.7 7 0.7 9 0.75 2 1.0
3 "يدايلأا مهست" 2 0.2 3 0.3 2 0.2 1 0.1 4 0.4 2 1.0
4 "روصنم يندع" 6 0.6 5 0.5 7 0.7 6 0.6 9 0.53 1 0.33
5 نما تيريدم"ةرهاقنا" 3 0.3 6 0.6 5 0.5 6 0.6 6 0.3 2 0.5
6 "يسيسنا حيشرت" 4 0.4 6 0.6 6 0.6 5 0.5 6 0.5 3 0.75
7 "رصم" 8 0.8 7 0.7 9 0.9 5 0.5 11 0.92 3 1.0
8 "رياني 25" 6 0.6 7 0.7 5 0.5 8 0.8 2 0.67 2 0.671
9 "وينوي 30" 4 0.4 5 0.5 6 0.6 6 0.6 6 1.0 1 1.0
10 "نانع" 7 0.7 2 0.2 5 0.5 4 0.4 4 0.67 0 02
11 "يولاببلا" 8 0.8 7 0.7 7 0.7 8 0.8 8 0.8 1 1.0
12 "يسيسنا" 7 0.7 7 0.7 4 0.4 7 0.7 1 0.5 1 0.51
13 "فسوي مساب" 6 0.6 5 0.5 5 0.5 6 0.6 1 0.5 1 0.51
14 "نيرتاك تناس" 7 0.7 5 0.5 9 0.9 8 0.8 3 1.0 3 1.01
15 "نيرتاك تناس" 9 0.9 7 0.7 10 1.0 10 1.0 4 0.67 4 0.671
16 " اباط" 4 0.4 2 0.2 3 0.3 2 0.2 6 0.35 3 0.5
17 "بهحم" 6 0.6 5 0.5 6 0.6 6 0.6 4 0.36 0 02
18 "يسيسنا" 8 0.8 9 0.9 8 0.8 9 0.9 7 0.88 1 1.0
19 "بهحم" 6 0.6 6 0.6 4 0.4 7 0.7 5 0.7 2 1.0
20 ةدحو نوي"تينكسمم" 4 0.4 4 0.4 3 0.3 4 0.4 8 0.57 1 0.5
Precision means: 0.605 0.565 0.595 0.625 0.644 0.68
1 Back-off to 5 times is applied when no users are found 6 or more times.
6.
REFERENCES
[1] Agarwal, N., Liu, H., Tang, L. and Yu, P.S., 2008, February. Identifying the influential bloggers in a community. In Proceedings of the 2008 international conference on web search and data mining (pp. 207-218). ACM.
[2] Akritidis, L., Katsaros, D. and Bozanis, P., 2009, September. Identifying influential bloggers: Time does matter. In Proceedings of the 2009 IEEE/WIC/ACM International Joint Conference on Web Intelligence and Intelligent Agent Technology-Volume 01 (pp. 76-83). IEEE Computer Society.
[3] Akritidis, L., Katsaros, D. and Bozanis, P., 2011. Identifying the productive and influential bloggers in a community. IEEE Transactions on Systems, Man, and Cybernetics, Part C (Applications and Reviews), 41(5), pp.759-764.
[4] Zhou, H. and Zeng, D., 2009, June. Finding leaders from opinion networks. In Intelligence and Security Informatics, 2009. ISI'09. IEEE International Conference on (pp. 266-268). IEEE.
[5] Weng, J., Lim, E.P., Jiang, J. and He, Q., 2010, February. Twitterrank: finding topic-sensitive influential twitterers. In Proceedings of the third ACM international conference on Web search and data mining (pp. 261-270). ACM. [6] Yao, Y., Li, B. and Peng, L., 2015, October. Evaluating
User Influence Based on the Properties of User in Social Networks. In Computer and Information Technology; Ubiquitous Computing and Communications; Dependable, Autonomic and Secure Computing; Pervasive Intelligence and Computing (CIT/IUCC/DASC/PICOM), 2015 IEEE International Conference on (pp. 884-888). IEEE.
[7] Xiao, C., Xue, Y., Li, Z., Luo, X. and Qin, Z., 2015, December. Measuring User influence based on multiple metrics on YouTube. In Parallel Architectures, Algorithms and Programming (PAAP), 2015 Seventh International Symposium on (pp. 177-182). IEEE.
[8] Bakshy, E., Hofman, J.M., Mason, W.A. and Watts, D.J., 2011, February. Everyone's an influencer: quantifying influence on twitter. In Proceedings of the fourth ACM international conference on Web search and data mining (pp. 65-74). ACM.
[9] Romero, D.M., Galuba, W., Asur, S. and Huberman, B.A., 2011, September. Influence and passivity in social media. In Joint European Conference on Machine Learning and Knowledge Discovery in Databases (pp. 18-33). Springer Berlin Heidelberg.
[10]Bigonha, C., Cardoso, T.N., Moro, M.M., Almeida, V.A. and Gonçalves, M.A., 2010. Detecting evangelists and detractors on twitter. In Brazilian Symposium on Multimedia and the Web (pp. 107-114).
[11]Ya-ting, L. and Jing-min, C., 2011, April. The social network analysis of political blogs in people: Based on centrality. In Consumer Electronics, Communications and Networks (CECNet), 2011 International Conference on (pp. 5441-5444). IEEE.
[12] Chang, C.C. and Lin, C.J., 2011. LIBSVM: a library for support vector machines. ACM Transactions on Intelligent Systems and Technology (TIST), 2(3), p.27.