© 2019, IRJET | Impact Factor value: 7.34 | ISO 9001:2008 Certified Journal | Page 1513
Development of Needle Punched Non-woven Fabric for Water
Filteration
Atul J. Dhavale
1, Amit A. Patil
2, Rahul R. Joshi
3, Kshitija S. Balwan
41
Assistant Professor, Dept. of Textile Engineering, Textile and Engineering Institute, Ichalkaranji, MH,
India
2
Assistant Professor, Dept. of Mechanical Engineering, Textile and Engineering Institute, Ichalkaranji, MH, India
3
Assistant Professor, Dept. of Mechanical Engineering, Textile and Engineering Institute, Ichalkaranji, MH, India
4
Assistant Professor, Dept. of Civil Engineering, Textile and Engineering Institute, Ichalkaranji, MH, India
---***---Abstract - Textile filter fabrics are an important part of the domestics and industries life, contributing to healthy environment by product purity and efficiency. Filters save energy and production costs by suitable selection of the filter for specific application.
The pore structure, Air Permeability, Bursting Strength and Porosity of filters play a major role in getting quality output. Optimum utilization of filters can significantly reduce the cost of filters replacement frequently and keep the filters in used for longer time, this can be done by knowing the actual working condition (i.e. flow rate and differential pressure) of the filters and select best filters which suits for that condition.
An experiment was conducted to assess the filtration performance of Needle Punched Nonwoven fabric, which has 200GSM for the application of commercial water filter. Water filtration performance of 200 GSM Needle Punched Nonwoven Fabric made from Polyester and Polypropylene with 3Denier, 6Denier with proportion of 25% each shown improvement in water quality parameters within the permissible limit.
Key Words: Size of particles, pore size, flow rate, filtration efficiency.
1. INTRODUCTION
Water is a transparent, tasteless, odorless, and nearly colorless chemical substance that is the main constituent of Earth‟s streams, lakes, and oceans, and the fluids of most living organisms. Its chemical formula is H2O meaning that each of its molecules contains one oxygen and two hydrogen atoms that are connected by covalent bonds. Strictly speaking, water refers to the liquid state of a substance that prevails at standard ambient temperature and pressure; but it often refers also to its solid state (ice) or its gaseous state (steam or water vapor). It also occurs in nature as snow, glaciers, icepacks and icebergs, clouds, fog, dew, and atmospheric humidity.
Water covers 71% of the Earth surface, approximately 97.2% of it is saline, just 2.8% fresh. It is vital for all known forms of life. On Earth, 96.5% of the planet's crust water is found in seas and oceans, 1.7% in groundwater, 1.7% in
glaciers and the ice caps of Antarctica and Greenland, a small fraction in other large water bodies, and 0.001% in the air as vapor, clouds (formed of ice and liquid water suspended in air), and precipitation. Less than 0.3% of freshwater is in rivers, lakes, and the atmosphere, and an even smaller amount of the Earth's freshwater (0.003%) is contained within biological bodies and manufactured products. A greater quantity of water is found in the earth's interior.
1.1 Literature Review
In the last 20 years the European Community has introduced more than 100 legal regulations in the area of environmental protection, the majority of which are directed towards the control of environmental pollution. It is therefore, an importance that industry and domestic household should look to filtration technologies to get healthier and clean products and environment.
Filtration plays an important role in our daily life by providing clean products and healthy environment. Filtration is the separation of gas or liquid by pass through a permeable medium. Textile material are generally used in the filtration of solid-gas and solid-liquid, this is because textile materials act as a three-dimension network of fibers enclosing small pocket of void volume. Due to their structure, textile fabrics have high filtration efficiencies. [1, 2] Textile materials do not resist the flow 1 Methods of filtrations:-
There are many methods of filtration. Some form of the interrelated between the substances to be removed and filtrate achieves the separation. As we all know there are three states of matter solid, liquid, and gaseous. When these three matters combine with each other they have to be separated using a proper filtering media.
The different methods are:-
Solid-solid filtration:
© 2019, IRJET | Impact Factor value: 7.34 | ISO 9001:2008 Certified Journal | Page 1514
Solid-liquid filtration:
When solid to liquid filtration is carried out the solid particles may be dissolved or in form of suspension, these solid particles are to be separated this is done by interposing a filtering media between them. E.g. separating tea powder from boiled tea.
Solid-gas filtration:
In this method, solid particles are separated from the gas by interposing a filtering media between them. E.g. Air conditioning filters and air filters used in vacuum cleaner etc.
Liquid-liquid filtration:
In this method, two different types of fluids are separated with the help of their molecular weight. To achieve this filtration a filtering media is manufacture through which a liquid is passed and separated in to two different liquid is achieve. E.g. Fuels filter which separate diesel and water.
Liquid-gas filtration:
In this method, highly dense nylon fabric is used because nylon is having a very high tenacity and it is stable to many chemicals. In this method gas saturated with liquid is passed through a filtering media, the filtering media arrest the liquid molecules and allow only gas to move forward. Thus, the separation of liquid and gas takes place. E.g. Central modification plant used in textile industry were dry air is sucked from the atmosphere with the help of fans then it is saturated with water and finally passed through a dense nylon fabric. The nylon fabric arrests the water molecules and saturated air reaches the department.
Types of filter media:
Detail of various filter media, summarized in table 5.1, to understand the effectiveness and limitations of different filter media.
Advantage of non-woven filter media compared to woven:
Following are the advantages:
1. High permeability.
2. Higher filtration efficiency.
3. Less blinding tendency.
4. No yarn slippage in the case of woven media.
5. Good cake discharge.
Degree of filtration:
Once the size of the contamination to be removed has been determined, it is possible to choose a filter with the particle
removal characteristics needed to do the job. Choosing a filter with a pore size finer than required can be a costly mistake. Finer the filtration, more rapid is the clogging and higher the cost. Filter selected must be able to retain particles removed from the subjected fluid, because as the pressure increases the pore size can be increases, which leads to unloading of the particles. But if filter made of unchangeable structure even at high pressure it will leads to a high stress develop in the filter which leads to damage of the filter. Proper filters must be select for a particular application with a known contamination size or types of contamination must be check before use.
Application of textiles in filtration:
Filters are mostly used as dry and liquid application:
Liquid application:
a)Particle concentration below 10% the liquid is pumped through a filter fabric that has small pores, a filter aid is used to prevent the blockage of small pores in the fabric.
b)When particle concentration is more than 10% it is called as slurry, rotary vacuum drum filters are used for filtration application. Filter presses are used in discontinuous filtration process. Polypropylene woven fabric is used for rotary filters and filter presses where abrasion is critical.
c)In some application woven, stitch-bonded or spun-bonded backing are used, for high temperature application the fibrous web are heat- shrunk.
d)Smooth surface is necessary for easy removal of the slug and cake. Polypropylene fibers offer good chemical resistance, durability, low moisture adsorption and a hydrophobic surface which improved the cake removal.
e) In sewage treatment plants, belt filter presses, drum, plate or belt filters have been used to dewater sewage sludge. Recently, needle-punch fabrics are being used instead of woven fabrics in these applications.
Filtration testing for air filters:
ASHRAE stand for American Society of Heating, Refrigeration, and Air- Conditioning Engineers, gives a standard for testing the filters to be applied in a particular application like Heating, Ventilator, and Air-Conditioning (HVAC).
Standard 52.1-1992 provides three important evaluation criteria:
• Dust spot efficiency:
© 2019, IRJET | Impact Factor value: 7.34 | ISO 9001:2008 Certified Journal | Page 1515
The ratio is converting to efficiency that is expressed in percentage. High dust efficiency results in a high resistance to straining.
• Arrestance:
Arrestance is a gravimetric measure of the ability of a tested filter to remove ASHRAE synthetic dust from the test air. The number is also expressed as percentage.
• Dust holding capacity:
Dust holding capacity is determined by the product of the quantity of synthetic test dust fed to the test filter, expressed in grams and its average arrestance. The dust spot test is run alternatively with the arrestance test.
Standard 52.2-1999 evaluating a filter based upon improving indoor air.
[image:3.595.69.256.451.667.2]Previous standard provide value based upon the average performance of a filter, this new standard give information about how efficient is a filter when it is first installed in a system (lowest point). An additional goal is to give a single value by which is to select an air filter. The value is prescribed in the standard as a MERV, or minimum efficiency reporting value. The filters are test under standard air quality including humidity and temperature
Table 1.1 The standard provides a filter‟s initial efficiency in each 12 different particle ranges
Range Lower limit
(microns) Upper limit (microns)
1 0.30 0.40
2 0.40 0.55
3 0.55 0.70
4 0.70 1.00
5 1.00 1.30
6 1.30 1.60
7 1.60 2.20
8 2.20 3.00
9 3.00 4.00
10 4.00 5.50
11 5.50 7.00
12 7.00 10.00
1.2 Plan of Work
Details of Process
Nonwoven sample were produced with needle punch nonwoven fabric on Trutzschler nonwoven machine. In nonwoven needle punching machine five samples with different GSM were produced .In this nonwoven technology,
process line is same up to cross laying machine. In this manufacturing process fiber web divided after cross lapper machine, i.e. one side needle punch machine fabric. The flow diagram of the manufacturing process is shown in fig.3.1. Then we tested samples for finding out suitability for filter application. After that we had selected some samples and made filter to find out its performance as a filter.
Raw Material
The polypropylene fiber 6D (100 %) for needle punch fabric and polyester (100%) for needle punch fabric.
Methodology
The 100 % polysters fibres and polypropylene were used for manufacturing the needle punch nonwoven fabric. Needlepunch nonwoven fabric is manufactured by using three basic process carding, web formation and web bonding. Needle punch nonwoven fabric is manufactured in Trutzschler nonwoven machine .The needle punch fabric was manufactured of 200 GSM.
Fiber testing
Denier
The fiber denier calculated by using micron value. The micron value determines by using microscope to get a diameter of the fiber in micron. The microscope is shown in
Fiber Length
As per ASTM, D 3822 determine the fiber length using grease plate methods.
Strength
Tensile strain at break % of Fibers: The preparation of the specimen was carried out according to ASTMC-1557, Tensile tests were performed on Intron tensile tester 5500R with a gauge length of 25mm.
Fabric Testing
GSM
The nonwoven fabric GSM, calculated as per ASTM 6242 standards, i.e. mass per unit area (areal density in grams per square meter).The specimen of the size 10X 10 cm was cut randomly from different places and weighted in electronic balance with an accuracy of 0.001 g and an average of 5 readings was taken.
Thickness
© 2019, IRJET | Impact Factor value: 7.34 | ISO 9001:2008 Certified Journal | Page 1516
Air Permeability
The air permeability of nonwoven fabric was tested as per ASTM D737-04 test method. The air permeability was tested using TEXTEST FX3300 air permeability tester (fig.3.6). The applied pressure was selected at 125 Pa and an area was 38 cm2.Air permeability of a fabric is the volume of air measured in cubic centimeters passed per second through 1cm2 of the fabric at a pressure of 1cm of water.
Pore Size
The pore size test carried out as per ASTM E 1294 Test method by using capillary flow pyrometer (PMI) (fig. 3.7). For evaluation of pore size in nonwoven fabric we are using the liquid extrusion technique. In this technique, wetting liquid water (surface tension 72 dynes/cm2) fills the pores of the sample and pressurized gas pressure removes the liquid from the pores. There are find out differential gas pressure and flow rates through dry and wet samples were measured to calculate pore diameters.
Porosity
The find out the porosity as one example, the thickness of a polyester fiber web having a surface of 1m2 and a weight of 280 g/m2 was determined at a number of points and the average thickness, calculated as 2.2 mm. The volume of the fiber web is thus 0.22 cm x 10,000 cm2 = 2200 cm3 giving a density of 280/2,200 = 0.1272 g/cm3. The density of polyester fiber is 1.38 g/cm3. The relative density of the web is thus 0.1272/1.38= 0.0921. The porosity of the web corresponds to 1- i.e. 0.9079 [28].
Water quality testing
To find the water quality parameters we have tested the water before filtration and after one first water passed through the selected fabric samples. Then the water tested from Nikhil analytical and research lab. We determine and distinguish water quality based on parameters like chemical oxygen demand, dissolved oxygen, residual free chlorine.
2. Result and Discussion
Fiber Testing:
[image:4.595.333.515.132.296.2]Needle punched fabric were made by using 3 and 6 denier polyester and 3 and 6 denier polypropylene fibre with combinations mentioned in the material preparation. Table 4.1 shows properties of fibre used.
Table 2.1 Properties of fibre
Sr no. Parameters 3 denier 6 denier 1 Diameter [PET] 17.21 24.9 2 Diameter [PP] 21.9 30.9 3 Staple length [PET] 6.83 8.98 4 Staple length [PP] 4.77 7.53
Fabric testing:
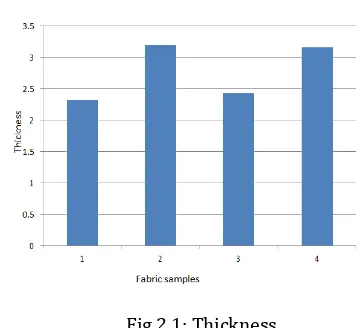
Thickness:
Fig 2.1: Thickness
Calculated „t‟ value for fabric thickness between 100% polypropylene 3 denier and 100% polypropylene 6 denier was 0.000416383 This value is less than tabulated value (0.05,3) =2.776, so we observe that there is significant difference in fabric thickness made from above fabric.
Similar trend was observed in fabric thickness made from 100% polyester 6denier and 100 % polypropylene 6 denier,100% polypropylene 6denier and 100% polypropylene 6denier +3 denier, 100% polypropylene 6 denier and mixture of
100% polyester 6denier, 100% polypropylene 6denier, 100% polypropylene 3denier100% polyester 3denier.
So we can say that fabric thickness is affected by fiber, fiber denier , % of fiber and mixing of denier.
Air permeability:
[image:4.595.43.545.526.798.2]© 2019, IRJET | Impact Factor value: 7.34 | ISO 9001:2008 Certified Journal | Page 1517
Calculated „t‟ value for fabric Air permeability between 100% polyester 6 denier and 100% polypropylene 6 denier was 0.000983378. This value is less than tabulated value (0.05, 29) =2.045, so we observe that there is significant difference in air permeability made from above fabric.
Similar trend was observed in air permeability made from 100% polyester 6denier and 100 % polypropylene 6 denier,100% polypropylene 6denier and 100% polypropylene 6denier +3 denier,100% polypropylene 3 denier and polypropylene 6 denier 100% polypropylene 6 denier and mixture of 100% polyester 6denier, 100% polypropylene 6denier, 100% polypropylene 3denier100% polyester 3denier.
So we can say that Air permeability is affected by fiber, fiber denier, fibre density and pore size.
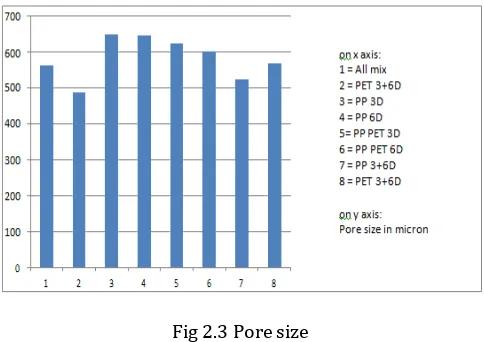
[image:5.595.41.283.323.494.2]Pore size:
Fig 2.3 Pore size
Calculated„t‟ value for fabric pore size between 100% polyester 6 denier and 100% polyester 6 denier was 0.473663185. This value is less than tabulated value (0.05,2)
=4.3, so we observe that there is significant difference in fabric pore size made from above fabric.
Similar trend was observed in pore size made from polypropylene, polyester 3denier
+ 6denier each and polyester 3denier+6denier,polypropylene 3denier+6denier and polyester 3denier+6denier, mixture of 100% polyester 6denier, 100% polypropylene 6denier, 100% polypropylene 3denier100% polyester 3denier. So we can say that pore size is affected by fiber denier and fiber density.
Filtration performance of fabric
Based on above fabric properties like Fabric thickness, Air permeability and Pore size we selected 200 GSM Needle Punched Nonwoven Fabric made from Polyester and Polypropylene with 3Denier, 6Denier with proportion of 25% each for water filter making.
The water filtration performance of the fabric was determined based on the following parameters.
1. Chemical oxygen demand
2. Dissolved oxygen
3. Residual free chlorine
Table2.2 water quality parameters
Before After
C.O.D D.O R.F.C C.O.D D.O R.F.C 48 4.9 0.74 35 5.2 0.4 48 4.9 0.75 36 5.3 0.5 49 5 0.75 37 5.4 0.6
These are some of the solid contents in water based on which the comparison is made on the water quality before and after its filtration. That the filtration performance of Needle Punched Nonwoven Fabric made from Polyester and Polypropylene with 3Denier, 6Denier with proportion of 25% each shown highest water filtration, because of finer pore size, more thickness, less air permeability compared to other fabrics.
For above results we have applied T-test for checking significance difference, Calculated „t‟ value for C.O.D of before after filtered water which was observed to be 0.000346 This value is less than tabulated value (0.05,3) =2.776, so we observe that there is significant difference in C.O.D value of the water.
Similar trend is observed in case of Dissolved Oxygen value where the calculated T value is 0.004082 This value is less than tabulated value (0.05,3) =2.776, and same is for Residual free chlorine value where the calculated T value is 0.004977 which value is also less than tabulated value (0.05,3) =2.776. So we conclude that there was significant difference in C.O.D, D.O, residual free chlorine value of the water.
Chemical oxygen demand and residual free chlorine reduces while dissolved oxygen increases.
3. CONCLUSIONS
An experiment was conducted to assess the filtration performance of Needle Punched Nonwoven fabric, which has 200GSM for the application of commercial water filter. From above experiment following conclusions were drawn.
© 2019, IRJET | Impact Factor value: 7.34 | ISO 9001:2008 Certified Journal | Page 1518
2. Air permeability of needle punched nonwoven Fabric was significantly affected by fiber density and denier of fiber. Fiber with higher density and higher denier had shown high air permeability.
3. Pore size of needle punched nonwoven Fabric was significantly affected by fiber density and denier of fiber. Fabric made from Polyester and Polypropylene with 3Denier, 6Denier with proportion of 25% each shown finer pore size.
4. From above experiment we found that water filtration performance of 200 GSM Needle Punched Nonwoven Fabric made from Polyester and Polypropylene with 3Denier, 6Denier with proportion of 25% each shown improvement in water quality parameters within the permissible limit.
REFERENCES
1.Edwin Hardman, et al “Some aspects of the design of filter fabrics for use in solid/liquid separation processes”, IJFTR, Vol 22, Dec 1997, PP 297-304.
2. Prof U J Patil et al, “Non-woven and technical textiles filtration in textile”,
Indian Textile Journal, May 2011
3. J.A. Fernando et al, “Pore structure and permeability of an alumina fiber filter membrane for hot gas filtration”, Journal of porous materials, vol 9, PP 211- 219, 2002.
4. Braz.J.Chem, et al “A study of the porosity gas filtration cakes”, Brazilian journal of chemical engineering, vol. 26, April 2010, PP 1-10.
5. C.A.Lawrence et al, “Relation of structure, properties and performance of fibrous media for gas filtration”, Chemical Engineering Technology, vol. 29, 2006, PP 957-967.
6. W.Peukert et al, “Industrial separation of fine particles with difficult dust properties”, Power technology, Vol. 118, 2001, PP 136-148.
7. Edward W. Samson et al, “Method of and means for separating solid particles inpulp suspension and the like”, United states paptent office 2377524, Nov 21 1939.
8. Josef Chaes, et al, “Method and apparatus for demisting gases”, United States Patent, 13 March 1979.
9. Andrew Falconer et al, “Gravity separation: oil technique/new methods”, Physical separation in science and engineering, vol. 12, 2003, PP 31-48.
10. D A N Dharmasena et al, “Fabrication, testing and evaluation of a dust filtration system for small scale spice grinding mills”, The Journal of Agricultural Sciences, Vol 1 (2), July 2005, PP 49-58.