Automatic Severity Level Classification of Diabetic
Retinopathy
Jissmol James
College of Science and
Engineering,
University of Houston, Clear Lake
Houston, USA
Ershad Sharifahmadian
College of Science and
Engineering,
University of Houston, Clear Lake
Houston, USA
Liwen Shih
College of Science and
Engineering,
University of Houston, Clear Lake
Houston, USA
ABSTRACT
Diabetic Retinopathy (DR) is a major cause of blindness, when a disease strikes the retina due to diabetes. Early detection of retinopathy can rescue patients from vision loss. Therefore, in this paper we propose an automatic severity level assessment of the diabetic retinopathy using innovative image processing techniques combined with a multi-layered artificial neural network model for classification of retina images. The color retina images are collected from the standard DIARECTDB1 and MESSIDOR datasets. The collected data includes the images of normal eyes, as well as the images of mild, moderate and severe cases of Non-Proliferative Diabetic Retinopathy (NPDR). First, the lesions on the retina especially blood vessels, hemorrhages, exudates and microaneurysms are extracted from the image data. Then, the features, including the area of the segmented blood vessel and hemorrhages, the area of the segmented exudates, the number of microaneurysms in the segmented image, mean and standard deviation of segmented lesions, are extracted to measure the severity level of the disease. Based on our results, the proposed system obtains the accuracy of more than 93% which is higher than the accuracy of popular DR classification methods.
General Terms
Artificial Neural Network; Image Processing.
Keywords
Computer-aided diagnosis; Diabetic retinopathy; Blood vessels; Exudates; Hemorrhages; Microaneurysms.
1.
INTRODUCTION
Diabetic Retinopathy (DR) is the retinal bruise which affects the diabetic patients. In United States, it is the number one cause of visual blindness in people at the age of 20 to 64. As indicated by the world health organization [1], over 75% of individuals who have diabetes for over 20 years will have at least one type of DR. High blood sugar level damages retinal vessels causing DR. Being silent in early stages of the disease, many diabetic patients are not aware of their condition until it affects their vision. In the advanced stages of the diabetic retinopathy, however, patients may experience symptoms such as floaters, blurred vision, distortion, etc. Therefore, regular screening of the retina is crucial to control and prevent the progress of disease.
There are two fundamental phases of DR: NPDR and Proliferative DR (PDR) as shown in Figure 1. The symptoms found in DR are microaneurysms, dot, and blot hemorrhages, flame-shaped hemorrhages, retinal edema and hard exudates, cotton-wool spots, venous loops and
beading, intraretinal microvascular abnormalities and macular edema.
[image:1.595.369.499.486.574.2]MicroAneurysms (MAs) are the earliest symptom of DR. They appear in the superficial retinal layers as very small red dots. These small dots increase as the disease progresses. Dot and blot hemorrhages occur inside the deeper layers of the retina. If they seem very small, then they look similar to MAs. Flame-shaped hemorrhages are the splinter hemorrhages that show up in more superficial nerve fiber layer. Due to the breakage of the barrier between the blood and retina, retinal edema and hard exudates are formed. Serum proteins, lipids, and proteins are leaked from the vessels. Exudates are irregularly shaped, and usually seem yellow in color on the retina. Cotton-wool spots are bordered by vascular hyperpermeability and microaneurysms. Venous loops and beading frequently occur near to the area of nonperfusion. Their occurrence is the most significant indication of the PDR progress. Intraretinal microvascular abnormalities are usually found on the borders of the nonperfused retina. They are the remodeled capillary beds without the proliferative changes. Macular edema is one of the leading causes of blindness.
Figure 1: Retinal images with NPDR and PDR [2] The ophthalmologists can detect DR during the dilated eye exam but it normally leads to much cost and time for patients. The automatic DR detection can help ophthalmologists to perform objective, accurate, reliable and fast DR detection.
2.
RELATED WORK
perimeter of blood vessel and hemorrhages. They reported 90% accuracy for normal cases while moderate and severe NDPR cases were 87.5% accurate. Saifuddin introduced a novel method to detect exudates [5], where the lesions detected using morphological operations, then exudates and non-exudates were classified. Sargunar used morphological techniques to detect exudates and blood vessels [6]. Sargunar classified the severity of DR based on perimeter, area, and hurst coefficients with reported accuracy of 85%. Mahendran, et al detected exudates using morphological processing and gray level matric of the extracted exudates [7]. Shahih et al. presented a system to detect exudates, blood vessels, microaneurysms [8]. For classification, they calculated the entropy and homogeneity with reported accuracy over 92%. Deepthi K Prasad and Vibha classified the retinal images as diabetic or nondiabetic by detecting blood vessels, exudates and microaneurysms [9]. As stated in [5], [6] and [7], only exudates and blood vessel were considered for DR detection, and for classification, only two classes were considered; normal and DR. In [4] only extracted features from blood vessel and hemorrhages were used. They did not take into account microaneurysms and exudates. Therefore, the mild, moderate and severe stages of DR can not be accurately detected. In [9], blood vessels and exudates were detected and classified roughly into diabetic or nondiabetic images.
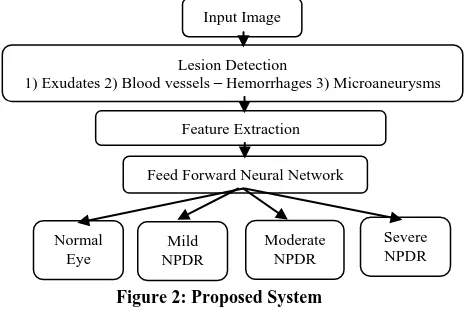
[image:2.595.75.307.483.643.2]In our proposed method, blood vessels and the three main symptoms including microaneurysms, hemorrhages and exudates are detected using morphological operations and histogram matching. Extracted features are as follows: (i) area of segmented blood vessel and hemorrhages, (ii) area of segmented exudates, (iii) count of segmented microaneurysms, (iv) mean and standard deviation of segmented blood vessel-hemorrhages, (v) mean and standard deviation of segmented exudates. Using these features, classification is done by applying a neural network model.
Figure 2: Proposed System
3.
METHODOLOGY
Figure 2 shows the block diagram of the proposed method.
3.1 Input Images
The images are initially resized into a standard size of 500x700 before detecting lesions. Image preprocessing techniques, including smoothing, converting to gray scale and removing noises, are performed.
3.2 Lesion Detection
A lesion clinically means any abnormal change in organ or tissue as a result of the disease.
3.2.1 Detection of Exudates
Exudates are the visible lesions caused by DR. These are identified by their size and shape, and are typically bright, shiny or yellow in color. Exudates are one of main reasons for blindness. However, due to similarity between the contrast of the Optic Disk (OD) and contrast of exudates, detection of exudates is difficult. Therefore, OD should be removed by image preprocessing.
The original image is an RGB image. The green channel of the input image is extracted by applying equation (1). Green channel is extracted as it gives more information compared to red and blue.
g = G
R+G+B (1) Where R, G and B are Red, Green and Blue respectively and g is the output green channel.
The contrast of the extracted green channel is improved by Contrast-Limited Adaptive Histogram Equalization (CLAHE) to increase the intensity of the pixels.. The image is then exposed to logarithm function with various bases to emphasize the exudates as given in the equation (2), 255 ) , Im( 200 log 200 ) , Im( 150 log 150 ) , Im( 50 log 50 ) , Im( 0 log ) , Im( )) , Im( 1 ( 1 )) , Im( 1 ( 2 )) , Im( 1 ( 4 )) , Im( 1 ( 5 y x if y x if y x if y x if y x y x y x y x y x (2)
Where Im(x,y) represents gray level intensity pixel value. Afterwards, the image is binarized by marking background as black and detected region as white. At this step, the detected regions (i.e. exudates and optic disk) are seen as white, and the rest are seen as black. To remove noise, a 2D median filter is applied.
Next, morphological erosion is applied on the binarized image with a structuring element 10 by 10 to get the point of location of optic disk. The image is labeled. Then, the largest and brightest region in the image is selected. Morphological dilation is applied on the obtained image with the size of the optic disk. Then, the obtained image is marked over the green channel image. The green channel image is reconstructed based on the markings. The marked green channel image is subtracted from the initial green channel image. Afterwards, the resulted image is binarized with the threshold set to 0 to detect optic disk. To remove noise, a median filter is used by equation (4). Morphological dilation is then applied on the image with a structuring element in the size of an optic disk. Therefore, optic disk is detected.
(a) (b) (c)
(d)
Input Image Lesion Detection
1) Exudates 2) Blood vessels – Hemorrhages 3) Microaneurysms Feature Extraction
Feed Forward Neural Network
(e) (f) (g)
(h)
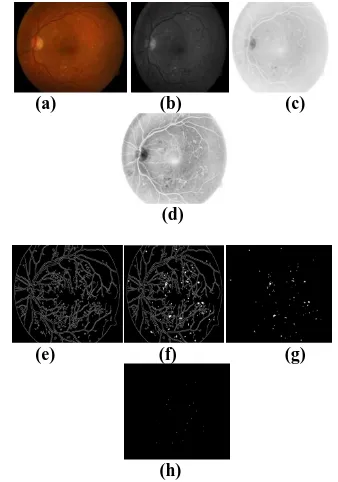
[image:3.595.97.272.71.275.2](i) (j) (k) Figure 3: Detection of Exudates (a) Original fundus image; (b) Green channel image; (c) CLAHE of the Green channel; (d) Binarized image; (e) Image d after
Erosion; (f) Image e after Dilation; (g) Marking the image f on b; (h) Marked Green channel image; (i)
Binarized image; (j) Image i after dilation; (k) Subtracting image j from d.
The detected optic disk is subtracted from the detected regions contains exudates and optic disk. In this way, the exudates are detected. The process of detecting exudates is shown in figure 3.
3.2.2 Detection of Blood vessels and
Hemorrhages
Most parts of retina include blood vessels. The green plane is selected using equation (1).
To better detect the blood vessels and hemorrhages in the retina image, the complement function is used. Then, green plane is inverted by the complement function as equation 3,
C(i)=255-g(i) (3)
Where g(i) is the input pixel values of the green channel image and C(i) is the output pixel value of the complement function.The contrast of the inverted image is improved by applying CLAHE to increase the intensity of pixels.
Next, morphological operations are used to highlight the blood vessels and hemorrhages of the retina image.
A
°B = (A
B)
B (4)Where A is the retina image improved by CLAHE, B is the structuring element with the size of 8, A ° B is the opening operation. After applying opening on the image, the result is subtracted from the adaptive-histogram image. To remove noise, a 2D median filter is used.
To extract blood vessels and hemorrhages, we need to remove background. To do that, opening function is used to obtain the background of the image with the disk-shaped structuring element of size 15 by 15. Then, the given background is subtracted from the filtered image to get only blood vessels and hemorrhages. Next, the image intensity is adjusted, and the image is binarized. Figure 4 illustrates the detection process of blood vessels and hemorrhages.
(a) (b) (c) (d)
(e) (f) (g) (h)
(i) (j) (k)
Figure 4: Detection of blood vessel and hemorrhages (a) Original image; (b) Green channel image; (c) Complement image; (d) CLAHE of the image c; (e) Morphological operation; (f) Subtracting image e from d; (g) Median filtered image; (h) Background image; (i)
Subtracting background image from image g; (j) Contrast adjusted image; (k) Binarized image with
threshold T.
3.2.3 Detection of Microaneurysms
The contrast, color and illumination inside the fundus images are important factors to detect MicroAneurysms (MAs). MAs look like small balloon in the retina's blood vessels. Each MA has the diameter of λ < 125μm approximately. MAs are detected using the green channel. Then, the intensity of the green channel image is inversed.
(a) (b) (c)
(d)
(e) (f) (g)
[image:3.595.332.542.72.258.2]
(h)
Figure 5: Detection of microaneurysms (a) Original Input Image; (b) Green channel image; (c) Complemented image; (d) CLAHE of the image c; (e) Canny edge detected image; (f) Image with filled holes;
(g) Subtracting the image e from f; (h) The resulted image contains MAs with the specified area.
[image:3.595.349.518.419.660.2]suppressed with the edge detection at the same time. The canny technique discovers edges using edge function where the derivative of a Gaussian filter is used to calculate the gradient.
Then, holes in the image are filled to detect the appeared lesions. Next, the edge detected image is subtracted from the holes filled image, and the image without the boundary is obtained. The area of MAs can be identified in pixel range of 6 to 9 in the image, where the size of image is 500×700. Figure 5 illustrates the process for the detection of microaneurysms.
3.3 Feature Extraction
The next step after lesions detection is feature extraction. To extract features, the area of the blood vessels and hemorrhages, exudates and number of MAs in the image are calculated. To count MAs, the connected components are labeled, then, the labeled components are counted. Furthermore, mean and standard deviation of the segmented areas in the image are calculated.
[image:4.595.74.303.418.528.2]As mentioned before, there are two types of DR: NPDR and PDR. NPDR can be classified into i) Mild: indicated by the presence of at least 1 microaneurysm; ii) Moderate: includes the presence of hemorrhages, microaneurysms, and exudates; iii) Severe: characterized by hemorrhages and microaneurysms in 4 quadrants, with venous beading in at least 2 quadrants and intraretinal microvascular abnormalities in at least 1 quadrant [11]. Based on the center of health, the clinical guidelines, the severity of DR are listed in the fig 6 [11]. In fact, the proposed method classifies retina images into four categories: L1, L2, L3, and L4.
Table 1: Clinical Criteria to identify the Severity of DR Levels
L1-Sever
e NPD
R
L2-Moderate
NPDR
L3-Mild NPDR
L4-Normal
eye
Microaneurys ms
High Low Low None
Exudates High Low None None
Hemorrhages High Low None None
In PDR stage, all past symptoms along with abnormal vessels can be found near or on the optic disk.
3.4 Backpropagation NN Classification
After feature extraction, a multi-layered feed forward Neural Network (NN) is utilized for classifying the DR severity.
The extracted features are the area of blood vessels and hemorrhages, the area of the exudates, the number of MAs, mean of the segmented blood vessels and hemorrhages, mean of the exudates, standard deviation of the segmented blood vessels and hemorrhages, as well as standard deviation of the segmented exudates from the retinal images. The gold standard of DR severity level of these images hand-classified by ophthalmologists, is used to test efficiency of the proposed automated method to classify the severity of DR.
The 2-layer NN is designed to classify the severity of DR. The NN is trained by the extracted features. To train the NN, Backpropagation is used.
4.
EXPERIMENTAL
RESULTS
The fundus images from Standard Diabetic Retinopathy Database (DIARECTDB1) [10] are used as inputs for our proposed method.
The type of training function used in the NN is Levenverg-Marquardt backpropagation by which the network updates weights and bias threshold according to levenberg – marquardt optimization [12].
Like the Quasi-Newton method, the Levenberg– Marquardt algorithm intended to achieve a second order training speed without the need to calculate the Hessian matrix. When the performance function is found in the form of sum of squares, Hessian matrix can be computed as in equation (5).
H JTJ (5) The gradient can be calculated as follow
g
J
e
T
(6) Where e is vector of network errors, J is the Jacobian matrix that has the first derivative of the network error with respect to bias and weights.Using this approximation to the hessian matrix, the Levenberg-Marquardt algorithm can be computed as follows
x x J J I J e T T
k k
1
1 [ ]
(7)When the learning rate value of µ is large, the step size for the gradient descent is very small. The value of µ decreases after each step, however, it can increase in a particular step if the performance function increases in that step. The performance function is generally reduced in each iteration.
Table 2 : Neural Network Specifications Parameters Specifications
Number of Layers 3
Input layer nodes 7
Hidden layer nodes 20
Output layer nodes 4
Maximum Validation Failure
6
Activation functions Log-sigmoid, Purelin
Gradient 1e-7
Training type Levenberg – Marquardt Backpropagation
Figure 6: Training set and Validation set error Another way to avoid overfitting and improve generalization is called early stopping. The available data set is divided into training set, validation set and test set. The training set is used to update the weights and bias and to compute the gradient. During the training process, the error on the validation set is monitored. The validation error decreases as the training set error decreases but when the network starts to overfit the data, the error on the validation set starts to increase (Figure 6).
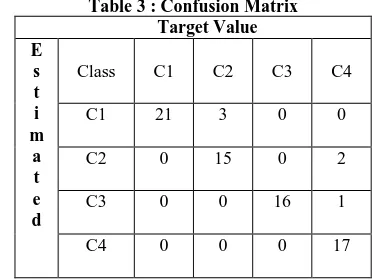
The maximum validation failure is set to be 6. When the validation error starts to increase for a specific number of iterations, the training of the network will be stopped. At the point where the validation error and training error are minimum, the values of weights and bias are kept. In this paper, the confusion matrix has four classes of DR. The confusion matrix is shown in the table 3.
Table 3 : Confusion Matrix Target Value E
s t i m
a t e d
Class C1 C2 C3 C4
C1 21 3 0 0
C2 0 15 0 2
C3 0 0 16 1
C4 0 0 0 17
We calculate the sensitivity, specificity and accuracy. To measure performance of the proposed method, the classes were divided into normal images and DR. Mild, moderate and severe stages were grouped into DR affected images (i.e. abnormal images). The proposed method has the classification sensitivity of more than 99%, specificity 89%, F1-score of 96%, and accuracy more than 94% for the normal and abnormal images.
4.1 Evaluation of the Classifier for the
Dataset I: DIARETDB1
Normal and abnormal images for the DIARETDB1 database were analyzed using kNN, SVM, GMM, SVM+GMM, SVM+kNN, Adaptive Boosting(AdaBoost). However, in this study Backpropagation on a multi-layered feed forward NN is utilized. Few images were not considered due to the flash of the fundus camera.
The red lesions are microaneurysms, hemorrhages and blood vessels. The bright lesions are exudates.
Table 4 : Red Lesion detection performance (%) on DIARETDB1
True red lesions vs Non red lesions Method Red Lesions Classifier
Sens (%)
Spec (%)
Sohini [13]
Microaneurysms , Hemorrhages
GMM 79 85
kNN 80 85
SVM 61 99
SVM+GMM 72 85
SVM+kNN 75 85
AdaBoost 60 97
Kauppi [14]
Microaneurysms , Hemorrhages
- 77.78 76.4
Proposed Method
Blood Vessels, Microaneurysms , Hemorrhages
Neural
Network > 99 94
Table 5: Bright Lesion detection performance (%) on DIARETDB1
True bright Lesions vs Non bright lesions Method Bright
Lesions
Classifier Sensitivity (%)
T. Jaya [15] Exudates SVM 89.5
FSVM 88.2
RVijay [16] Exudates RBF ~ 99
Proposed method
Exudates Neural Network
~ 99
4.2 Evaluation of the Classifier for the
Dataset II: MESSIDOR
The classifier was trained on the features that were extracted from the dataset DIARETDB1 and was tested on the MESSIDOR dataset. Here also the mild, moderate and severe NPDR cases were grouped into abnormal images.
Table 6: DR detection performance(%) on MESSIDOR Normal vs Abnormal image
Method Classifier Sensitivity
Sohini [13]
KNN ~ 99
GMM ~ 99
SVM 84.74
SVM+kNN ~ 99
SVM+GMM ~ 99
AdaBoost 80.62
Lama [17] Random Forest 70
Proposed Method
Neural Network 98
Therefore, the proposed method achieved a sensitivity of more than 98% for both the dataset. Therefore, the chances of missing a patient with DR while screening is very low.
5.
CONCLUSION
[image:5.595.88.282.405.545.2]severity. The proposed method showed the sensitivity of more than 99%, specificity of 90%, F1-score of 96%, and accuracy of more than 93%. Based on results, this novel research has established a successful computer-aided diagnosis approach to classify the severity level of DR automatically. The proposed method can help ophthalmologists to more efficiently, objectively, and accurately diagnose diabetic patients and reduce their workload and perhaps can make early DR screening more readily available to prevent vision loss for patients.
6.
REFERENCES
[1] “Prevention of Blindness from Diabetes Mellitus,” Report of a World Health Organization consultation, Geneva, November 2005.
[2] https://www.womenfitness.net/diabetic-retinopathy/
[3] May phu paing and Somsank choomchuayy, “Detection of Lesions and Classification of Diabetic Retinopathy Using Fundus Images,” Biomedical Engineering International Conference (BMEiCON), pp. 1 – 5, 9th 2016.
[4] Kanika Verma, Prakash Deep and A.G Ramakrishnan, “Detection and classification of diabetic retinopathy using retinal images,” India Conference (INDICON), pp. 1 – 6, 2011 Annual IEEE.
[5] H.M. Saifuddin and H.C. Vijayalakshmi, “Prediction of diabetic retinopathy using multilayer perceptron,” Internal Journal of Advance Research, pp. 658-664, June 2016.
[6] P.N.J. Sargunar and R. Sukanesh ,“ Exudates detection and classification in diabetic retinopathy images by texture segmentation methods,” International Journal of Recent Trends in Engineering, November 2009.
[7] G. Mahendran, R. Dhanasekaran and K.N. Narmadha, “Identification of exudates for diabetic retinopathy based on morphological process and PNN classifier,” Communication and Signal Processing Int. Conf. India , pp. 1117 – 1121, April 2014.
[8] E.M. Shahin et al., “Automated detection of diabetic retinopathy in blurred digital fundus images,” pp. 20 25, IEEE 2012.
[9] Deepthi K Prasad and Vibha L, “Early Detection of Diabetic Retinopathy from Digital Retinal Fundus Images,” Intelligent Computational Systems (RAICS), pp. 240 – 245, 2015 IEEE Recent Advances.
[10]T. Kauppi et al., “DIARETDB1 diabetic retinopathy database and evaluation protocol,” Technical report, Faculty of Medicine, University of Kuopio, Finland, 2007.
[11] https://emedicine.medscape.com/article/1225122-overview
[12]http://www.image.ece.ntua.gr/courses_static/nn/matla b/nnet.pdf
[13]Sohini Roychowdhury, Dara D. Koozekanani, “DREAM: Diabetic Retinopathy Analysis Using Machine Learning,” IEEE Journal of Biomedical and Health Informatics, vol. 18, no. 5, pp 1717 – 1728, September 2014.
[14]T. Kauppi, V. Kalesnykiene, J.-K. Kmrinen, L. Lensu, I. Sorr, A. Raninen, R. Voutilainen, H. Uusitalo, H. Klviinen, and J. Pietil, “Diaretdb1 diabetic retinopathy database and evaluation protocol,” in Proc. 11th Conf. Med. Image Understand. Anal., pp. 61–65, 2007.
[15]T. Jaya, J. Dheeba N. Albert Singh, “Detection of Hard Exudates in Colour Fundus Images Using Fuzzy Support Vector Machine-Based Expert System,” J Digit Imaging, pp. 761–768, 2015.
[16]Mr. R. Vijayamadheswaran, Dr.M.Arthanari, Mr.M.Sivakumar, “Detection of Hard Exudates in Retinal Images Using a Radial Basis Function Classifier,” International journal of innovative technology & creative engineering, vol.1, no.1, January 2011.
![Figure 1: Retinal images with NPDR and PDR [2]](https://thumb-us.123doks.com/thumbv2/123dok_us/9296383.427216/1.595.369.499.486.574/figure-retinal-images-npdr-pdr.webp)