A MODIFIED RP-HPLC METHOD DEVELOPMENT AND
VALIDATION FOR THE SIMULTANEOUS ESTIMATION OF
NEBIVOLOL AND INDAPAMIDE IN BULK AND
PHARMACEUTICALDOSAGE FORMS
T. Praveena* and S. Angala Parameswari
Department of Pharm. Analysis, Jangala Kandriga, Muthukur, Nellore – 524344.
ABSTRACT
A simple, precise, accurate, reproducible and economical stability-
indicating reverse phase liquid chromatography method was developed
and validated for the quantitative simultaneous estimation of Nebivolol
and Indapamide in bulk and marketed formulations. Estimation of
drugs in this combination was done with a C18 column Kromasil
column. 250mm × 4.6mm using mobile phase of composition
Acetonitrile and phosphate buffer (60:40 v/v, pH 3).The flow rate was
0.8 ml/min and the effluents were monitored at 226nm. The retention
time of Nebivolol and Indapamide were2.9 min and 4.2 min
respectively. The method was found to be linear over a range of 10-50
g/ml for Nebivolol and2-10 g/ml forIndapamide. The established method proved as
reproducible one with a %RSD value of less than 2 and having the robustness and accuracy
within the specified limits. Assay of marketed formulation was determined and find with
99.08% and 99.87% for Nebivolol and Indapamide respectively. The stressed samples were
analyzed and this proposed method was found to be specific and stability indicating as no
interfering peaks of degradation compounds and excipients were noticed. The method was
validated according to the guidelines of International Conference on Harmonization (ICH)
and was successfully employed in the estimation of commercial formulations. This liquid
chromatographic method can be applied for the qualitative and quantitative determination of
selected drugs by the modern chemist.
KEYWORDS:Nebivolol, Indapamide, RP-HPLC, Stability and Method validation.
Volume 7, Issue 15, 860-873. Research Article ISSN 2277– 7105
Article Received on 08 June 2018,
Revised on 28 June 2018, Accepted on 18 July 2018,
DOI: 10.20959/wjpr201815-13018
*Corresponding Author
T. Praveena
Department of Pharm.
Analysis, Jangala
Kandriga, Muthukur,
INTRODUCTION
Nebivolol is chemically designated as 1-(6-flo2zuro chroman-2-yl) -
[2-(6-fluorochroman-2-yl)-2-hydroxy-ethyl] amino} ethanol. It is a third generation vasodilating cardio selective
blocking agent used in the treatment of hypertension.[1] Its molecular formula is C22H25F2NO4
and it has a molecular weight of 444.90gm/mole. Nebivolol is a white odorless powder used
for the treatment of hypertension. It’s a mode of action is lowering blood pressure by
reducing the peripheral vascular resistance and significantly increases the stroke volume with
preservation of cardiac output. The net hemodynamic effect of Nebivolol is the result of a
balance between the depressant effects of a beta-blockade and an action that maintains the
cardiac output.
Indapamide is chemically designated as
4-chloro-N-(2-methyl-2,3-dihydroindol-1-yl)-3-sulfamoyl-benzamide. It is a non-thiazide sulphonamide diuretic drug generally used in the
treatment of hypertension, as well as decompensate cardiac failure. Its molecule contains a
both a polar sulfonylchlorobenzamide moiety and a lipid soluble methyl-indolinemoiety. It
differs chemically from thiazide is that it does not possess the thiazide ring system contains
only one sulfonamide group. The molecular formula is C16 H16ClN3O3S and molecular
weightis 365.8gm/mol. It is awhite to off-white crystalline powder. That is soluble in
methanol, ethanol, acetic acid and ethyl acetate, very slightly soluble in ether, chloroform,
and benzene, particularly insoluble in water. It is official drug in British Pharmacopoeia 2000
and United States Pharmacopoeia 2007.
Extensive literature survey proved that very few methods were reported for the determination
of Nebivolol and Indapamide by RP-HPLC.[2-12] So we attempted to develop an accurate,
rapid, precise, stable, sensitive and economically viable liquid chromatographic method for
the simultaneous determination of selected drugs in the present research.
MATERIALS AND METHODS
Equipment used
The chromatographic separation was performed on Agilent 1120 compact liquid
chromatographic system integrated with a variable wavelength programmable UV detector
and a Rheodyne injector equipped with 20l fixed loop. A reverse phase C18Agilent ODS
spectrophotometer and Axis AGN204-PO electronic balance were used for
spectrophotometric determinations and weighing purposes respectively.
Chromatographic conditions
Kromasil 100-5C18 column [250mm x 4.6mm] was used for the chromatographic separation
at a detection wave length of 226 nm. Mobile phase of composition Acetonitrile and
Phosphate buffer pH 3in a ratio of 60:40 v/vwas selected for elution and same mixture was
used in the preparation of standard and sample solutions. Flow rate was adjusted to 0.8ml/min
and the injection volume was 20l.
Preparation of Mobile phase
Phosphate buffer pH 3 was prepared by dissolve 0.136gm of Potassium dihydrogen
phosphate and 2 ml of Triethyl amine in 80ml of HPLC grade water and adjusts the pH to 3.0
with orthophosphoric acid and sufficient water was added to produce100 ml filtered through
0.45 membrane filter and sonicated for 20 minutes.
Preparation of Standard solutions
25mg each of Nebivolol andIndapamide were accurately weighed and transferred into two
25ml volumetric flasks, dissolved using mobile phase and the volume was made up with the
same solvent to obtain primary stock solutions A (Nebivolol) and B (Indapamide) of
concentration 1000g/ml of each drug. From the primary stock solutions, 5ml and 1ml were
pipette out from A and B respectively, transferred to a 10ml volumetric flask and the volume
was made up with the mobile phase to obtain final concentrations of 50 µg/ml and 10µg/ml
of Nebivolol and Indapamide respectively and this solution is (working stock solution A).
Preparation of Sample Solution
Twenty tablets of Nebivolol and Indapamide were weighed and crushed. Tablet powder
equivalent to 5mg of Nebivolol and 0.5mg of Indapamide was weighed accurately and
transferred to a 25ml volumetric flask. The content was dissolved with 10ml of mobile phase
and then sonicated for 15min. The volume was made up with the mobile phase and filtered
with 0.45membrane filter and sonicated for 20min.0.5ml of this solution was pipette out and
transferred to a 10mlvolumetric flask and the volume was made up with the mobile phase to
obtain a concentration of 60µg/ml of Nebivolol and 22.5µg/ml of Indapamide (working stock
Optimization of RP-HPLC method
The HPLC method was optimized with an aim to develop a simultaneous estimation
procedure for the assay of Nebivolol and Indapamide. For the method optimization, different
mobile phases were tried, but acceptable retention times, theoretical plates and good
resolution were observed with Acetonitrile, Phosphate buffer pH3 (60:40 v/v) using Kromasil
100-5C18 column[250mm x 4.6mm].
Validation of the RP-HPLC method
Validation of the optimized method was performed according to the ICH Q2 (B) guidelines.
System suitability
System suitability was carried out with five injections of solution of 100% concentration
having 50 µg/ml of Nebivololand 10 µg/ml of Indapamide in to the chromatographic system.
Number of theoretical plates (N) obtained and calculated tailing factors (T) were reported in
table 1.
Linearity
For the determination of linearity, appropriate aliquots were pipette out from working stock
solution A to a series of 10ml volumetric flasks and volume was made up with the solvent to
obtain concentration ranging from 10-50g/ml of Nebivolol and 2-10g/ml of Indapamide.
Each solution was injected in triplicate. Calibration curves were plotted with observed peak
areas against concentration followed by the determination of regression equations and
calculation of the correlation coefficients. The calibration curves for Nebivolol and
Indapamide were shown in figure 3 and figure 4 their corresponding linearity parameters
were given in table 2.
Limit of Detection (LOD) and Limit of Quantitation (LOQ)
The LOD and LOQ were calculated from the slope(s) of the calibration plot and the standard
deviation (SD) of the peak areas using the formulae LOD = 3.3 σ/s and LOQ = 10 σ/s. The
results were given in table 2.
Precision
The repeatability of the method was verified by calculating the %RSD of six replicate
same day and for intermediate precision % RSD was calculated from repeated studies on
different days. The results were given in table 3.
Accuracy
To ensure the reliability and accuracy of the method recovery studies were carried out by
standard addition method. A known quantity of pure drug was added to pre-analyzed sample
and contents were reanalyzed by the proposed method and the percent recovery was reported.
The results were given in table 4.
Specificity
Specificity of a method was determined by testing standard substances against potential
interferences. The method was found to be specific when the test solution was injected and no
interferences were found because of the presence of excipients. The optimized chromatogram
of Nebivolol and Indapamide without any interference was shown in figure 2.
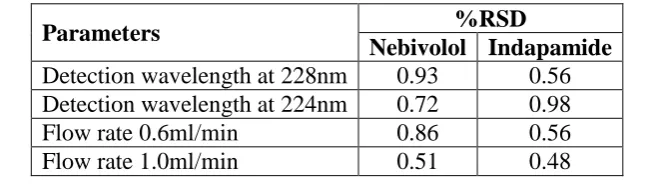
Robustness
Robustness of the method was verified by altering the chromatographic conditions like
mobile phase composition, wave lengthdetection, flow rate, etc. and the % RSD should be
reported. Small changes in the operational conditions were allowed and the extent to which
the method was robust was determined. A deviation of ±2nm in the detection wave length
and ±0.2ml/min in the flow rate, were tried individually. A solution of 100% test
concentration with the specified changes in the operational conditions was injected to the
instrument in triplicate. %RSD was reported in the table 5.
Assay of Marketed Formulations
20l of sample solution of concentration 50 g/ml of Nebivololand 10 g/ml of Indapamide
was injected into chromatographic system and the peak responses were measured. The
solution was injected three times in to the column. The amount of drug present and
percentage purity was calculated by comparing the peak areas of the standards with that of
test samples. A typical chromatogram for assay of marketed formulation was shown in figure
STABILITY STUDIES
Acid degradation studies
Prepared each 1mg/ml stock solution of Nebivolol and Indapamide by using mobile phase as
solvent, and then filtered through 0.45μm membrane filter paper. Stock solutions of 5 ml and
1ml of Nebivolol and Indapamide stock solution was transferred into 10ml volumetric flask
and added 1 ml of 0.1N HCL and diluted to volume with mobile phase. The resultant solution
was injected into the system; there was no acid degradation products were found the obtained
chromatogram was shown in figure 6.
Alkaline degradation studies
Prepared each 1mg/ml of stock solution with Nebivolol and Indapamide then filtered through 0.45μm membrane filter paper. Stock solutions of 5 ml and 1ml of Nebivolol and Indapamide
stock solution was transferred into 10ml volumetric flask and added 1 ml of 0.1NNaOH and
diluted to volume with mobile phase. The obtained non interfered chromatogram was
represented in figure 7.
Oxide degradation studies
Prepared each 1mg/ml of stock solution of Nebivololand Indapamide then filtered through
0.45µm membrane filter paper. Stock solutions of 5 ml and 1ml of Nebivolol and Indapamide
stock solution was transferred into 10ml volumetric flask and added 1 ml of H2O2 and diluted
to volume with mobile phase. In this investigation no identifiable oxidative degradants were
found and the chromatogram was shown in figure 8.
Thermal degradation studies
Prepared each 1mg/ml of stock solution with Nebivolol and Indapamide andthen filtered
through 0.45µm membranefilter paper. Stock solutions of 5 ml and 1ml of Nebivolol and
Indapamide10ml volumetric flask and diluted to volume with mobile phase and kept for
60min at 600c in hot air oven. From the obtained chromatogram it was proved that the
selected samples were stable against thermal conditions. The chromatogram was shown in
FIGURES AND TABLES
a) Nebivolol
b) Indapamide
[image:7.595.145.450.473.652.2]Fig. 1: Chemical Structures of a) Nebivolol and b) Indapamide.
Fig. 3: Calibration plot of Nebivolol.
Fig. 4: Calibration plot of Indapamide.
Figure 5: A typical chromatogram for assay of marketed formulation containing
[image:8.595.154.445.488.659.2]Figure 6: Chromatogram of acid degradation.
[image:9.595.153.444.539.720.2]Figure 7: Chromatogram of alkaline degradation.
Figure 9: Chromatogram of thermal degradation.
Table 1: System Suitability Parameters.
Parameters Nebivolol Indapamide
Retention time (min) 2.8 4.2 Theoretical plates (N) 11456 10366 Tailing factor (T) 1.2 1.4 Resolution (Rs) 2.89
Table 2: Results for Linearity.
Parameters Nebivolol Indapamide
Slope 0.0122 0.0119
y intercept 0.011+0.0122=0.0232 0.058+0.0119=0.0699 Correlation coefficient r2 0.999 0.999
[image:10.595.52.530.104.825.2]Regression Equation Y=31326351x+0.011 Y=6235614x+0.058 Linearity range 10-50g/ml 2-10g/ml LOD 0.16g/ml 0.33g/ml LOQ 0.49g/ml 1.01g/ml
Table 3: Results of Precision.
Drug Intraday Precision (%RSD) Interday Precision (%RSD)
Nebivolol 0.69 0.87 Indapamide 0.79 1.14
Table 4: Results for Accuracy.
Recovery level
Nebivolol Indapamide
Amount Added (µg/ml) Amount Found (µg/ml) % Recovery Amount Added (µg/ml) Amount Found (µg/ml) % Recovery
std test std Test
80% 20 20 39.6 99.0 2 6 7.93 99.80 100% 30 20 49.7 99.4 4 6 9.86 98.6 120% 40 20 59.3 98.8 6 6 12.1 100.8
Mean
Table 5: Results for Robustness.
Parameters %RSD
Nebivolol Indapamide
Detection wavelength at 228nm 0.93 0.56 Detection wavelength at 224nm 0.72 0.98 Flow rate 0.6ml/min 0.86 0.56 Flow rate 1.0ml/min 0.51 0.48
Table 6: Results for Assay of Marketed formulation.
Drug Label claim (mg/tab) Amount recovered % Amount found in drug
Nebivolol 5 4.67 99.08% Indapamide 1.5 1.42 99.87%
Table 7: Results for Stability studies of Nebivolol and Indapamide combined form.
Parameters % of degradation
Nebivolol Indapamide
Acid degradation 0.125 0.196 Alkali degradation 0.112 0.156 Peroxide degradation 0.268 0.341 Thermal Degradation 0.262 0.192
RESULTS AND DISCUSSION
After a number of trials with mobile phases of different composition, Acetonitrile, Phosphate
buffer pH 3.0 in the ratio 60:40v/v was selected as mobile phase because of better resolution
and symmetric peaks. Nebivolol and Indapamide were found to show appreciable absorbance
at 226nm when determined spectrophotometrically and hence it was selected as the detection
wavelength. An optimized chromatogram showing the separation of Nebivolol and
Indapamide at different RTs was shown in figure 2.
System suitability was carried out by injecting 5 replicate injections of 100% test
concentration, number of theoretical plates, HETP and resolution were satisfactory. The
chromatograms confirm the presence of Nebivolol and Indapamide at 2.9min and 4.2min
respectively without any interference. The parameters were given in table 1.
Concentration range of 10-50µg/ml for Nebivolol and 2-10µg/ml of Indapamide were found
to be linear with correlation coefficients 0.999 and 0.999 for Nebivolol and Indapamide
The limits of detection for Nebivolol and Indapamide were found to be 0.16µg/ml and
10.33µg/ml respectively and the limitof Quantitation were 0.49µg/ml and 1.01µg/ml
respectively. Values were represented in table 2.
The proposed method was found to be precise and reproducible with %RSD of 0.87 and 1.14
for Nebivolol and Indapamide respectively. %RSD was reported in table 3.
Accuracy of the method was verified by performing recovery studies by standard addition
method. The percent recovery of the standard added to the pre-analysed sample was
calculated and it was found to be 98.8% to 99.4% for Nebivolol and 98.6 to 100.8% for
Indapamide. This indicates that the method was accurate. Values obtained were given in table
4.
The method was found to be robust after changing the conditions like detection wavelength
(± 2nm) and flow rate (± 0.2 ml). %RSD was calculated for each variation and reported.
Values obtained were given in table 5.
The method was found to be specific for the combination of interest after verifying the
chromatograms showing no interference of the excipients present. Hence, the method was
well suitable for the estimation of the commercial formulations of the selected combination
with a percentage purity of 99.08% for Nebivolol and 99.87% for Indapamide. The typical
chromatogram for assay of marketed formulations was shown in figure.5 and Values obtained
were given in table 6.
FORCED DEGRADATION STUDY
Degradation studies indicated the specificity of developed method in presence of degradation
products. Degradation was carried out in combination of two drugs and purity of drug peaks
was confirmed by purity angles. Their combination drug products were exposed to acid, base,
oxidative and thermal stress conditions. Then found to be no degradable substances presence
and proved that the proposed method was stable towards acid, alkali, peroxide and thermal
conditions. The obtained values were reported in table 7.
CONCLUSION
The RP-HPLC method developed and validated allows a simple and fast quantitative
determination of Nebivolol and Indapamidefrom their formulations. All the validation
method was found to be specific for the drugs of interest irrespective of the excipients present
and the method was found to be simple, accurate, precise, rugged, robust andstable under
forced degradation stress conditions. So the established method can be employed in the
routine analysis of the marketed formulations.
REFERENCES
1. Beckett AH, Stenlake JB, Practical pharmaceutical chemistry, CBS Publishers and
Distributors, Delhi, 4th Ed, 1997; 2: 157-174.
2. Bavita Gaur, Kalpesh Gaur, Karni Singh, Sekhawatand Anoop Singh:, Development and
validation of HPLC method for simultaneous estimation of Nebivolol and Indapamide in
their combined tablet dosage form, World journal of chemistry, 2013; 8(1): 11-19.
3. Nirajvyas, Sangitapanchal:, A Validation of HPTLC method for the simultaneous
estimation of Nebivolol and Indapamide in solid dosage form, Asian j.pharma Ana, 2014;
4(3): 98-102.
4. Damera Vamshi, Lakshmi Madhuri P, Tulja Rani G:, Method development and validation
of Indapamide and Nebivolol hydrochloride by RP-HPLC, International Journal of
Research in Pharmaceutical and Nano Sciences, 2013; 2(6): 798-810.
5. Chetan MB, Hanumanthachar KJand Jayanthi C:, RP-HPLC estimation of Nebivolol,
International Journal of Research in Pharmaceutical and Biomedical Sciences, 2012; 3(4):
1594-1596.
6. Della Grace Thomas Parambi, Molly Mathew, Anila Jose and Revikumar KG:, A
validated U.V. Spectrophotometric determination of an anti hypertensive drug Nebivolol
from tablet formulations, International Journal of Pharmaceutical Sciences Review and
Research, 2010; 3(2): 139-141.
7. Krishna veni G. and Satyannarayan PVV:, Development and validation method for
quantification of Nebivolol hydrochloride and Indapamide in tablet dosage form, Assian
Journal of Research in Pharmacy and Chemistry, 2011; 1(3): 484-487.
8. Chodavadia Rajanikant M, Marolia Bhavin P, Shah Shailesh A and Dudhat Girish C:
First order derivative spectrophotometric method for simultaneous estimation of
Nebivolol hydrochloride and Indapamide in tablet dosage form, Asian Journal of
Research in Chemistry, 2012; 5(2): 282-285.
9. Khandelwal N, Ranawat MS, Amardeep Ankalgi, Sharma CS and Hemender Pratap
Singh:, RP-HPLC method for estimation of Nebivolol in Pharmaceutical dosage form,
10.Ahmed, ManoharaYN and Ravi MC:, Development and validation of RP-HPLC method
for simultaneous estimation of Nebivolo hydrochloride and Indapamide in combined
dosage form, International Journal of Chem Tech Research, 2011; 4(1): 328-336.
11.Shah KV, Trigar PR, Sheth DB and Desai TR:, Simultaneous estimation of Nebivolol
hydrochloride and Indapamide in bulk and in a tablet dosage form by multicomponent
and simultaneous estimation method, International journal of pharmaceutical sciences,
2011; 2(1): 27-35.
12.Shah DA, Bhatt KH, Mehta RS, Bandaria SL and Gandhi TR:, Stability indicating
RP-HPLC estimation of Nebivolol hydrochloride in Pharmaceutical formulations, Indian