PREVENTION, CONTROL, INHIBITION, AND THERAPY OF HCV GT
4A VIRUS INFECTION IN EGYPT
Fadel M. Ali1, Hala M. Ahmed*2, A. Elmaghraby3 and A. Amin3
1
Faculty of Science-Cairo University.
2
Faculty of Applied Medical Sciences-October 6 University.
3
Engineering Authority of Armed Forces.
ABSTRACT
Objective: Electric Field (ELF-EMFs) has great potential for modern biotechnological and new medical applications. This paper shows the
effect of Electric Field (ELF-EMFs) on HCV GT 4a, which could
imply a durable change in Clinical chemistry parameters and
virological testing. Methods: Hepatitis C virus (HCV) infection has acute and chronic forms with most of the morbidity through the
development of chronic liver disease. For this purpose, HCVGT 4a
activities in Huh-7 and HepG-2 cell line media were exposed to
different frequencies of amplitude modulated (AM) waves in the frequency range (from 1 Hz
to 10 Hz) for a period of 30 minutes /day along four successive days no measurable effect of
the square amplitude modulated waves (QAMW) was noticed after the experiment in the
Huh-7 and Hep G-2 cells. At day (1, 2, 3, 4, 5, and 6) of the (PBMCs), supernatant was
collected for each group then the liver enzymes (ALT), Measurement of complete blood
count, determination the virological testing, Cultures were daily examined using the inverted
microscope (Hund-Germany) for detection of cytopathic effect (CPE). The results: The data
highly significant growth inhibition occurred in HCVGT 4a injected with Huh-7 and Hep G-2
cell line after exposure to 5.2 Hz QAMW for 30 minutes/day along four successive days. The
mean ALT level was slightly higher in patients infected with HCV GT 4a non exposed
Electromagnetic waves (410 U/L) than those infected with HCV GT 4a exposed
Electromagnetic waves (90 U/L). There was a decrease of mean ALT levels during the course
of treatment in both groups. Hemoglobin levels between the two groups decreased slightly
during treatment the follow-up period. Neutrophil counts between the two groups decreased
slightly during treatment but increased again during the follow-up period. The median
Volume 8, Issue 10, 184-202. Research Article ISSN 2277– 7105
Article Received on 08 July 2019,
Revised on 28 July 2019, Accepted on 18 Aug. 2019
DOI: 10.20959/wjpr201910-15633
*Corresponding Author
Dr. Hala M. Ahmed
Faculty of Science-Cairo
baseline serum HCV RNA load was 9.7x10⁵ IU/ml in patients with HCV GT 4 exposed
infection (p<0.001), and 2.0x10⁵ IU/ml in patients with HCV GT 4a non exposed infection (p
<0.02).The viral isolates showed a gradually elevated replication activity on Huh-7 and Hep
G-2 cells, where the cytological changes (90% CPE) could be detected within 1-6 days post
viral inoculation compared with the negative control. Conclusions: The results tend to show
that Electric Field (ELF-EMFs) are able to inactivate viral growth and have probably no
serious impact in HCVGT 4a. The results indicated that the HCVGT 4a has frequencies with
the bioelectric signals generated during cellular division.
KEYWORDS: HCVGT 4a, Electromagnetic field (ELF-EMFs), Huh-7 and Hep G-2 cells.
INTRODUCTION
Several studies have been performed to verify direct effects exerted by extremely low
frequency (ELF) electromagnetic fields (EMFs) on cell functions. Different variety of cell
responses have been observed involving proliferation and differentiation (Lisi, et al., 2006,
Vianale et al., 2008), gene expression (de Mattei et al., 2005, Goodman, et al., 2009),
modulation of the membrane receptors functionality (Bersani et al., 1997, Fadel et al., 2018),
alteration in ion homeostasis (Grassi et al., 2004, Piacentini et al., 2008), and free radicals
generation (Morabito et al., 2010, Wolf et al., 2005). In particular, it has been demonstrated
that bacterial exposure to (ELF-EMF) can alter its viability and growth rate with frequency
and amplitude dependency (Moshe et al., 2008), antibiotic susceptibility (Segatore et al.,
2012), and structural shape (Fadel et al., 2018).The bacteria have also been used in the
studies to evaluate the effects of (ELF-EMF) on some of its functional parameters as cell
growth, antibiotic sensitivity, and cell morphology (Cellini et al., 2008, Ayse et al., 2011,
Belyaev, 2011).Of note, higher frequency fields are truly electromagnetic in that the electric
and magnetic fields propagate together, whereas at low frequencies the fields can be
effectively separated as alternating electric or magnetic fields. The consistently low
thresholds at which EMF stimulates biological processes indicate that they require little
energy and its frequency response is most effective at certain values that coincide with the
natural rhythms of the processes affected (Martin and Reba, 2004). Among several studies of
the last years, bacteria were subjected to many experimental procedures to evaluate how such
unicellular systems may respond to EMFs (Pothakamury et al., 1996; Jeantet et al., 1999;
Fojt et al., 2004; Amiali et al., 2007; Jaegu et al., 2008; Ji et al., 2009; Tagourti et al., 2010).
in the range from 10 KV/cm up to several mV/m (Cserhalmi et al., 2002; Fleischman et al.,
2004; Fox et al., 2008; Ruiz-Gomez et al., 2010) with the aid of very high temperature for
inactivation of bacterial growth. Biological systems, in vivo, generate electric currents and
fields that associated with magnetic fields, as a result of the running physiological
mechanisms. In these mechanisms ionic motions are involved which are responsible for all
bioelectric signals generated. The flow rate, period and direction of flow of the ions will
generate an electric impulse with a specific frequency, shape and amplitude (Fadel et al.,
2014).
In Egypt, HCV is one of the top five leading causes of death (Mohamed M.K. and El-Said
Aoun, 2002). Most of infected individuals are not aware of their infective status and are not
clinically ill but they are a source of infection to others. No protective vaccine against HCV is
available currently (Simmods P., 2004; Brass V. et al., 2006). The treatment is costly,
requires long-term medical support and follow-up and has serious side effects. Modern
therapies are not affordable for the majority of HCV carriers worldwide. In Egypt, the
prevalence rate of HCV infections has been reported as high as 20% (El-Ahmady O. et al.,
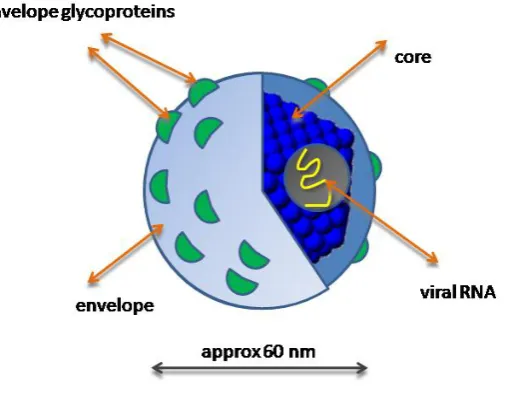
1994).The HCV genome consists of an RNA surrounded by an icosahedral protein capsid and
a lipid envelope (Op De Beek A. et al., 2003). Two viral envelope glycoproteins, E1 and E2,
are embedded in the lipid envelope (Figure.1). HCV genotype 4 was found to be predominant
with 91% in Egypt The distribution and the source of HCV isolates in each of the 15
Egyptian governorates (Stauber. et al., 2008).
[image:3.595.176.430.520.719.2]AIM OF THE WORK
The main objective of this work is to find the resonance frequency of (ELF-EMFs) the
control viral cell growth where the resonance of the extremely high and low frequency
electromagnetic fields (ELF-EMFs) that can enhance and inhibit the activity of HCV GT4a in
plasma and its ability to make activity of the virus. Moreover, Biochemical examination were
determined by evaluating various cellular activities (ALT) in serum, measurement of
Complete blood count (Neutrophil counts and Hemoglobin) and virological testing findings
that may occur as a result of exposure to the enhancement and inhibiting resonance frequency
of the (ELF-EMFs)
MATERIALS AND METHODS 1-Sample collection
A total of 43 patients were enrolled from Al-Qaser El-Ainy University Hospital, Cairo
University from Oct 2009- to Oct 2014. All subjects participated in the study signed written
informed consents. Aliquots of 10-15 ml blood were withdrawn from all enrolled subjects.
Plasma from 35 (HCV GT 4a infected) and 8 controls were collected. All subjects
participated in the study signed written informed consents. The study was approved by the
research ethics committee of Cairo University, Egypt. Inclusion criteria of the HCV GT
4a-infected participants were based on sero positivity for HCV antibodies, HCV RNA GT 4a as
assessed by PCR, elevated aminotransferase levels for 6 days.
2-Study Design
Blood samples were centrifuged for 15 min. at 200 xg and plasma was collected for
measuring HCV-RNA and measurement of liver enzyme (ALT) on fresh samples. HCV-
RNAwas measured before treatment, after 1, 2,3,4,5 and 6 days, at the end of treatment, and
at the last follow-up visit by a quantitative reverse-transcription–polymerase-chain-reaction
(RT-PCR) assay. Samples were clearly divided into two groups: First group, where the viral
titer was reduced from the base line. Second group, the samples were under detection limit
for HCV-RNA. To assess the viral infectivity in the supplied samples, selected group from
both positive and negative groups were cultured on Huh-7 and HepG-2 cell lines as described
at (Zekri et al., 2011&2009).
3-Isolation of Peripheral Blood Mononuclear Cells (PBMCs)
Approximately (5-8 mL) of whole blood was drawn into an ethylene diamine tetra acetic acid
Ficoll-Hypaque density gradient centrifugation, replicates of (2x10⁵ (PBMCs)) per well of a
24-wells flat-bottom plate dimensions (127.8x85.5x20.0 mm)(Costar, Cambridge,
Massachusetts) were directly subjected to a 5-day proliferation assay in the presence of either
(1 mg/ml) HCV GT 4a protein, (50 mg/ml) tetanus toxoid (Behring, Marburg, Germany),
phytohemagglutinin (PHA), medium alone or control buffer (Al-Sherbiny M et al., 2005).
The stimulation index was calculated as the ratio of the average number of counts per minute
of five replicate cultures in the presence of antigen as compared to control buffer or
medium.as described elsewhere (Shata MT et al., 2007).
4-Cell lines and cell culture
Cell monolayers of the human hepatoma cell line Huh-7 and HepG-2 were purchased from
VACSERA [Giza,Egypt]. Huh-7 and HepG-2 cells were subculture in a 75 cm2 flasks in
DMEM supplemented with 2 mM L-glutamine [Biochrom], penicillin [Biochrom],
streptomycin [Biochrom] and 10% heat inactivated fetal bovine serum [HyClone, UK] at
37ºC under a humidified atmosphere containing 5.2%CO2 saturated atmosphere until
confluent monolayer detected and maintained in an exponential growth state. The adherent
cells were collected by 0.25% trypsin according to a previously published method (Paino IM
et al., 2010). Inoculated bottles were daily microscopically observed for 7 days for detection
of cellular changes and development of cytopathic effect (CPE). Flasks developed CPE were
freeze and thawed three times for virus extraction. (Bussereau et al., 1982).
5- Electric Field (ELF-EMFs)
In this experiment, samples were exposed to electromagnetic waves, generated from 2
generators. The carrier wave was 10 MHz sine wave with amplitude ± 2 Vpp generated from
a synthesized arbitrary waveform generator type Thurbly Thander Instruments (TTi TGA
1230) manufactured by Huntingdon Cams England. This wave was square amplitude
modulated (AM) by a second wave generator model AFG 310 manufactured by Sony
tectonics, Japan with a modulation the amplitude of the wave carrier was 20 V and the
modulating depth was ±2V. (Fadel et al., 2009). The output of the second generator that
carries QAMW was connected to two parallel copper mesh electrodes of separation distance
(1.5cm) and area (180cm2). During the samples exposure the (24 wells) plate were housed
between the parallel capacitance electrodes as shown in (Figure 2). The irradiation facilities
Figure (2): Experimental scheme of the Electric Field (ELF-EMFs) measurements.
6-Determination of Resonance Frequency of Growth Inhibition
Hus-7 and HepG-2 cells were harvested, washed adjusted at concentration (5x10⁴ cells/well)
growth medium and cultured in 12 well plates with 1ml medium per well. After 24 hrs, the
culture medium was replaced with 1ml of complete medium containing HCV GT 4a samples
plates were incubated at (37°C) in (5.2%CO2) for (24 hrs) and the virus containing media was
removed. The cells were washed twice with Phosphate buffer saline (PBS) and (2 ml) of
complete culture medium was added to each well plates were incubated and the cells were
harvested at the indicated times for viral samples exposure, the suspension of the sample
(5x10⁴ cells/well Hus-7 or Hep G-2/5x104 RNA/ml HCV GT 4a). The samples were exposed
to different modulating frequencies in the (0.1,0.2,0.3,0.4,0.5,0.6,0.7,0.8,0.9 and 1 Hz) for 30
minutes each, to find out the enhancing and inhibiting frequency of the viral growth as in
figure (3).In order to determine if the 10 MHz wave carrier of Electric Field (ELF-EMFs) has
a role in growth inhibition process, a pulsed magnetic field at the same resonance frequency
of growth inhibition that determined through Electric Field (ELF-EMFs) was used (Zare et
al., 2007;Khaki AA et al., 2006)
7-Clinical chemistry parameters
A liver enzyme (ALT) was measured using ALCYON 3000 i analyzer, Abbott laboratories,
USA/Canada. Spinreact kits (Ctra, Santa Coloma, Espana) was used in the measurement of
[image:6.595.142.455.75.267.2]8-Measurement of Complete blood Count
Complete blood count (Neutrophil counts and Hemoglobin) were measured using ADVIA
analyzer, Holland.
9-Virological Testing
Reverse-transcription polymerase chain reaction (RT-PCR) (Roche Molecular Systems, Inc.,
Branchburg, NJ), was performed on serum samples for detection and amplification of HCV
RNA using an in-house nested RT-PCR assay developed at the Al-Qaser El-Ainy University
Hospital, Cairo University. RT-PCR was performed on serum samples from
anti-HCV-positive patients and on serum samples from anti-HCV-negative patients. This assay has a
lower limit of detection of 15 IU/ml. Positive results below this HCV RNA concentration are
referred to as “low-positive”. HCV genotypes and subtypes were determined by using the
TruGene HCV 5´NC Genotyping Kit (Bayer Health care LLC, Tarrytown, NY) according to
the manufacturer’s package insert instructions. Amplification products generated by the
COBAS Amplicor HCV Monitor Test (Roche) were used.
10-Isolation of Cell lines and cell culture
Isolation was carried out by inoculating specimens onto monolayer of Huh-7 and HepG-2 cell
lines (American Type Culture Collection ATCC-clone CCL-81). Tissue culture flasks
(Griener-Germany) were incubated at (37°C) for an adsorption period of (1-1.5 hr) with
gentle mixing at (15 min) time interval for well virus distribution. Maintenance medium was
dispensed to cell culture flasks post adsorption time (DMEM supplemented with 2% FBS)
was added without removing the inoculums according to (Joseph and Thomas, 1994).
Negative control of non-infected cells was considered. Cultures were daily examined using
the inverted microscope (Hund-Germany) for detection of cytopathic effect (CPE).
11-Comparison studies
The serum HCV GT 4a exposed were compared to those with non-exposed. The ALT level,
the hemoglobin concentration (HB), and the neutrophil count were compared at the baseline
(BL) and at days (2, 3, 4, 5 and 6) of the treatment and day 4 of follow up. The serum HCV
RNA load was tested at days 2,3,4,5 and 6 of the treatment and day 4 of follow up. The EVR,
12-Statistical analysis
Statistical significance was determined using Student’s t test, using SPSS 13.0. P < 0.05 was
considered to indicate a statistically significant result.
RESULTS
1-Characteristics of HCV GT 4a patients
Characteristics of patients are summarized in Table 1. Samples infected with either HCV GT
4a exposed or non-exposed had a comparable ALT, HB and neutrophils.
Table 1: Results for clinical chemistry parameters for samples infected with HCV GT 4a non exposed ELF-EMFs.
Baseline (BL) Day (2) Day (4) Day (6)
ALT (U/L) 204 306 366 469
HB (mg/L) 16 12 12 10
Neutrophils 3.2 3.3 3.5 3.5
Table 2: Results for clinical chemistry parameters for samples infected with HCV GT 4a exposed ELF-EMFs at (4.9 Hz).
Baseline (BL) Day (2) Day (4) Day (6)
ALT (U/L) 204 199 100 40
HB (mg/L) 16 12 12 12
Neutrophils 3.2 1.4 1.5 2.2
Bl, baseline; HB, hemoglobin
2- Resonance curve for exposed samples to ELF-EMFs at different frequencies
HCV GT 4a suspensions were exposed for a duration time of (30 minutes) of the virus on its
growth characteristics studied to different frequencies of( ELF-EMFs ) in the range of (1-10
Hz) to determine the resonance frequency of growth inhibition then the TCID 50 of the
samples was measured. Then different groups of HCV GT 4a suspension were exposed to
QAMW at resonance frequency of growth inhibition for period of 30 minutes in order to
determine the optimum exposure period and according to treatment schedule of once/day
were used in the experiments and wave emission continuous and the growth characteristics
for control and exposed groups were studied .The results of exposure of HCV GT 4a and
HCV GT 4a to (ELF-EMFs) for 30 minutes at frequencies (1 to 10 Hz), the data indicate a
non-significant variation of in the activity of the HCV GT 4a and Huh-7 and HepG-2 cell
lines after exposure to (1 to 10 Hz) (ELF-EMFs) for 30 minutes when compared to HCV GT
significant growth enhancement occurred in HCV GT 4a injected with Huh-7 and HepG-2
cell lines after exposure to (4.9 Hz) (ELF-EMFs) for 30 minutes (P ≤ 0.001).In contrast, The
data in the figure indicate a highly significant growth inhibition occurred in HCV GT 4a
injected with Huh-7 and HepG-2 cell lines after exposure to (4.9 Hz) (ELF-EMFs) for 30
minutes (P ≤ 0.002) when compared to HCV GT 4a injected with Huh-7 and HepG-2 cell
lines non-exposed. These results reflect that the (ELF-EMFs) (4.9 Hz) is the resonance
frequency of growth inhibition for HCV GT 4a.
Figure (3): The variation of the HCV GT 4a on Huh-7 and HepG-2 cell lines cells exposed for 30 minutes to (ELF-EMFs) at different frequencies showing the inhibition at (4.9 Hz). The data are expressed as mean ± S.E.
3-Effect of exposures to electric field (ELF-EMFs) on (PBMCs) viability of HCV GT 4a At BL, the mean ALT level was slightly higher in patients infected with HCV GT 4a non
exposed Electromagnetic waves (410 U/L) than those infected with HCV GT 4a exposed
Electromagnetic waves (90 U/L). There was a decrease of mean ALT levels during the course
[image:9.595.147.457.230.473.2]Figure (4): Mean ALT levels in samples with HCV GT 4a infection exposed or non-exposed (ELF-EMFs).
ALT (alanin aminotransferase)
There was almost difference in hemoglobin levels between the two groups. Hemoglobin
levels decreased slightly during treatment the follow-up period (Figure. 5).
Figure (5): Mean hemoglobin levels in samples with HCV GT 4a infection exposed or non-exposed (ELF-EMFs).
There were almost no difference neutrophil counts between the two groups. Neutrophil
counts decreased slightly during treatment but increased again during the follow-up period
[image:10.595.145.453.72.286.2] [image:10.595.142.453.424.639.2]Figure (6): Mean neutrophil counts in samples with HCV GT 4a infection exposed or non-exposed (ELF-EMFs).
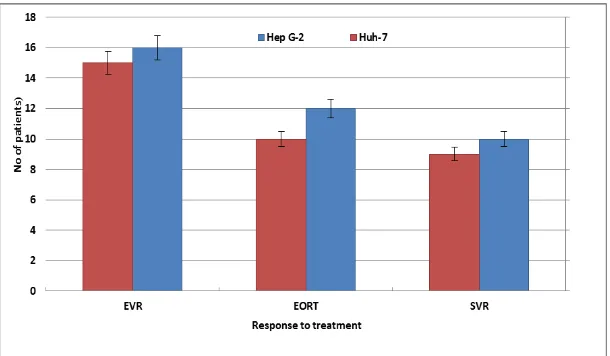
3-Response to anti-HCV treatment
The median baseline serum HCV RNA load was 9.7x10⁵ IU/ml in patients with HCV GT 4
exposed infection and 2.0x10⁵ IU/ml in patients with HCV GT 4anon exposed infection. The
early virological response rate (EVR), the end of treatment response rate (EOTR), and the
sustained virological response rate (SVR) were found to be significantly higher in patients
with HCV GT 4a exposed than those with HCV GT 4a non-exposed (Fig. 7). In the HCV GT
4 a exposed group, 27 of 43 samples achieved EVR compared to 16 of 43 samples with HCV
GT 4a non exposed (p <0.02). In the HCV GT 4a exposed group, 27 of 43 samples achieved
EOTR compared to 16 of 43 samples with HCV GT 4a non-exposed (p<0.001).
Corresponding data for SVR were 26 of 43 samples in the HCV GT 4a exposed group and 17
of 43 samples in the HCV GT 4a non-exposed group (p<0.01).
[image:11.595.145.452.72.240.2] [image:11.595.146.451.542.720.2]4-Isolation Cell lines and cell culture
8 out of 43 (18.6%) specimens showed characteristic cytopathic effect (CPE) on cultured
Huh-7 and HepG-2 cell lines. All viral isolates were obtained from specimen, while none was
obtained from swab specimen. The four isolates showed first cytological changes on the 4th
-7th day post inoculation till the development of 90% CPE on the 4-5 day as shown in Fig.
(6).On further passaging, the viral isolates showed a gradually elevated replication activity on
Huh-7 and HepG-2 cells, where the cytological changes (90% CPE) could be detected within
1-6 days post viral inoculation Figure (8) compared with the negative control Figure. (8).
Control Day (1) Day (2) Day (3) Day (4) Day (5) Day (6)
Hu
h
-7
HepG
-2
Figure (8): Cytological changes in Huh-7 and Hep G-2 cells line detected within 1-6 days cells that were swollen, retractile and Distinct from transparent cell sheet.
DISCUSSION
In the present work the prevention, control, inhibition, and therapy of HCV GT 4a virus
infection in Egypt. In activity by electric field (ELF-EMFs) was studied. The procedure of
treatments of the viral growth was based on the resonance interference of applied electric
fields with the bioelectricity signals generated during cellular division. Our data suggest that
electric field (ELF-EMFs) had direct effects on HCVGT 4a; including the inhibition of
growth culture. The electric field (ELF-EMFs) deliveries on HCVGT 4a suspension induced
a viral inactivation (around one log10 after 500 pulses). (Fadel 1998, Fadel et al., 2009), to
interfere with biological electrical signals generated during metabolic activities or in activity
of cells it is necessary to apply on these cells external electric waves of the same frequency.
In this work, a wave carrier of 10 MHz was used. The results indicated that the HCV GT 4a
has two resonance frequencies with the bioelectric signals generated during cellular division;
of extremely low frequency electromagnetic fields on the Rift valley fever virus done by
(Fadel et al 2018) showed that there is an inhibiting effect for cell multiplication of HCV GT
4a virus at 5.2 Hz QAMW. The inhibiting effect at 4.9 Hz QAMW may be due to destructive
interference of the applied wave with the bio-waves generated during cell multiplication.
This study showed a significantly higher in sample infected with HCV GT 4a with Huh-7
than in those infected with HCV GT 4a with HepG-2. Although the (ELF-EMFs ) therapy has
lead to a significant progress in the management of HCV GT 4a, the response to therapy is
still variable and depends on host characteristics and virological factors. To get a better
insight into the interaction mechanism of the electromagnetic field with the biological
systems the understanding of the bioelectrical signals resulting from the biological system
during metabolic activity is required. (Mohamed et al., 2002) reported that the bioelectrical
signals from the microorganism were normally carried out through bending of their cellular
membranes which generate an electric impulse through phenomena known as flux electricity.
The amplitude and the frequency of these impulses depend on the magnitude and frequency
of bending. These impulses travel through the medium separating the microorganisms and are
received by the signal receptors at the surface and that impeded the cell membrane.
Therefore, the flexibility of the membrane is the most important parameter for generation of
these signals. There is also mentioned that the bio magnetic field from the biological system
associated to the bioelectrical signals from the membrane of the cells through its metabolic
function is very weak in nano Gauss range (20×10-8 G). When the biological systems exposed
to an external magnetic field whose strength is very large relative to the bio magnetic field of
the cells, a disturbance in their metabolic function will be expected which leads to death of
the cells or increases their cell division, (Fadel et al. 2014)
In the present work, we studied the effects of the infection with HCV GT 4a virus on ALT
before and after exposure to (ELF-EMFs) waves. Also, a recovery study was carried out after
two months from stopping the exposure to (ELF-EMFs) waves. The changes in liver enzymes
are shown in Figure (4).The values of ALT from the infected group showed significant higher
values (p < 0.05) depending as compared to values for the control group. The obtained data
showed that ELF EM waves produced alteration in biochemical parameters of the liver
transaminases ALT which have been widely utilized in mammalian toxicology as biomarkers
of specific organ dysfunction. In general the increase in transaminases activity is usually
The results in this work indicated that the measurement of complete blood count (Neutrophil
counts and Hemoglobin) and virological testing decreased for treated liver by (4.9 Hz)
QAMW waves (Huh-7 and Hep G-2 cells). The mechanism of interaction of these
electromagnetic fields with the virus at this frequency may be the resonance destructive
interference with the electric impulses generated from ionic motions in the virus cell division
resulting in growth inhibition (Fadel et al., 2014). There was almost difference in hemoglobin
levels between the two groups. Hemoglobin levels decreased slightly during treatment the
follow-up period. (Figure 5). There was almost no difference neutrophil counts between the
two groups. Neutrophil counts decreased slightly during treatment but increased again during
the follow-up period (Figure. 6).
The delayed detection of cytological changes may be attributed to the low viral load in
collected specimens, recording 90% CPE on the 12th-16th day post infection. Alternating
passaging in cell culture could be a supporting factor to maximize the viral load, where on the
5th passage the cytological changes could be detected within 2-4 days post viral infection
showed a gradual increase in the mean viral infectivity titer relatively to time recording 0.56
log (10) / 24 hr, 0.4 log (10) / 24 hr, 0.429 log (10) / 24 hr and 0.543 log (10) / 24 hr for the 4
isolates respectively. These data were supported by the reports recorded by Marin et al.,
(2000), Arvin (2001), Moretti et al., (2002) and Schmutzhard et al., (2004) where they noted
that the infective varicella zoster virus could be isolated using cell culture and typical
cytopathic effect (CPE) was observed within 3 days to 3 weeks according to the viral load.
CONCLUSION
The present study demonstrated that the inhibiting resonance frequency of ELF-EM waves
that deteriorates HCV GT 4a growth will be promising method for the treatment of HCV GT
4a infection. This technique is non-destructive, non-expensive, and safe and fast, where only
30 min are needed for the exposure of viral to stop its ability to make cell division. Treatment
of injected mice by HCV GT 4a with (4.9 Hz) seems successful and applicable.
REFERENCESES
1. Al-Sherbiny M, Osman A, Mohamed N, et al. Exposure to hepatitis C virus induces
cellular immune responses without detectable viremia or seroconversion. Am J Trop Med
2. Amiali M., Ngadi M., Smith J. and Raghavan V." Synergistic effect of temperature and
pulsed electric field on inactivation of Escherichia coli O157:H7 and Salmonella
enteritidis in liquid egg yolk." J. Food Eng, 2007; 79: 689–694.
3. Ayse I., Burak A., Zafer A., Dilek A. et al., "Effect of extremely low frequency
electromagnetic fields on growth rate and morphology of bacteria", Int. J. Radiat. Biol.,
2011; 1–8.
4. Belyaev I., “Toxicity and SOS-response to ELF magnetic fields and nalidixic acid in E.
coli cells,” Mutation Research, 2011; 722(1): 56– 61.
5. Bergmeyer, H.; Schreiber, P. and Wahlefeld, A. Optimization of methods for aspartate
aminotransferase and alanine aminotransferase. Clin. Chem., 1978;24(1): 58-73.
6. Bersani F., Marinelli F., Ognibene A. et al., “Intramembrane protein distribution in cell
cultures is affected by 50Hz pulsed magnetic fields,” Bioelectromagnetics, 1997; 18(7):
463– 469.
7. Brass V. Moradpour D, Blum HE. Molecular Virology of Hepatitis C Virus (HCV) 2006
Update. Int J Med Sci., 2006; 3: 29-34. available at: www.medsci.org
8. Bussereau F.; Benejean J. and Saghi N. Isolation and study of temperature-sensitive
mutants of rabies virus. GenVirol., 1982; 60(pt1): 153-8.
9. Cellini L., Grande R., Di Campli E., et al., “Bacterial response to the exposure of 50Hz
electromagnetic fields,” Bioelectromagnetics, 2008; 29(4): 302–311.
10.Characterization of chronic HCV infection-induced apoptosis. Zekri AR, Bahnassy AA,
Hafez MM, Hassan ZK, Kamel M, Loutfy SA, Sherif GM, El-Zayadi AR, Daoud SS.
Comparative Hepatology, Jul 23 2011; 10(1): 4.
11.Consensus siRNA for inhibition of HCV genotype-4 replication. Zekri AR, Bahnassy
AA, El-Din HM, Salama HM., Virology Journal, Jan 27, 2009; 6: 13.
12.Cserhalmi Z., Vidacs I., Beczner J. and Czukor B." Inactivation of Saccharomyces
cerevisiae and Bacillus cereus by pulsed electric fields technology" Innovative food
science and emerging technologies, 2002; 3: 41-45.
13.De Mattei M., Gagliano N., Moscheni C. et al., “Changes in polyamines, c-myc and c-fos
gene expression in osteoblast-like cells exposed to pulsed electromagnetic fields,”
Bioelectromagnetics, 2005; 26(3): 207–214.
14.El-Ahmady O, Halim A, Mansour O, Salman T. Incidence of hepatitis C virus in
Egyptians. J Hepatol, 1994; 21: 687.
16.Fadel Ali, Hala Moustafa, Nashwa Abbas, Hanan Moustafa, Hamida Hamdi: Control the
activity of Rift Valley Fever Virus by Electric Field waves at resonance frequency (In
vivo & In vitro) studies IOSR Journal of Applied Physics (IOSR-JAP). Volume 6, Issue 1
Ver, 2014; III: 07-17.
17.Fadel M. A. "A New Metabolic Biomagnetic Resonance Model to Describe the
Interaction of ELF EM. Fields with Biological Systems" International School on
Theoretical Biophysics, Moscoww May, 1998.
18.Fadel M. Ali, Hala M. Ahmed, Nashwa A. Ahmed and Mona S. Elneklawi (2018):
Evaluation of the Effect of Extremely Low-Frequency Electromagnetic Fields on the
Growth of Escherichia coli. International Journal of Scientific & Engineering Research
July-2018; 9(7).
19.Fadel M.A., Ahmed M.A. and El Hag M.A. "Control of Sclerotium cepivorum (Allium
White Rot) activities by electromagnetic waves at resonance frequency". Australian
Journal of Basic and Applied Science, 2009; 3(3): 1994-2000. ISSN 1991- 8178.
20.Fadel M.Ali, M.A.Ahmed and M.A.El Hag, "Control of Sclerotium cepivorum (Allium
White Rot) activities by electromagnetic waves at resonance frequency". Australian
Journal of Basic and Applied Science, 2009; 3(3): 1994-2000. ISSN 1991-8178.
21.Fadel, M. Ali, Reem H. Elgebaly, Amany A. Ali, Fakhry F. Ibrahim, "Control of Ehrlich
tumor growth in mice by electromagnetic wave at resonance frequency, in vivo",
Electromagnetic biology and medicine, 2005; 24: 9-12.
22.Fleischman G., Ravishankar S. and Balasubramaniam V." The inactivation of Listeria
monocytogenes by pulsed electric field (PEF) treatment in a static chamber." Food
Microbiol, 2004; 21: 91–95.
23.Fojt L., Strasak L., Vetterl V. and Smarda J." Comparison of the low-frequency magnetic
field effects on bacteria Escherichia coli, Leclercia adecarboxylata and Staphylococcus
aureus." Bioelectrochemistry, 2004; 63: 337–34.
24.Fox M., Esveld D., Mastwijk H. and Boom R." Inactivation of L. plantarum in a PEF
microreactor: The effect of pulse width and temperature on the inactivation." Innov. Food
Sci. and Emer. Technol, 2008; 9: 101–108.
25.Goodman R., Lin-Ye A., Geddis M.S., et al., “Extremely low frequency electromagnetic
fields activate the ERK cascade, increase hsp70 protein levels and promote regeneration
26.Grassi C., D'Ascenzo M., Torsello A. et al., “Effects of 50 Hz electromagnetic fields on
voltagegated Ca2+ channels and their role in modulation of neuroendocrine cell
proliferation and death,” Cell Calcium, 2004; 35(4): 307–315.
27.Jaegu C., Douyan W., Takao N., Sunao K., Hidenori A., Xiaofei L., Hiroshi S.,
Harumichi S., Hitoshi M. and Takeshi S." Inactivation of spores using pulsed electric
field in a pressurized flow system." J. Appl. Phys, 2008.l 104: 094701-094701-6.
28.Jeantet R., Baron F., Nau F., Rorgnant M. and Brule G. J. food prot, 1999; 62(12):
1381-1386.
29.Ji W., Huang H., Deng A. and Pan C." Effects of static magnetic fields on Escherichia
coli." Micron, 2009; 40: 894–898.
30.Joseph, L. W., and Thomas H. W. Varicella-zoster virus. Diagnostic procedures for viral,
rickettsial and chlamydial infections. 6th Edition, 1994; 379-406.
31.Khaki AA, Tubbs RS, Shoja MMet al. The effects of an electromagnetic field on the
boundary tissue of the seminiferous tubules of the rat: a light and transmission electron
microscope study. Folia Morphol 2006; 65(3): 188-94.
32.Lisi A., Ledda M., Rosola E. et al., “Extremely low frequency electromagnetic field,
2006.
33.Marin, J., Kese, D., Potocnik, M., and Rogl, B. M. Laboratory diagnosis of herpesviruses.
Dermatovenerologica, 2000; 9(3): 20-25.
34.Martin Blank and Reba Goodman, “Initial Interactions in Electromagnetic Field-Induced
Biosynthesis”, Journal of Cellular Physiology, 2004;199: 359–363.
35.Mohamed MK and El-Said Aoun A. Epidemiology, prevention and control programs of
Hepatitis C in Egypt. Available at:
http://www.vhpb.org/files/html/Meetings_and_publications/VHPB_Meetings/geneva2002
/S5BP1%20Mohamed.ppt
36.Morabito C., Rovetta F., Bizzarri M., Mazzoleni G., et al., “Modulation of redox status
and calcium handling by extremely low frequency electromagnetic fields in C2C12
muscle cells: a real-time, single-cell approach,” Free Radical Biology and Medicine,
2010; 48(4): 579–589.
37.Moretti, F., Uberti-Foppa, C., Quiros-Roldan, E., Fanti, L., Lillo, F., and Lazzarin, A.
Oesophagobronchial fistula caused by varicella zoster virus in a patient with AIDS: a
38.Moshe G., Yaara P., Alexandra B., Yoram W., et al., “Microbial Growth Inhibition by
Alternating Electric Fields” Antimicrobial Agents and Chemotherapy, 2008; 52(10):
3517–3522.
39.Op De Beeck A, Dubuisson J. Topology of hepatitis C virus envelope glycoproteins. Rev
Med Virol, 2003; 3(4): 233-41. Available at:
http://upload.wikimedia.org/wikipedia/en/9/96/HCV_structure.png
40.Paino IM, Marangoni VS, de Oliveira Rde C, Antunes LM, Zucolotto V. Cyto and
genotoxicity of gold nanoparticles in human hepatocellular carcinoma and peripheral
blood mononuclear cells. Toxicol Lett., 215: 119-125.
41.Piacentini R., Ripoli C., Mezzogori D., Azzena G.B., and Grassi C., “Extremely
lowfreauency electromagnetic fields promote in vitro neurogenesis via upregulation of
Cav1- channel activity,” Journal of Cellular Physiology, 2008; 215(1): 129–139.
42.Pothakamury U., Vega H., Zhany Q. Barbosa-Canovas G. and Swanson B.: J. food prot,
1996; 59: 1167–1171.
43.Ruiz-Gomez M., Sendra-Portero F. and Martinez-Morillo M." Effect of 2.45 mT
sinusoidal 50 Hz magnetic field on Saccharomyces cerevisiae strains deficient in DNA
strand breaks repair." Int. J. Radiat. Biol., 2010; 86: 602–611.
44.Schmutzhard, J., Merete, R., Zweygberg, W., and Grillner, L. Detection of herpes
simplex virus type 1, herpes simplex virus type 2 and varicella zoster virus in skin
lesions. Comparison of real-time PCR and virus isolation. J Clin Virol., 2004; 29(2):
120-6.
45.Segatore B., Setacci D., Bennato F., Cardigno R., et al., (2012), “Evaluations of the
effects of extremely low-frequency electromagnetic fields on growth and antibiotic
susceptibility of Escherichia coli and Pseudomonas aeruginosa,” International Journal of
Microbiology, 2012, Article ID 587293.
46.Shata MT, Barrett A, Shire NJ, et al. Characterization of hepatitis Especific cell-mediated
immune response using IFN-gamma ELISPOT assay. J Immunol Methods, 2007; 328:
152–61.
47.Simmonds P. Genetic diversity and evolution of hepatitis C virus – 15 years on. J Gen
Virol, 2004; 85: 3173-3188.
48.Stauber ER and Kessler HH. Drugs in development for hepatitis C. Drugs, 2008; 68(10):
49.Tagourti J., El May A., Aloui A., Chatti A., Aissa R. and Landoulsi A." Static magnetic
field increases the sensitivity of Salmonella to gentamicin." Ann Microbiol, 2010; 60:
519–522.
50.Vianale G., Reale M., Amerio P., Stefanachi M., Di Luzio S., and Muraro R., “Extremely
low frequency electromagnetic field enhances human keratinocyte cell growth and
decreases proinflammatory chemokine production,” British Journal of Dermatology,
2008; 158(6): 1189– 1196.
51.Wolf F. I., Torsello A., Tedesco B., et al., “50Hz extremely low frequency
electromagnetic fields enhance cell proliferation and DNA damage: possible involvement
of a redox mechanism,” Biochimica et Biophysica Acta, 2005; 1743; 1-2: 120–129.
52.Zare S, Alivandi S, Ebadi AG. Histological studies of the low frequency electromagnetic
fields effect on liver, testes and kidney in guinea pig. World Applied Sciences Journal,