Yadav et al. World Journal of Pharmaceutical Research
METHOD DEVELOPMENT AND VALIDATION FOR THE
ESTIMATION OF
SAROGLITAZAR IN PHARMACEUTICAL
DOSAGE FORM BY RP-HPLC
Nita Yadav* and Anju Goyal1
*
Faculty of Pharmacy, Pacific Academy of Higher Education and Research University,
Udaipur, RAJ.
1
B. N. Institute of Pharmaceutical Sciences, Udaipur, RAJ.
ABSTRACT
A simple, sensitive and rapid reverse phase high performance liquid
chromatographic method was developed for the estimation of
Saroglitazar in tablet dosage form. A C18 Inertsil ODS column (250 ×
4.6 mm, 5μm particle size) was used as a stationary phase with a
mobile phase containing a mixture of phosphate buffer and acetonitrile
in the ratio of 40:60, v/v. The flow rate was 1.0 mL/min. The effluent
was monitored at 294 nm and eluted at 2.162 min. Calibration curve
was plotted with a range from 20-100 µg/ml for Saroglitazar and the
correlation was found to be 0.999. The accuracy range was found
between 99.95 -101.07%. The % RSD values for both intraday and
interday precision were less than 2.0. The limit of detection (LOD) and
limit of quantification (LOQ) were found to be 1.405μg/ml and 4.260μg/ml respectively. The
assay was validated for the parameters like system suitability, precision, accuracy, and
robustness parameters. The proposed method can be useful for the routine determination of
Saroglitazar in pharmaceutical dosage form.
KEYWORDS: Saroglitazar, Calibration curve, RP-HPLC, Validation, ICH guidelines.
INTRODUCTION
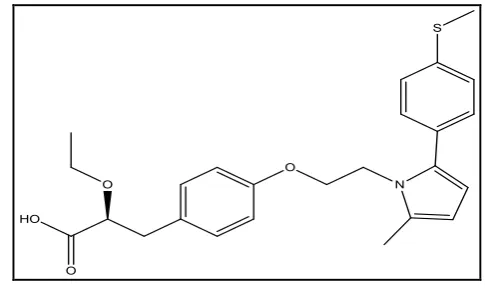
Saroglitazar, chemically, it is (2S) - 2- Ethoxy - 3- [4- (2- {2-methyl-5- [4-
(methylsulfanyl)phenyl] -1H-pyrrol-1-yl} ethoxy)phenyl] propanoic acid (Fig. 1). The
chemical formula is C25H29NO4S and the molecular weight is 439.56 g/mol.[1-3]
World Journal of Pharmaceutical Research
SJIF Impact Factor 7.523
Volume 6, Issue 10, 286-294. Research Article ISSN 2277– 7105
Article Received on 07 July 2017,
Revised on 28 July 2017, Accepted on 17 Aug. 2017
DOI: 10.20959/wjpr201710-9354
*Corresponding Author
Nita Yadav
Faculty of Pharmacy,
Pacific Academy of
Higher Education and
Research University,
Yadav et al. World Journal of Pharmaceutical Research
Figure 1: Structure of Saroglitazar.
Saroglitazar is used for the treatment of type 2 diabetes mellitus and dyslipidemia.
Saroglitazar is indicated for the treatment of diabetic dyslipidemia and hypertriglyceridemia
with type 2 diabetes mellitus not controlled by statin therapy. In clinical studies, saroglitazar
has demonstrated reduction of triglycerides (TG), LDL cholesterol, VLDL cholesterol,
non-HDL cholesterol and an increase in non-HDL cholesterol. It has also shown favorable glycemic
control by reducing the fasting plasma glucose in diabetes patients. The recommended dose
of saroglitazar is one tablet of 4 mg once a day. Saroglitazar is first in this class of drug which
acts as a dual PPAR agonist at the subtypes α (alpha) and γ (gamma) of the peroxisome
proliferator-activated receptor (PPAR). Agonist action at PPARα lowers high blood
triglycerides, and agonist action on PPARγ improves insulin resistance and consequently
lowers blood sugar.[4-6]
Literature surveys reveal various methods as UV[7-8], HPTLC[9], HPLC.[10-13] The simple, accurate, precise and validated method for determination of Saroglitazar was developed by
UV spectrophotometric method. The developed method was validated as per ICH
guidelines.[14]
EXPERIMENTAL
Reagents
The pure drug of saroglitazar was procured as gift sample from Swapnroop Pharmaceutical,
Aurangabad, Maharashtra. HPLC grade acetonitrile (ACN), distilled water and analytical
grade di-sodium hydrogen phosphate from Merck Pharmaceutical Private Ltd., Mumbai,
India were used. Lipaglyn tablets-Zydus Discovery a division of Cadila Healthcare Ltd.,
Ahmedabad (each tablet contains 4 mg of saroglitazar) were purchased from local market.
Membrane filters 0.45 μm and 0.2 μm were procured from Millipore Pvt. Ltd. Bangalore,
Yadav et al. World Journal of Pharmaceutical Research
Instrumentation
LC system used consist of pump (Model Shimadzu; LC-10 AT VP) with universal loop
injector (Rheodyne 7725 i) of injection capacity 20l. Detector consist of photodiode array
detector SPD-10 AVP.
Chromatographic conditions
The chromatographic separation was performed using a C18 Inertsil ODS column (250 × 4.6
mm, 5μm particle size). The mobile phase consists of a mixture of phosphate buffer and ACN
in ratio of 40:60, v/v. The mobile phase was set at a flow rate of 1 mL/min and the analytes
were monitored at 294 nm. The column was maintained at ambient temperature and injected
[image:3.595.165.427.333.480.2]volume was 20 μl. The total runtime was 10 min. The mobile phase was filtered through 0.2 μm membrane filter prior to use. A typical chromatogram of Saroglitazar is shown in Fig. 2.
Figure 2: Chromatogram of standard solution of saroglitazar.
Standard Preparation
Accurately weighed 40 mg pure drug of saroglitazar was transferred in a 100 mL clean, dry
volumetric flask and mobile phase was added and sonicated to dissolve. The volume was
made up to the mark with mobile phase to prepare 400 μg/mL stock solution. 1mL of this
solution was transferred into 10mL volumetric flask and volume was made up to the mark
with mobile phase to prepare 40 μg/mL standard solution.
Sample Preparation
For the estimation of saroglitazar in the tablet formulation, 20 tablets (label claim 4 mg)
were accurately weighed and the average weight per tablet was calculated. The tablets
Yadav et al. World Journal of Pharmaceutical Research
sonicated to dissolve. The volume was made up to the mark with mobile phase, mixed well to
prepare 200 μg/mL stock solution. The solution was filtered using 0.2 μm membrane filter
and degassed by sonication. 2mL of this solution was transferred into 10mL volumetric flask
and volume was made up to the mark with mobile phase to prepare 40 μg/mL test solution.
The resulting solution was used as the sample solution for chromatographic analysis. After
setting the chromatographic conditions and stabilizing the instrument to obtain a steady
baseline, the sample solution was loaded in the 20µl sample loop of the injection port. The
solution was injected five times and the peak areas were recorded.
METHOD VALIDATION
The developed method was validated as per ICH guidelines for its system suitability,
linearity, precision, accuracy, robustness, limit of detection (LOD) and limit of quantitation
(LOQ) by using the following procedures.
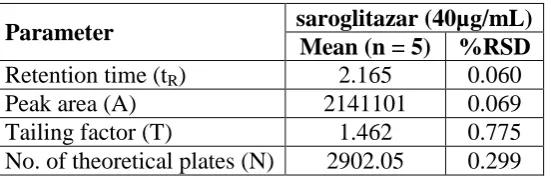
System suitability
System suitability test parameters for saroglitazar for the developed method are reported in
table 1. % RSD for tailing factor, theoretical plate count, peak area and retention time for
saroglitazar were found to be within the limit of 2%, which indicates suitability of the system.
The number of theoretical plates and tailing factor were found within the acceptance criteria
of >2000 and ≤2.0, respectively, indicating good column efficiency and optimum mobile
phase composition.
Table 1: Results from system-suitability study.
Parameter saroglitazar (40µg/mL) Mean (n = 5) %RSD Retention time (tR) 2.165 0.060
Peak area (A) 2141101 0.069
Tailing factor (T) 1.462 0.775 No. of theoretical plates (N) 2902.05 0.299
Linearity
Linearity of this method was evaluated by linear regression analysis and calculated by least
square method and studied by preparing standard solutions of Saroglitazar at different
concentration levels. Peak area of resulting solutions was measured and the calibration curve
was plotted between peak area and concentration of the drug (Fig. 3). The response was
found to be linear in the range 20-100µg/ml for Saroglitazar. The data was given in table 2,
[image:4.595.163.439.526.616.2]Yadav et al. World Journal of Pharmaceutical Research
Figure 3: Calibration curve for standard solution of saroglitazar.
Table 2: Linearity data of saroglitazar.
S.No. Conc. (µg/ml) * Peak Area
1. 20 1065137
2. 40 2142713
3. 60 3172338
4. 80 4279234
5. 100 5370705
*
Peak area mean of three replicates.
Table 3: Results of regression analysis of saroglitazar.
Parameter Saroglitazar
Linearity range (µg/ml) 20-100 Regression equation (y = mx+c) y = 53738x - 18272
Slope (m) 53738
Intercept (c) 18272
Correlation coefficient (R²) 0.999 Limit of detection (μg/ml) 1.405 Limit of quantitation (μg/ml) 4.260
Accuracy
Accuracy was performed in triplicate for various concentrations of Saroglitazar equivalent to
80%, 100% and 120% of the active ingredient, by adding a known amount of saroglitazar
standard to a fixed amount of the preanalysed sample of saroglitazar. The recovered amount
of saroglitazar, % recovery and %RSD of each level was calculated. The data was given in
Yadav et al. World Journal of Pharmaceutical Research
Table 4: Accuracy data for saroglitazar.
Accuracy Level (%)
Amount Added (μg/ml)
Amount Recovered
(μg/ml) %Recovery Mean SD %RSD
80
32 32.09 100.29
101.07 0.71 0.71
32 32.38 101.21
32 32.54 101.71
100
40 39.99 99.98
99.95 0.27 0.27
40 39.86 99.66
40 40.08 100.21
120
48 47.66 99.29
100.05 0.68 0.68
48 48.11 100.23
48 48.30 100.63
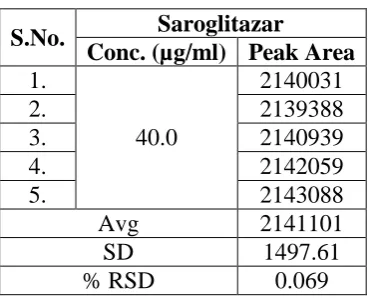
Precision
Repeatability
Five sample solutions of the same concentration were prepared and injected into the HPLC
[image:6.595.206.391.377.526.2]system as per test procedure. The results were given in table 5.
Table 5: Repeatabilty study for saroglitazar.
S.No. Saroglitazar
Conc. (µg/ml) Peak Area 1.
40.0
2140031
2. 2139388
3. 2140939
4. 2142059
5. 2143088
Avg 2141101
SD 1497.61
% RSD 0.069
Precision (Day to Day variability)
Intra-day precision was investigated by replicate applications and measurements of peak area
for saroglitazar for three times on the same day under similar conditions. Inter-day precision
was obtained by repeating the assay three times on different days. The percent relative
standard deviation (% RSD) was calculated. The results were given in table 6.
Table 6: Precision study for saroglitazar.
Conc. (μg /mL)
Yadav et al. World Journal of Pharmaceutical Research
Limit of detection and Limit of Quantification
LOD and LOQ were calculated from the average slope and standard deviation from the
calibration curve as per ICH guidelines.
Robustness
Robustness of an analytical method is a measure of its capacity to remain unaffected by small
but deliberate variations in method parameters and provide an indication of its reliability
during normal usage. Robustness can be determined by analysis of solution by changing
physical parameters like composition of mobile phase and flow rate, In order to measure the
extent of method robustness, the parameters were interchanged while keeping the other
parameters unchanged and in parallel, the chromatographic profile was observed and
recorded. The results by small variations in these parameters as shown in table 7.
Table 7: Robustness study for saroglitazar
S.
No Parameter
Optimized values
Robust conditions
Retention time (tR), min
Plate count(N)
Tailing factor (T)
1 Flow rate 1.0
mL/min 1.1 mL/min 0.9 mL/min 1.925 2.384 2771 2749 1.342 1.387 2 Mobile phase composition (Phosphate Buffer:ACN)
40:60 35:65 45:55 1.946 2.381 2815 2749 1.462 1.256
Acceptance criteria: Tailing Factor (T) < 2.0, Plate count (N) > 2000, significant change in
Retention time (Rt).
Assay
The developed method was applied to the assay of saroglitazar tablets. From the peak areas
the amount of drug present in tablet was estimated. The drug content was calculated as an
average of three determinations and assay results were shown in Table 8. The results were
very close to the labeled value of commercial tablets. The representative chromatogram of
saroglitazar is shown in Fig. 4.
Table 8: Results of analysis of formulation
Formulation
name Label Claim (mg)
Amount found (mg) % Label claim Lipaglyn (Zydus Discovery)
4 3.983 99.59
4 4.003 100.08
4 4.030 100.75
Mean 4.005 100.14
Yadav et al. World Journal of Pharmaceutical Research
Figure 4: Chromatogram of saroglitazar in tablet formulation.
RESULTS AND DISCUSSION
A reverse-phase HPLC method was proposed as a suitable method for the determination of
Saroglitazar in tablet dosage form. The chromatographic conditions were optimized by
changing the mobile phase composition. Different ratios were experimented to optimize the
mobile phase. Finally, phosphate buffer and acetonitrile in the ratio 40:60 v/v was used as
mobile phase, which showed good resolution of Saroglitazar peak. The wavelength of
detection selected was 294 nm, as the drug showed sharp and better peak shape at this
wavelength. By developed method the retention time of Saroglitazar was about 2.162 min.
The statistical analysis of data and the drug recovery data showed that the method was
simple, rapid, economical, sensitive, precise and accurate. It can thereby easily adopt for
routine quality control analysis. The results of this analysis confirmed that the developed
method was suitable for determination of drug in pharmaceutical formulation has no
interference of additives. Hence the developed method can be applied for estimation of
saroglitazar in marketed formulation.
CONCLUSION
The developed method is rapid, accurate and sensitive. It makes use of fewer amounts of
solvents and change of set of conditions requires a short time. This method can be suitably
analyzed for the routine analysis of saroglitazar in tablet dosage form. It does not suffer from
any interference due to common excipients present in pharmaceutical preparation and can be
conveniently adopted for quality control analysis.
ACKNOWLEDGEMENTS
The authors express their sincere gratitude to Swapnroop Pharmaceuticals, Aurangabad,
Maharashtra, India for providing the pure drug sample of saroglitazar and are also thankful to
Yadav et al. World Journal of Pharmaceutical Research
REFERENCES
1. www.en.wikipedia.org/wiki/Saroglitazar.
2. www.pubmed.pharmacol.com/Saroglitazar.
3. www.Rx list .com/Saroglitazar.
4. Braith WA and Smith FJ. Chromatographic Methods. 5th ed., Kluwer; Academic
Publisher, 1996; 1-2.
5. Agarwal R, The first approved agent in the Glitazar's Class: Saroglitazar, PubMed.gov.
6. Andrea W and Phyllisr B. HPLC Principle and Practice. 1st ed., Academic press, 1997;
24-37.
7. Ekta HA and Maheshwari DG. Development and Validation of UV Spectrophotometric
Method for Saroglitazar Tablets. J of Pharm Sci and Biol Res, 2014; 4(5): 312-315.
8. Manjusha DK and.Barhate VD. Development of Spectrophotometric method of
Saroglitazar in Bulk and Pharmaceutical formulations using 1, 10 – phenanthroline. Int J
of adv in Pharm Biol and Chem, 2015; 4(3): 48-553.
9. Patel NM, Mehta FA, Shah DA and Chhalotiya UK. Development and Validation of
HPTLC Method for Estimation of Saroglitazar in Bulk and Pharmaceutical Dosage Form.
Austin J of Anal and Pharm Chemi, 2015; 2(2): 01-04.
10.Siddartha B and Babu S. Method development and validation for the estimation of
saroglitazar in bulk and pharmaceutical dosage form by RP-HPLC. World J of Pharm and
Pharm Sci., 2014; 3(9): 567-575.
11.Rao KH, Lakshmana RA and Sekhar KB. Method Development and Validation for the
Estimation of Saroglitazar in Bulk and Pharmaceutical Dosage Form by RP-HPLC. I J of
Pharm and Pharmacol, 2015; 2(3):150-154.
12.Kapavarapu S, Golkonda R and Chintala R. Validated stability indicating RP – HPLC
method development for the determination of saroglitazar in bulk and pharmaceutical
dosage form. Indo American J of Pharm Res., 2015; 5(3): 1255-65.
13.Sripriya P, Sowjanya NG, Ajitha A, Uma V and Rao M. Stability indicating RP-HPLC
method development and validation for estimation of saroglitazar in bulk and tablet
dosage form. World J of Pharm Res., 2015; 4(8): 2361-2372.
14.ICH, Q2 (R1), Harmonized Tripartite Guideline, Validation of Analytical procedures
Text and methodology. International Conference on Harmonization (ICH), Geneva, Nov,