DEVELOPMENT AND VALIDATION OF UV SPECTROSCOPY
METHOD FOR ESTIMATION OF LANSOPRAZOLE
Imran Tadwee1*, Pavankumar Ade2, Pravin Bhalerao2, Arshiya Khan2 and
Dr. Sadhana Shahi2
1
Y. B. Chavan College of Pharmacy Aurangabad, India.
2
Government College of Pharmacy Aurangabad, India.
ABSTRACT
The aim of study is to develop and validate simple, accurate, rapid, precise, reproducible and cost effective spectrophotometric method for the quantitative estimation of lansoprazole in a pharmaceutical formulation. The developed UV spectrophotometric method for the quantitative estimation of lansoprazole is based on measurement of absorption maximum wavelength 281.6 nm using pH 6.8 buffer. The stock solution of lansoprazole was prepared, and subsequent suitable dilution was prepared in purified water to obtained standard curve.. Lansoprazole drug showed max at 281.6nm. The calibration curve yielded correlation coefficient (r2 ) of 0.99732. The regression equation was found to be Y=0.0057 x -0.02407 with good linearity. Method is successfully developed and validated as per ICH and can be utilized in quality control analysis of lansoprazole from formulation.
KEYWORDS: Lansoprazole, UV spectroscopy, Analyitcal method development, Validation.
INTRODUCTION
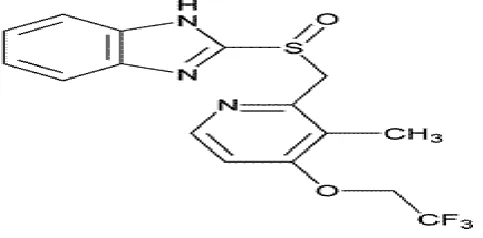
Lansoprazole (LNZ) is a proton pump inhibitor, which decrease the amount of acid produced in the stomach. it is used to treat and prevent stomach and intestinal ulcer erosive esophagitis. (Damage to the esophagus from stomach acid) as well as other condition involving excessive stomach acid such as zollinger-Ellison syndrome. Lansoprazole is a substituted benzamidazole 2-{3-methyl-4-{2, 2, 2- trifluoroethoxy} pyridine -2yl) methyl sulfinyl -1 H – Benzamidazole. Molecular basis of lansoprazole (LNZ) reveals that it is a proton pump
Volume 6, Issue 17, 915-924. Research Article ISSN 2277–7105
*Corresponding Author Imran Tadwee
Y.B. Chavan College of
Pharmacy Aurangabad, India.
Article Received on 29 Oct. 2017,
Revised on 20 Nov. 2017, Accepted on 11 Dec. 2017,
hydrogen / potassium adenosine triphosphate (H+/ K+ ATPase) at the secretory surface of the gastric parietal cell and it is used in the treatment of various gastric disorders such as gastric and duodenal ulcer, gastro esophageal reflux disease and in pathological hyper secretory condition, method is validated according ICH guidelines.
Fig. 1: Structure of Lansoprazole.
MATERIALS AND METHOD
Instrument
The analytical method was developed using Shimadzu UV 1700 spectrophotometer. The instrument consisted of matched quartz cells with 1 cm path length. Other instruments used were Ultrasonicater (Toshcon) and weighing balance (A&D Company Ltd.).
Material Reagents and Solvents
Lansoprazole was gifted from Wockhardt Pharmaceuticals, Ortho dihydrogen phosphate Water etc all are of analytical grade.
Media: The buffer solution pH 6.8 was prepared using distilled water form purification unit.
METHOD DEVELOPMENT
Preparation of 0.01 M Phosphate Buffer
Preparation of 0.01M phosphate buffer: 7g of Potassium dihydrogen orthophosphaste was weighed accurately and dissolved in about 500 ml of distilled water and diluted with distilled water upto 1000 ml, and the pH was adjusted upto 6.8 with the sodium hydroxide solution and filtered through 0.45μ Whatmann filter paper .This buffer solution was used as diluent.
Preparation of standard solution: Standard stock solution of LNZ (100 μg /ml) was
plotted taking an absorbance on Y-axis against concentration of standard solution on X-axis (Fig-2). The method was applied for known sample solution and was found to be satisfactory for the analysis of Capsule dosage forms.
Selection of wavelength for analysis of Lansoprazole
1 ml of stock II was transferred to 10 ml volumetric flask and diluted to 10 ml to give a concentrartion of 10 mcg/ml and this was used for initial spectral scan in the UV range of 400-200 nm to detect maximum wavelength and further dilutions can be prepared from the stock solution.
Preparation of serial dilutions
The serial dilutions were prepared from standard stock II solution to give respective concentrations of 6, 12, 18, 24,and 30 mcg/ml.
METHOD VALIDATION[1]
The proposed method was validated for various parameters such as linearity and range, accuracy, precision, limit of detection (LOD), limit of quantitation (LOQ), robustness, ruggedness, sensitivity and specificity according to ICH Q2 (R1) guideline and USP guidelines.
Linearity and range
The ability of an analyticl procedure to obtain test results which directly proportional to the concentration of an analyte present in the sample is called linearity of the method. Range of an analytical procedure is the interval between upper and lower concentration of an analyte in the sample for which it has been demonstrated the method has suitable level of precision, accuracyand linearity. Triplicate analysis (n=3) was done to determine the results. A graph is plotted for concentration (mcg/ml) vs absorbance. The correlation coefficient and linear regression equation can be obtained from the graph using the UV probe software.
Accuracy
The accuracy of an analytical procedure expresses the closeness of agreement between the value which is accepted either as a conventional true value or an accepted reference value and the value found. The accuracy of the method was studied by recovery experiments. The recovery was performed at three levels 80, 100 and 120% of standard concentration. The recovery samples were prepared for each recovery level. The final concentration of Lansoprazole was determined at each level of the amount; three determinations were performed and percentage recovery calculated as meanstandard deviation using calibration curve.
Precision
The precision of an analytical procedure expresses the closeness of agreement (degree of scatter) between a series of measurements obtained from multiple sampling of the homogeneous sample under the prescribed conditions. The precision of the method was demonstrated by intra-day and inter-day variation studies. In the intra-day precision study, three different solutions of same concentration were prepared and analysed in the same day (morning, noon and evening), whereas in the inter-day precision study, the solutions of same concentration were prepared and analysed, for three consecutive days, and the absorbances were recorded. All study was performed in triplicates. The result was indicated by calculating % RSD.
Limit of detection (LOD): The detection limit of an individual analytical procedure is the lowest amount of analyte in a sample, which can be detected but not necessarily quantified as an exact value. The limit of detection (LOD) was determined by preparing solutions of different concentrations from 6-30μg/ml.
LOD = 3.3 σ/S
Where,
σ=Standard deviation S= Slope
Limit of quantification(LOQ)
LOQ=10σ/S Where,
σ=Standard deviation S= Slope
Ruggedness (by two different analyst)
The ruggedness is a degree of reproducibility of test result under verification of condition like a different analyst, different instruments and different days.
To establish ruggedness of the proposed method, the solutions of 30 µg/ml of standard solution was prepared and analysed with the change in the different analyst.
Robustness
The robustness of an analytical procedure is a measure of its capacity remains unaffected by small, but deliberate variations in method parameters and provides an indication of its reliability during normal usage.Analysed by a change in wavelength. The wavelength was selected max ± 2 i.e. 279.6 and 283.6 nm respectively for standard solution.
RESULTS AND DISCUSSIONS
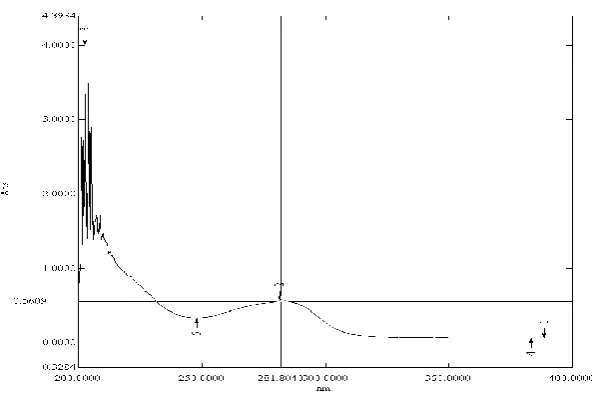
Selection of wavelength
[image:5.595.145.442.541.738.2]The spectrum of in pH 6.8 buffer showed maximum absorbance at 281.6nm which complies with reported max. Hence this wavelength was selected as max of Lansoprazole in pH 6.8 buffer for further use.
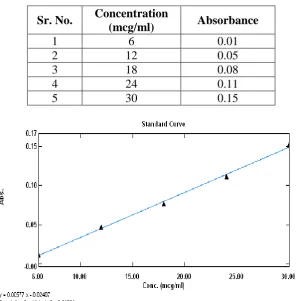
Linearity and range: The linearity response of the drug was verified at 6-30 mcg/ml concentrations. The calibration graphs were obtained by plotting the absorbance versus concentration data. The data obtained was subjected to linear regression analysis. The equation of calibration curve for Lansoprazole obtained is y = 0.00577x - 0.02407. The linearity range of curve was found to be 6-30 mcg/ml concentrations. The correlation coefficient (r2) of determination was 0.997. The linearity is shown in table.1 and fig.2.
Table. 1: Calibration curve for Lansoprazole.
Sr. No. Concentration
(mcg/ml) Absorbance
1 6 0.01
2 12 0.05
3 18 0.08
4 24 0.11
5 30 0.15
Fig. 2: Calibration of Lansoprazole.
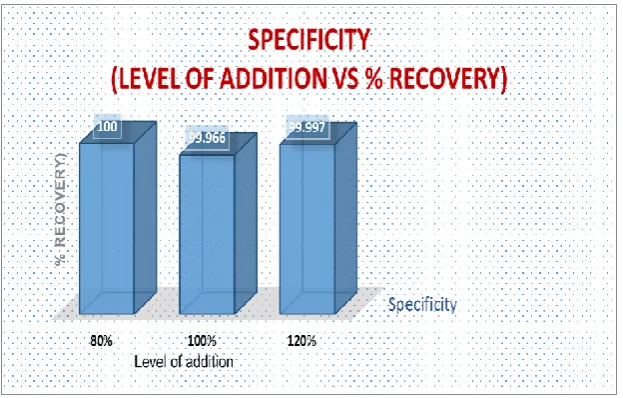
Table. 2: Specificity study of Lansoprazole.
Level of addition
Standard API (µg/ml)
Lactose (µg/ml)
Total concentration
(µg/ml)
Absorbance Drug recovered
(µg/ml)
% Recovery
Mean % Recovery
80% 18 14.4 32.4 0.0801 18.00 100.00
100.00 18 14.4 32.4 0.0801 18.00 100.00
18 14.4 32.4 0.0803 18.001 100.03 100% 18 18 36 0.0802 18.00 100.00
99.966 18 18 36 0.0802 18.0033 100.06
18 18 36 0.0803 18.9949 99.898 120% 18 21.6 39.6 0.0801 18.0016 100.03
99.997 18 21.6 39.6 0.0803 17.9966 99.932
Fig. 3: Specificity for lansoprazole at different level of addition.
Accuracy (Recovery Test)
Accuracy was studied by recovery experiments. The recovery was performed at three levels 80, 100 and 120% of Lansoprazole standard concentration. The recovery samples were prepared as per above mentioned procedure. The samples were prepared for each recovery level. The solutions were then analysed and the percentage recovery were calculated from calibration curve. The recovery value for Lansoprazole was 97.21 0.9604
Table. 3: Recovery of Lansoprazole.
Level of addition
Standard API (mcg/ml)
Formulation stock added
(mcg/ml)
Total conc.
(mcg/ml) Absorbance
Drug recovery (mcg/ml)
% recovery
0.156 31.253 96.45 80% 18 14.4 32.4 0.156 31.423 96.98 0.157 31.981 98.70 0.178 34.853 96.81 100% 18 18 36 0.177 34.987 97.18 0.177 35.012 97.25 0.197 38.482 97.17 120% 18 21.6 39.6 0.197 38.975 98.42 0.198 39.214 99.02
Table. 4: Statistical validation of recovery studies.
Level of addition
% recovery
(mean SD) % RSD SE Conclusion
Results obtained were found to be within range of pharmacopoeias standard for Lansoprazole. Limit for %accuracy is NMT 5% RSD.
Precision
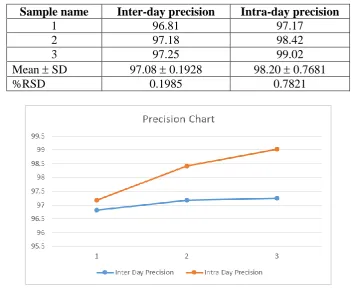
[image:8.595.119.471.282.572.2]The precision of proposed method was determined by Intra-day and Inter-day precision, and it was expressed in terms of percent relative standard deviation (%RSD). The reproducibility (inter-day precision) of the method and repeatability (intra-day) was evaluated in the same laboratory. For Inter-day and Intra-day %RSD were found in the range of 0.1985 and 0.7821 respectively as shown in table 5 & fig. 4
Table. 5: Precision determination.
Sample name Inter-day precision Intra-day precision
1 96.81 97.17
2 97.18 98.42
3 97.25 99.02
Mean SD 97.08 0.1928 98.20 0.7681
%RSD 0.1985 0.7821
Fig. 4: Precision chart for Lansoprazole.
Limit of detection (LOD): LOD was determined by using the formula in equation.1 and was
found to be 0.2750 mcg/ml. From this value it could be conclude that the concentration of Lansoprazole as less as 0.2750 mcg/ml can be successfully detected.
Limit of quantification (LOQ): LOQ was also determined using equation.2 and was found
to be 0.8336 mcg/ml. from this value it could be concluded that concentration of Lansoprazole above 0.8336 mcg/ml can be productively quantified.
Table. 6: Ruggedness data for Lansoprazole.
Observation Analyst 1 Analyst 2
Absorbance 0.1502 0.1500 0.1502 0.1493 0.1501 0.1499 Mean* 0.1501 0.1497 SD 0.0005 0.0005 %RSD 0.3331 0.3340 *(n=3)
Table. 7: Robustness data for Lansoprazole.
Wavelength (nm) Absorbance Mean absorbance±SD %RSD
279.6 0.5843
0.5850±0.0001 0.0170 279.6 0.5854
279.6 0.5854 281.6 0.5652
0.5653±0.00011 0.0176 281.6 0.5654
281.6 0.5655 283.6 0.5422
0.5432±0.0001 0.0184 283.6 0.5422
283.6 0.5452
Robustness
Robustness of this method was determined by analysing the Lansoprazole standard solution of 8 μg/ml at a different wavelength (i.e. λ max±2). Absorbance was measured. The standard deviation and percent relative standard deviation was calculated. Results of robustness study indicate that the selected factor remained unaffected by small variation with RSD 0.0170-0.0184 confirms the robustness of the method.
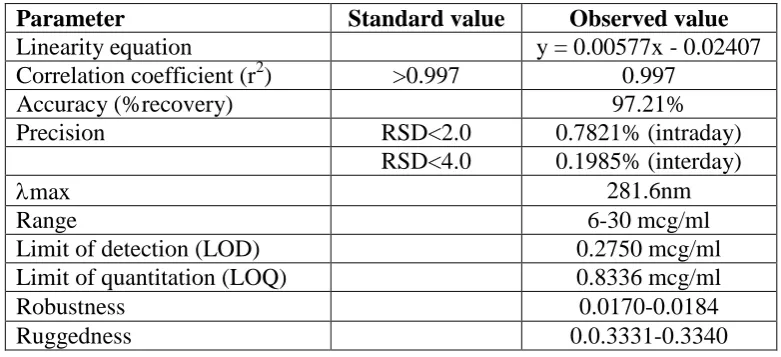
Table. 6: Summary of Validation parameters.
Parameter Standard value Observed value
Linearity equation y = 0.00577x - 0.02407 Correlation coefficient (r2) >0.997 0.997
Accuracy (%recovery) 97.21% Precision RSD<2.0 0.7821% (intraday)
RSD<4.0 0.1985% (interday)
max 281.6nm
Range 6-30 mcg/ml
Limit of detection (LOD) 0.2750 mcg/ml Limit of quantitation (LOQ) 0.8336 mcg/ml
Robustness 0.0170-0.0184
CONCLUSION
The simple, rapid, precise, and economical spectrophotometric method has been developed for the quantitative estimation of Lansoprazole. The method is validated as per the ICH and USP guidelines, and it is found that the developed method is precise. Hence, this method can be successfully and suitably used for routine quality control analysis of Lansoprazole in pharmaceutical dosage form.
CONFLICT OF INTEREST
Authors declare no confilict of interest
REFERENCES
1. Richardson P, Hawkey C, Stack W. Proton pump inhibitors spharmacology and rationale for use in gastrointestinal disorders. Drugs, 1998; 56(3): 307-35.
2. Micromedex- Drugdex Evaluations. 2000. 9. Feret B, Quercia R, Cappa J. Rabeprazole: A proton pump inhibitor for the treatment of acid-related disorders. Formulary, 1999; 34: 313-23.
3. Reilly JP. Safety profile of the Protonpump inhibitors. Am J Health Syst Pharm 1999; 56(23 suppl 4): S11-7.
4. Rabeprazole (Aciphex). Package insert. Titusville, N.J.: Janssen Pharmaceutica, 1999. Retrieved May 2002: http://us.janssen.com/products/pi_fil es/aci8.5x11.pdf.
5. International Conference on Hormonisation of Technical Requirements for Registration of Pharmaceuticalsfor Human Use, ICH Harmonised Tripartite Guideline, Validation of Analytical Procedures: Text and Methodology Q2(R 1), Complementary Guideline on Methodology dated 06November 1996, incorporated in November 2005, London.
6. Bassett, R. C. Denney, G. H. Jefferey, J. Mendham “ Vogel’s Quantitative Inorganic Analysis”English Language Book Society and Longman, Essex., 4th Edn, 1978; 360. 7. Patel PM, Desai HJ, Patel RC, Patel NM.Spectrophotometric method for estimation of