Received 24 December 2019 Accepted 2 March 2020
Edited by W. T. A. Harrison, University of Aberdeen, Scotland
Keywords:crystal structure; mannitol; molyb-denum complex; hydrogen bond.
CCDC reference:1965028
Supporting information:this article has supporting information at journals.iucr.org/e
A redetermination of the crystal structure of the
mannitol complex NH
4[Mo
2O
5(C
6H
11O
6)]H
2O:
hydrogen-bonding scheme and Hirshfeld surface
analysis
Masoud Mirzaei,aMorteza Tahmasebiaand Joel T. Magueb*
a
Department of Chemistry, Ferdowsi University of Mashhad (FUM), Mashhad, PO Box 917751436, Iran, and
b
Department of Chemistry, Tulane University, New Orleans, LA 70118, USA. *Correspondence e-mail: [email protected]
The redetermined structure [for the previous study, see: Godfrey & Waters (1975). Cryst. Struct. Commun. 4, 5–8] of ammonium -oxido- -[1,5,6-trihydroxyhexane-2,3,4-tris(olato)]bis[dioxidomolybdenum(V)] monohydrate, NH4[Mo2(C6H11O6)O5]H2O, was obtained from an attempt to prepare a glutamic acid complex from the [Co2Mo10H4O38]6 anion. Subsequent study indicated the complex arose from a substantial impurity of mannitol in the glutamic acid sample used. All hydrogen atoms have been located in the present study and the packing displays N—H O, O—H O and C—H O hydrogen bonds. A Hirshfeld surface analysis was also performed.
1. Chemical context
Over the past few years, there has been considerable interest in derivatives of polyoxo- and heteropolyxometallates for both biological and materials applications, particularly where chirality may be conferred by the attachment of chiral ligands (Arefianet al., 2017; Proustet al., 2012; Mirzaeiet al., 2014; An
et al., 2006). Recently our group prepared the aspartate complex [Co2(C4H6NO4)2(-Mo8O26)(H2O)10]4H2O from (NH4)6[Co2Mo10H4O38], andl-aspartic acid (Tahmasebiet al., 2019) and have now proceeded to explore the generality of this reaction with other chiral amino acids. We report here on the reaction of the heteropolyoxometallate with l-glutamic acid from which a mannitol complex of molybdenum was obtained as a result of the unexpected presence of a substantial impurity of mannitol in the glutamic acid sample used.
2. Structural commentary
Instead of the expected complex containing glutamate ligands, the crystals obtained were found to have a unit cell essentially identical to that reported previously for a compound formu-lated as NH4[Mo2O5(C6H12O6)]H2O (Godfrey & Waters, 1975) and the structure obtained indicates that it is the same complex. Subsequent to the identification of the product as a mannitol complex, the original sample of glutamic acid was checked by 1H and 13C NMR spectroscopy and found to contain a significant amount of mannitol as an impurity, thus explaining the formation of the title complex. A comparison of the geometry of the {Mo2O9} skeleton found in the present study with that in the previous report (Table 1) indicates the
two to be essentially identical, although the present structure, using low-temperature data and more modern instrumenta-tion and software, is of improved precision. A particular feature is that all hydrogen atoms could be located in a difference map and those attached to the oxygen atoms of the mannitol ligand could be refined (although we ultimately chose to fix them in idealized positions because of the presence of heavy metal atoms), making it abundantly clear that three hydroxyl groups on the ligand are deprotonated and also providing a more complete description of the inter-molecular hydrogen-bonding scheme. The terminal Mo O distances (Table 1 and Fig. 1) are short, indicating a degree of multiple bonding while those to O6 and O9 are longer and consistent with single bonds. For the bridging oxygen atoms, O5, O8 and O7, the Mo—O distances for O7 are about the same as for those to O6 and O9, consistent with this atom being a bridging oxide ion. Those to O8 are somewhat longer, as expected for a bridging alkoxide ion, while those to O7 are considerably longer. The previous authors (Godfrey & Waters, 1975) attributed this ‘at least in part to stereochemical strain’ but there is no indication from the relevant bond angles that this is the case. Having located all of the hydrogen atoms, we see that O7 is a hydroxyl group and so would be expected to be less strongly bound to the metal than the anionic oxygen atoms. The Mo1 Mo2 separation is 3.1579 (7) A˚ .
3. Supramolecular features
The presence of the ammonium ion, water molecule of crys-tallization and the remaining hydroxyl groups on the mannitol ligand generates an extensive hydrogen-bonding network in the crystal, which was alluded to in the previous work (Godfrey & Waters, 1975) but not described. From Table 2, it may be seen that each ammonium ion connects three adjacent anions through N1—H1D O1i, N1—H1E O2iiand N1— H1F O1iiihydrogen bonds [symmetry codes: (i)1 +x,y,z; (ii)1 +x,1 +y,z; (iii) 1x,12+y,z] while each water molecule connects anions by O12—H12A O4vand O12— H12B O11vihydrogen bonds [symmetry codes: (v)x,1 +y,
z; (vi) 1x,1
2+y, 1z]. The anion atx,y,zis connected to one at (1x, 1
2+ y, z) by an O7—H7 O5 iii
hydrogen bond and to one at (1 x, 1
2 + y, 1 z) by an O10—
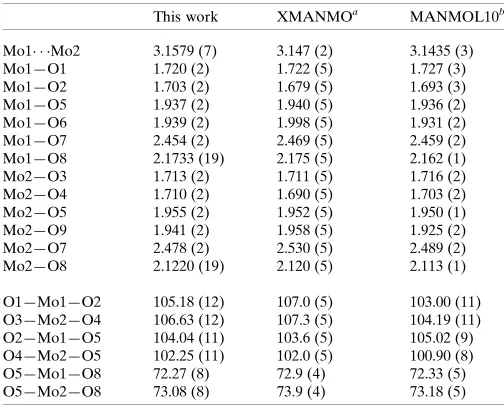
Table 1
Comparison of the geometries of the {Mo2O9} fragment (A˚ ,).
This work XMANMOa MANMOL10b
Mo1 Mo2 3.1579 (7) 3.147 (2) 3.1435 (3)
Mo1—O1 1.720 (2) 1.722 (5) 1.727 (3)
Mo1—O2 1.703 (2) 1.679 (5) 1.693 (3)
Mo1—O5 1.937 (2) 1.940 (5) 1.936 (2)
Mo1—O6 1.939 (2) 1.998 (5) 1.931 (2)
Mo1—O7 2.454 (2) 2.469 (5) 2.459 (2)
Mo1—O8 2.1733 (19) 2.175 (5) 2.162 (1)
Mo2—O3 1.713 (2) 1.711 (5) 1.716 (2)
Mo2—O4 1.710 (2) 1.690 (5) 1.703 (2)
Mo2—O5 1.955 (2) 1.952 (5) 1.950 (1)
Mo2—O9 1.941 (2) 1.958 (5) 1.925 (2)
Mo2—O7 2.478 (2) 2.530 (5) 2.489 (2)
Mo2—O8 2.1220 (19) 2.120 (5) 2.113 (1)
O1—Mo1—O2 105.18 (12) 107.0 (5) 103.00 (11)
O3—Mo2—O4 106.63 (12) 107.3 (5) 104.19 (11)
O2—Mo1—O5 104.04 (11) 103.6 (5) 105.02 (9)
O4—Mo2—O5 102.25 (11) 102.0 (5) 100.90 (8)
O5—Mo1—O8 72.27 (8) 72.9 (4) 72.33 (5)
O5—Mo2—O8 73.08 (8) 73.9 (4) 73.18 (5)
[image:2.610.44.296.92.295.2]Notes: (a) Godfrey & Waters (1975); (b) Hedman (1977).
Table 2
Hydrogen-bond geometry (A˚ ,).
D—H A D—H H A D A D—H A
N1—H1D O1i 0.88 2.46 3.272 (4) 154
N1—H1E O2ii 0.88 2.22 3.066 (4) 162
N1—H1F O1iii 0.88 1.95 2.831 (4) 177
O7—H7 O5iii 0.87 1.72 2.589 (3) 178
O10—H10 O8iv 0.87 2.37 3.137 (3) 148
O12—H12A O4v 0.87 2.01 2.845 (4) 162
O12—H12B O11vi 0.87 2.02 2.812 (3) 151
C4—H4 O10iv 1.00 2.37 3.243 (4) 145
C5—H5 O10vii 1.00 2.58 3.491 (4) 151
Symmetry codes: (i) x1;y;z; (ii) x1;y1;z; (iii) xþ1;y1 2;z; (iv)
xþ1;y1
2;zþ1; (v) x;y1;z; (vi) x;y12;zþ1; (vii)
[image:2.610.46.296.520.710.2]xþ1;yþ1 2;zþ1.
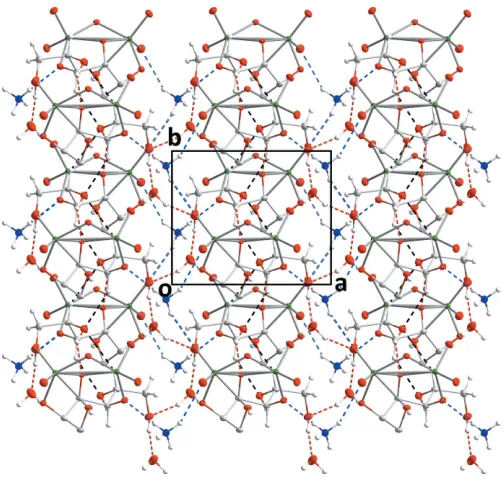
Figure 1
H10 O8ivhydrogen bond. Two C—H O hydrogen bonds, one relatively strong and the other weak (Table 2) complete the intermolecular interactions The result is a structure in which layers of anions, formed by the O—H O and C— H O hydrogen bonds between them, are arranged parallel to thebcplane and are connected along thea-axis direction by the O—H O and N—H O hydrogen bonds to the cation and the water molecule of crystallization (Figs. 2 and 3).
4. Database survey
A search of the Cambridge Crystallographic Database (CSD version 5.41 updated to November 2019; Groom,et al., 2016) for a triply deprotonated mannitol ion with two Group 6 metals attached found only (NH4)[Mo2O5(C6H12O6)]H2O (XMANMO; Godfrey & Waters, 1975) and Na[Mo2O5
[image:3.610.46.295.71.214.2](-C6H12O6)]2H2O (MANMOL10; Hedman, 1977). From Table 1, the geometries of the {Mo2O9} core in all three structures are quite comparable. The packing in MANMOL10 is also quite similar to that seen in the present work, parti-cularly when viewed along theb-axis direction although the channel (Fig. 2) between anions contains sodium cations in place of ammonium cations so there are different hydrogen-bonding interactions.
5. Hirshfeld surface analysis
[image:3.610.313.564.74.147.2]The calculation and analysis of the Hirshfeld surface (McKinnon et al., 2007; Spackman & Jayatilaka, 2009) can provide information on the presence and directionality of packing interactions in a crystal; for example, strong and weak hydrogen bonds and -stacking and C—H (ring) inter-actions. The characteristics and appearance of the Hirshfeld surface and related surfaces and fingerprint plots that can be generated withCrystalExplorer 17(Turneret al., 2017) have been fully described (Tan et al., 2019). Two views of the Hirshfeld surface mapped overdnormare shown in Fig. 4aand Fig. 4b, which include the entities making the closest contacts as listed in Table 2. The O—H O and N—H O hydrogen bonds to and within the asymmetric unit are clearly shown by the dark-red circles while the light-red ones indicate weak C— H O interactions: these are consistent with the extensive hydrogen-bonding network depicted in Figs. 2 and 3. The Hirshfeld surface mapped over shape index (Fig. 5a) and curvedness (Fig. 5b) indicate, as expected from the X-ray structure, that the anion is compact with relatively little flat surface exposed to its neighboring ions. Fig. 6a shows the overall fingerprint plot while Fig. 6band 6cshow delineation
Figure 3
Packing viewed along theb-axis direction with intermolecular hydrogen bonds depicted as in Fig. 2.
Figure 4
Two views of the Hirshfeld surface for the anion mapped overdnormover the range0.779 to +1.091 arbitrary units with the nearest hydrogen-bonded neighbors added.
Figure 5
The Hirshfeld surface for the asymmetric unit mapped over (a) the shape-index property and (b) the curvedness property.
Figure 2
[image:3.610.45.297.478.717.2] [image:3.610.310.565.607.710.2]into H H, and O—H H—O plus N—H H—O inter-actions, respectively. The former comprises 27.4% of the surface while the latter comprises 66%, again emphasizing the extensive O—H O and N—H O hydrogen bonding present. Of particular note in Fig. 6c are the two spikes at
de+di= 1.56 A˚ , which is over 1.3 A˚ less than the sum of the van der Waals radii and consistent with the prevalence of these two types of hydrogen bonding.
6. Synthesis and crystallization
(NH4)6[Co2Mo10H4O38]7H2O (0.29 g, 0.15 mmol) was dissolved in 8 ml of water and 4 ml of ethanol were added, giving a solution pH above 4. Then, 8 ml of an aqueous solution of supposed l-glutamic acid, C5H9NO4 (0.13 g, 0.9 mmol), was added leading to a solution pH of 3.2. The solution was stirred for 2 h and then transferred to a Teflon-lined autoclave (30 ml) and kept at 383 K for 72 h. After the mixture had been cooled slowly to room temperature, it was filtered and with slow evaporation of the solution at room temperature, flat colorless crystals of the title compound were obtained in 73% yield (based on Mo). Subsequent to the identification of the crystals as a mannitol complex, the original sample of glutamic acid was examined by1H and13C NMR and these spectra clearly showed the glutamic acid to be contaminated by a substantial quantity of mannitol.
7. Refinement details
Crystal data, data collection and structure refinement details are summarized in Table 3. H atoms attached to carbon were placed in calculated positions (C—H = 0.99–1.00 A˚ ) while those attached to oxygen and to nitrogen were placed in locations derived from a difference map, refined for a few cycles to ensure that reasonable displacement parameters could be achieved, and then their coordinates were adjusted to give O—H = 0.87 and N—H = 0.88 A˚ . All were included as riding contributions with isotropic displacement parameters 1.2–1.5 times those of the parent atoms.
Acknowledgements
MM gratefully acknowledges the financial support by the Ferdowsi University of Mashhad and the Iran Science Elites Federation (ISEF), and also thanks the Cambridge
Crystal-lographic Data Centre (CCDC) for access to the Cambridge Structural Database. JTM thanks Tulane University for support of the Tulane Crystallography Laboratory.
References
An, H.-Y., Wang, E.-B., Xiao, D.-R., Li, Y.-G., Su, Z.-M. & Xu, L. (2006).Angew. Chem. Int. Ed.45, 904–908.
Arefian, M., Mirzaei, M., Eshtiagh-Hosseini, H. & Frontera, A. (2017).Dalton Trans.46, 550–558.
Brandenburg, K. & Putz, H. (2012). DIAMOND, Crystal Impact GbR, Bonn, Germany.
Bruker (2016). APEX3, SADABS and SAINT. Bruker AXS Inc., Madison, Wisconsin, USA.
Godfrey, J. E. & Waters, J. M. (1975).Cryst. Struct. Commun.4, 5–8. Groom, C. R., Bruno, I. J., Lightfoot, M. P. & Ward, S. C. (2016).Acta
Cryst.B72, 171–179.
Hedman, B. (1977).Acta Cryst.B33, 3077–3083.
Krause, L., Herbst-Irmer, R., Sheldrick, G. M. & Stalke, D. (2015).J.
Appl. Cryst.48, 3–10.
McKinnon, J. J., Jayatilaka, D. & Spakman, M. A. (2007).Chem.
Commun.pp. 3814–3816.
Mirzaei, M., Eshtiagh-Hosseini, H., Alipour, M. & Frontera, A. (2014).Coord. Chem. Rev.275, 1–18.
Parsons, S., Flack, H. D. & Wagner, T. (2013).Acta Cryst.B69, 249– 259.
Proust, A., Matt, B., Villanneau, R., Guillemot, G., Gouzerh, P. & Izzet, G. (2012).Chem. Soc. Rev.41, 7605–7622.
[image:4.610.48.298.69.148.2]Sheldrick, G. M. (2008).Acta Cryst.A64, 112–122.
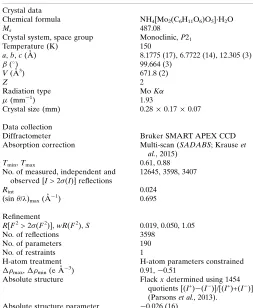
Table 3
Experimental details.
Crystal data
Chemical formula NH4[Mo2(C6H11O6)O5]H2O
Mr 487.08
Crystal system, space group Monoclinic,P21
Temperature (K) 150
a,b,c(A˚ ) 8.1775 (17), 6.7722 (14), 12.305 (3)
() 99.664 (3)
V(A˚3) 671.8 (2)
Z 2
Radiation type MoK
(mm1) 1.93
Crystal size (mm) 0.280.170.07
Data collection
Diffractometer Bruker SMART APEX CCD
Absorption correction Multi-scan (SADABS; Krauseet al., 2015)
Tmin,Tmax 0.61, 0.88
No. of measured, independent and observed [I> 2(I)] reflections
12645, 3598, 3407
Rint 0.024
(sin/ )max(A˚
1) 0.695
Refinement
R[F2> 2(F2)],wR(F2),S 0.019, 0.050, 1.05
No. of reflections 3598
No. of parameters 190
No. of restraints 1
H-atom treatment H-atom parameters constrained
max,min(e A˚ 3
) 0.91,0.51
Absolute structure Flackxdetermined using 1454 quotients [(I+)(I)]/[(I+)+(I)] (Parsonset al., 2013).
Absolute structure parameter 0.026 (16)
[image:4.610.312.565.90.398.2]Computer programs:APEX3andSAINT(Bruker, 2016),SHELXT(Sheldrick, 2015a), SHELXL2018/1 (Sheldrick, 2015b), DIAMOND (Brandenburg & Putz, 2012) and SHELXTL(Sheldrick, 2008).
Figure 6
Sheldrick, G. M. (2015a).Acta Cryst.A71, 3–8. Sheldrick, G. M. (2015b).Acta Cryst.C71, 3–8.
Spackman, M. A. & Jayatilaka, D. (2009).CrystEngComm,11, 19–32. Tahmasebi, M., Mirzaei, M., Eshtiagh-Hosseini, H., Mague, J. T.,
Bauza´, A. & Frontera, A. (2019).Acta Cryst.C75, 469–477.
Tan, S. L., Jotani, M. M. & Tiekink, E. R. T. (2019).Acta Cryst.E75, 308–318.
Turner, M. J., McKinnon, J. J., Wolff, S. K., Grimwood, D. J., Spackman, P. R., Jayatilaka, D. & Spackman, M. A. (2017).Crystal
sup-1 Acta Cryst. (2020). E76, 518-522
supporting information
Acta Cryst. (2020). E76, 518-522 [https://doi.org/10.1107/S2056989020002935]
A redetermination of the crystal structure of the mannitol complex
NH4[Mo2O5(C6H11O6)]
·
H2O: hydrogen-bonding scheme and Hirshfeld surface
analysis
Masoud Mirzaei, Morteza Tahmasebi and Joel T. Mague
Computing details
Data collection: APEX3 (Bruker, 2016); cell refinement: SAINT (Bruker, 2016); data reduction: SAINT (Bruker, 2016);
program(s) used to solve structure: SHELXT (Sheldrick, 2015a); program(s) used to refine structure: SHELXL2018/1
(Sheldrick, 2015b); molecular graphics: DIAMOND (Brandenburg & Putz, 2012); software used to prepare material for
publication: SHELXTL (Sheldrick, 2008).
Ammonium µ-oxido-µ-[1,5,6-trihydroxyhexane-2,3,4-tris(olato)]bis[dioxidomolybdenum(V)] monohydrate
Crystal data
NH4[Mo2(C6H11O6)O5]·H2O
Mr = 487.08
Monoclinic, P21
a = 8.1775 (17) Å
b = 6.7722 (14) Å
c = 12.305 (3) Å
β = 99.664 (3)°
V = 671.8 (2) Å3
Z = 2
F(000) = 480
Dx = 2.408 Mg m−3
Mo Kα radiation, λ = 0.71073 Å Cell parameters from 9659 reflections
θ = 2.5–29.6°
µ = 1.93 mm−1
T = 150 K Plate, colourless 0.28 × 0.17 × 0.07 mm
Data collection
Bruker SMART APEX CCD diffractometer
Radiation source: fine-focus sealed tube Graphite monochromator
Detector resolution: 8.3333 pixels mm-1
φ and ω scans
Absorption correction: multi-scan (SADABS; Krause et al., 2015)
Tmin = 0.61, Tmax = 0.88
12645 measured reflections 3598 independent reflections 3407 reflections with I > 2σ(I)
Rint = 0.024
θmax = 29.6°, θmin = 1.7°
h = −11→10
k = −9→9
l = −17→17
Refinement
Refinement on F2
Least-squares matrix: full
R[F2 > 2σ(F2)] = 0.019
wR(F2) = 0.050
S = 1.05 3598 reflections 190 parameters
1 restraint
Primary atom site location: dual
Secondary atom site location: difference Fourier map
sup-2 Acta Cryst. (2020). E76, 518-522
w = 1/[σ2(F
o2) + (0.0303P)2]
where P = (Fo2 + 2Fc2)/3
(Δ/σ)max = 0.001
Δρmax = 0.91 e Å−3
Δρmin = −0.51 e Å−3
Absolute structure: Flack x determined using 1454 quotients [(I+)-(I-)]/[(I+)+(I-)] (Parsons et
al., 2013).
Absolute structure parameter: −0.026 (16)
Special details
Experimental. The diffraction data were obtained from 3 sets of 400 frames, each of width 0.5° in ω, colllected at φ = 0.00, 90.00 and 180.00° and 2 sets of 800 frames, each of width 0.45° in φ, collected at ω = –30.00 and 210.00°. The scan time was 10 sec/frame.
Geometry. All esds (except the esd in the dihedral angle between two l.s. planes) are estimated using the full covariance matrix. The cell esds are taken into account individually in the estimation of esds in distances, angles and torsion angles; correlations between esds in cell parameters are only used when they are defined by crystal symmetry. An approximate (isotropic) treatment of cell esds is used for estimating esds involving l.s. planes.
Refinement. Refinement of F2 against ALL reflections. The weighted R-factor wR and goodness of fit S are based on F2,
conventional R-factors R are based on F, with F set to zero for negative F2. The threshold expression of F2 > 2sigma(F2) is
used only for calculating R-factors(gt) etc. and is not relevant to the choice of reflections for refinement. R-factors based on F2 are statistically about twice as large as those based on F, and R- factors based on ALL data will be even larger.
H-atoms attached to carbon were placed in calculated positions (C—H = 0.99 - 1.00 Å) while those attached to nitrogen and oxygen were placed in locations derived from a difference map and their coordinates adjusted to give N—H = 0.88 and O —H = 0.87 %A. All were included as riding contributions with isotropic displacement parameters 1.2 - 1.5 times those of the attached atoms.
Fractional atomic coordinates and isotropic or equivalent isotropic displacement parameters (Å2)
x y z Uiso*/Ueq
Mo1 0.73216 (3) 0.83802 (4) 0.15779 (2) 0.00976 (7)
Mo2 0.34681 (3) 0.84715 (3) 0.16065 (2) 0.00929 (7)
O1 0.8054 (3) 0.7655 (4) 0.04086 (19) 0.0185 (5)
O2 0.8566 (3) 1.0290 (4) 0.2099 (2) 0.0189 (5)
O3 0.2139 (3) 0.7705 (4) 0.04573 (19) 0.0168 (5)
O4 0.2581 (3) 1.0501 (4) 0.2096 (2) 0.0182 (5)
O5 0.5254 (3) 0.9641 (3) 0.09446 (18) 0.0117 (4)
O6 0.8084 (3) 0.6119 (3) 0.24906 (19) 0.0127 (4)
O7 0.5241 (3) 0.5776 (3) 0.10930 (17) 0.0124 (4)
H7 0.506325 0.541607 0.040453 0.019*
O8 0.5670 (2) 0.8230 (4) 0.27874 (15) 0.0095 (4)
O9 0.2980 (3) 0.6327 (3) 0.25489 (19) 0.0131 (5)
O10 0.4487 (3) 0.6669 (3) 0.55252 (18) 0.0148 (5)
H10 0.403779 0.570084 0.583505 0.022*
O11 0.1432 (3) 0.5102 (4) 0.5185 (2) 0.0193 (5)
H11 0.142714 0.406135 0.477050 0.029*
C1 0.5738 (4) 0.4105 (5) 0.1814 (3) 0.0137 (6)
H1A 0.640081 0.315372 0.145831 0.016*
H1B 0.475537 0.341650 0.200268 0.016*
C2 0.6776 (4) 0.4998 (5) 0.2839 (2) 0.0123 (6)
H2 0.725734 0.392308 0.335185 0.015*
C3 0.5819 (4) 0.6456 (4) 0.3449 (3) 0.0107 (6)
H3 0.648235 0.674825 0.419035 0.013*
sup-3 Acta Cryst. (2020). E76, 518-522
H4 0.398270 0.448370 0.375349 0.014*
C5 0.3477 (4) 0.7141 (4) 0.4496 (3) 0.0119 (6)
H5 0.365147 0.856715 0.433853 0.014*
C6 0.1656 (4) 0.6852 (5) 0.4567 (3) 0.0160 (6)
H6A 0.124332 0.801416 0.492730 0.019*
H6B 0.100498 0.673866 0.381457 0.019*
O12 0.1166 (3) 0.1850 (4) 0.3922 (2) 0.0268 (6)
H12A 0.172118 0.125773 0.347290 0.040*
H12B 0.039628 0.100843 0.401180 0.040*
N1 0.0369 (3) 0.3889 (4) 0.1356 (2) 0.0167 (6)
H1C 0.107045 0.457351 0.183173 0.025*
H1D −0.050964 0.461341 0.111363 0.025*
H1E 0.006546 0.282251 0.167903 0.025*
H1F 0.085396 0.354261 0.079803 0.025*
Atomic displacement parameters (Å2)
U11 U22 U33 U12 U13 U23
Mo1 0.00916 (12) 0.00909 (11) 0.01150 (11) −0.00040 (13) 0.00308 (8) 0.00066 (13) Mo2 0.00860 (12) 0.00943 (11) 0.00969 (11) 0.00069 (13) 0.00110 (8) 0.00059 (13) O1 0.0198 (13) 0.0200 (11) 0.0174 (11) 0.0015 (10) 0.0078 (10) 0.0001 (10) O2 0.0150 (12) 0.0170 (12) 0.0240 (13) −0.0051 (10) 0.0007 (10) 0.0000 (10) O3 0.0140 (12) 0.0201 (11) 0.0154 (11) −0.0008 (9) −0.0007 (9) 0.0013 (9) O4 0.0171 (13) 0.0155 (12) 0.0235 (14) 0.0050 (10) 0.0076 (11) 0.0009 (10) O5 0.0123 (11) 0.0098 (10) 0.0132 (10) 0.0010 (8) 0.0026 (8) 0.0013 (8) O6 0.0116 (11) 0.0103 (11) 0.0166 (11) −0.0011 (9) 0.0034 (9) 0.0005 (9) O7 0.0177 (12) 0.0097 (10) 0.0100 (10) 0.0007 (9) 0.0026 (8) −0.0022 (8) O8 0.0111 (9) 0.0068 (10) 0.0107 (8) 0.0006 (9) 0.0022 (7) 0.0018 (9) O9 0.0134 (11) 0.0113 (10) 0.0144 (12) −0.0025 (9) 0.0020 (9) 0.0006 (9) O10 0.0161 (12) 0.0149 (11) 0.0133 (11) −0.0009 (9) 0.0020 (9) 0.0005 (8) O11 0.0227 (13) 0.0148 (11) 0.0227 (12) −0.0041 (10) 0.0104 (10) −0.0012 (10) C1 0.0159 (16) 0.0085 (13) 0.0179 (14) −0.0005 (11) 0.0060 (12) 0.0010 (11) C2 0.0128 (15) 0.0108 (14) 0.0142 (14) 0.0011 (11) 0.0051 (12) 0.0027 (11) C3 0.0128 (15) 0.0077 (13) 0.0111 (13) 0.0011 (11) 0.0002 (12) 0.0015 (11) C4 0.0144 (15) 0.0093 (13) 0.0113 (14) −0.0001 (11) 0.0025 (12) 0.0007 (11) C5 0.0142 (15) 0.0084 (13) 0.0132 (14) 0.0016 (11) 0.0025 (12) 0.0014 (11) C6 0.0132 (16) 0.0177 (16) 0.0175 (16) 0.0003 (13) 0.0035 (13) 0.0005 (12) O12 0.0233 (14) 0.0271 (14) 0.0336 (15) −0.0079 (11) 0.0148 (12) −0.0136 (12) N1 0.0136 (14) 0.0153 (16) 0.0215 (13) 0.0004 (9) 0.0043 (11) −0.0041 (10)
Geometric parameters (Å, º)
Mo1—O2 1.703 (2) O11—H11 0.8699
Mo1—O1 1.720 (2) C1—C2 1.522 (5)
Mo1—O5 1.937 (2) C1—H1A 0.9900
Mo1—O6 1.939 (2) C1—H1B 0.9900
Mo1—O8 2.1733 (19) C2—C3 1.532 (4)
sup-4 Acta Cryst. (2020). E76, 518-522
Mo1—Mo2 3.1579 (7) C3—C4 1.532 (4)
Mo2—O4 1.710 (2) C3—H3 1.0000
Mo2—O3 1.713 (2) C4—C5 1.532 (4)
Mo2—O9 1.941 (2) C4—H4 1.0000
Mo2—O5 1.955 (2) C5—C6 1.519 (4)
Mo2—O8 2.1220 (19) C5—H5 1.0000
Mo2—O7 2.478 (2) C6—H6A 0.9900
O6—C2 1.435 (4) C6—H6B 0.9900
O7—C1 1.453 (4) O12—H12A 0.8700
O7—H7 0.8700 O12—H12B 0.8699
O8—C3 1.444 (4) N1—H1C 0.8800
O9—C4 1.436 (4) N1—H1D 0.8798
O10—C5 1.427 (4) N1—H1E 0.8800
O10—H10 0.8700 N1—H1F 0.8800
O11—C6 1.437 (4)
O2—Mo1—O1 105.18 (12) C3—O8—Mo2 115.55 (17)
O2—Mo1—O5 104.04 (11) C3—O8—Mo1 114.93 (17)
O1—Mo1—O5 101.08 (10) Mo2—O8—Mo1 94.64 (7)
O2—Mo1—O6 105.54 (11) C4—O9—Mo2 121.01 (19)
O1—Mo1—O6 97.81 (11) C5—O10—H10 109.5
O5—Mo1—O6 139.04 (9) C6—O11—H11 110.2
O2—Mo1—O8 100.26 (11) O7—C1—C2 104.9 (2)
O1—Mo1—O8 154.56 (10) O7—C1—H1A 110.8
O5—Mo1—O8 72.27 (8) C2—C1—H1A 110.8
O6—Mo1—O8 75.09 (9) O7—C1—H1B 110.8
O2—Mo1—O7 169.57 (10) C2—C1—H1B 110.8
O1—Mo1—O7 85.19 (10) H1A—C1—H1B 108.8
O5—Mo1—O7 72.31 (8) O6—C2—C1 107.6 (2)
O6—Mo1—O7 73.48 (9) O6—C2—C3 105.8 (2)
O8—Mo1—O7 69.37 (8) C1—C2—C3 113.7 (3)
O2—Mo1—Mo2 121.00 (9) O6—C2—H2 109.8
O1—Mo1—Mo2 120.21 (8) C1—C2—H2 109.8
O5—Mo1—Mo2 35.97 (6) C3—C2—H2 109.8
O6—Mo1—Mo2 103.50 (7) O8—C3—C2 105.2 (2)
O8—Mo1—Mo2 42.05 (5) O8—C3—C4 105.3 (2)
O7—Mo1—Mo2 50.52 (5) C2—C3—C4 118.0 (3)
O4—Mo2—O3 106.63 (12) O8—C3—H3 109.3
O4—Mo2—O9 104.41 (11) C2—C3—H3 109.3
O3—Mo2—O9 95.78 (11) C4—C3—H3 109.3
O4—Mo2—O5 102.25 (11) O9—C4—C5 109.6 (2)
O3—Mo2—O5 101.17 (10) O9—C4—C3 107.9 (2)
O9—Mo2—O5 142.62 (10) C5—C4—C3 110.9 (3)
O4—Mo2—O8 100.51 (11) O9—C4—H4 109.5
O3—Mo2—O8 152.85 (11) C5—C4—H4 109.5
O9—Mo2—O8 76.66 (9) C3—C4—H4 109.5
O5—Mo2—O8 73.08 (8) O10—C5—C6 110.3 (3)
sup-5 Acta Cryst. (2020). E76, 518-522
O3—Mo2—O7 83.30 (10) C6—C5—C4 113.1 (3)
O9—Mo2—O7 77.80 (9) O10—C5—H5 107.9
O5—Mo2—O7 71.48 (8) C6—C5—H5 107.9
O8—Mo2—O7 69.65 (8) C4—C5—H5 107.9
O4—Mo2—Mo1 120.20 (9) O11—C6—C5 110.5 (3)
O3—Mo2—Mo1 118.74 (8) O11—C6—H6A 109.6
O9—Mo2—Mo1 107.31 (7) C5—C6—H6A 109.6
O5—Mo2—Mo1 35.58 (6) O11—C6—H6B 109.6
O8—Mo2—Mo1 43.31 (5) C5—C6—H6B 109.6
O7—Mo2—Mo1 49.85 (5) H6A—C6—H6B 108.1
Mo1—O5—Mo2 108.45 (10) H12A—O12—H12B 104.1
C2—O6—Mo1 114.04 (18) H1C—N1—H1D 109.6
C1—O7—Mo1 107.42 (18) H1C—N1—H1E 109.5
C1—O7—Mo2 122.26 (18) H1D—N1—H1E 109.5
Mo1—O7—Mo2 79.63 (7) H1C—N1—H1F 109.3
C1—O7—H7 111.1 H1D—N1—H1F 109.5
Mo1—O7—H7 115.7 H1E—N1—H1F 109.4
Mo2—O7—H7 116.5
Mo1—O7—C1—C2 25.7 (3) C1—C2—C3—C4 41.6 (4)
Mo2—O7—C1—C2 −62.9 (3) Mo2—O9—C4—C5 88.7 (3)
Mo1—O6—C2—C1 64.9 (3) Mo2—O9—C4—C3 −32.1 (3)
Mo1—O6—C2—C3 −57.1 (3) O8—C3—C4—O9 38.6 (3)
O7—C1—C2—O6 −55.2 (3) C2—C3—C4—O9 −78.3 (3)
O7—C1—C2—C3 61.7 (3) O8—C3—C4—C5 −81.4 (3)
Mo2—O8—C3—C2 93.0 (2) C2—C3—C4—C5 161.7 (3)
Mo1—O8—C3—C2 −15.7 (3) O9—C4—C5—O10 177.4 (2)
Mo2—O8—C3—C4 −32.3 (3) C3—C4—C5—O10 −63.6 (3)
Mo1—O8—C3—C4 −141.03 (18) O9—C4—C5—C6 54.0 (3)
O6—C2—C3—O8 42.6 (3) C3—C4—C5—C6 173.0 (3)
C1—C2—C3—O8 −75.3 (3) O10—C5—C6—O11 −40.3 (3)
O6—C2—C3—C4 159.6 (3) C4—C5—C6—O11 82.6 (3)
Hydrogen-bond geometry (Å, º)
D—H···A D—H H···A D···A D—H···A
N1—H1D···O1i 0.88 2.46 3.272 (4) 154
N1—H1E···O2ii 0.88 2.22 3.066 (4) 162
N1—H1F···O1iii 0.88 1.95 2.831 (4) 177
O7—H7···O5iii 0.87 1.72 2.589 (3) 178
O10—H10···O8iv 0.87 2.37 3.137 (3) 148
O12—H12A···O4v 0.87 2.01 2.845 (4) 162
O12—H12B···O11vi 0.87 2.02 2.812 (3) 151
C4—H4···O10iv 1.00 2.37 3.243 (4) 145
C5—H5···O10vii 1.00 2.58 3.491 (4) 151