Manuscript version: Author’s Accepted Manuscript
The version presented in WRAP is the author’s accepted manuscript and may differ from the
published version or Version of Record.
Persistent WRAP URL:
http://wrap.warwick.ac.uk/110526
How to cite:
Please refer to published version for the most recent bibliographic citation information.
If a published version is known of, the repository item page linked to above, will contain
details on accessing it.
Copyright and reuse:
The Warwick Research Archive Portal (WRAP) makes this work by researchers of the
University of Warwick available open access under the following conditions.
© 2018 Elsevier. Licensed under the Creative Commons
Attribution-NonCommercial-NoDerivatives 4.0 International
http://creativecommons.org/licenses/by-nc-nd/4.0/.
Publisher’s statement:
Please refer to the repository item page, publisher’s statement section, for further
information.
5 6 7 8 9 10 11 12 13 14 15 16 17 18 19 20 21 22 23 24 25 26 27 28 29 30 31 32 33 34 35 36 37 38 39 40 41 42 43 44 45 46 47 48 49 50 51 52 53 54 55 56 57
Explaining Reputation Assessments
Ingrid Nunesa,b,⇤, Phillip Taylorc, Lina Barakatd, Nathan Griffithsc, Simon
Milesd
aUniversidade Federal do Rio Grande do Sul (UFRGS), Porto Alegre, Brazil bTU Dortmund, Dortmund, Germany
cUniversity of Warwick, Coventry, United Kingdom dKing’s College London, London, United Kingdom
Abstract
Reputation is crucial to enabling human or software agents to select among
al-ternative providers. Although several e↵ective reputation assessment methods
exist, they typically distil reputation into a numerical representation, with no
accompanying explanation of the rationale behind the assessment. Such
expla-nations would allow users or clients to make a richer assessment of providers,
and tailor selection according to their preferences and current context. In this
paper, we propose an approach to explain the rationale behind assessments from
quantitative reputation models, by generating arguments that are combined to
form explanations. Our approach adapts, extends and combines existing
ap-proaches for explaining decisions made using multi-attribute decision models
in the context of reputation. We present example argument templates, and
describe how to select their parameters using explanation algorithms. Our
pro-posal was evaluated by means of a user study, which followed an existing
proto-col. Our results give evidence that although explanations present a subset of the
information of trust scores, they are sufficient to equally evaluate providers
rec-ommended based on their trust score. Moreover, when explanation arguments
reveal implicit model information, they are less persuasive than scores.
⇤Corresponding author.
Email addresses: [email protected](Ingrid Nunes),
8 9 10 11 12 13 14 15 16 17 18 19 20 21 22 23 24 25 26 27 28 29 30 31 32 33 34 35 36 37 38 39 40 41 42 43 44 45 46 47 48 49 50 51 52 53 54 55 56 57 58
Keywords: Reputation, Trust, Explanation, Arguments, User study
1. Introduction
In environments where many parties o↵er comparable services or products,
customers need to be able to choose between the options available. Automated
support for this has been studied extensively in the areas of recommender
sys-tems [1] and reputation assessment [2]. In particular, reputation assessment al-5
lows the calculation of reputation scores so that the past performance of service
providers can be compared. These scores can then be used to determine which
provider to select, as they characterise providers according to the factors of
in-terest to the client. Various reputation models [3, 4, 5, 6, 7] have been shown to
be e↵ective through empirical evaluation, but do not provide the transparency 10
needed to understand why one provider has a better reputation than another.
As the complexity of reputation models increases, this understanding is
becom-ing harder to achieve. Access to the reasons that underlie reputation assessment
would allow users to judge whether the resulting reputation scores reflect their
actual interests in the current context, and allow providers to identify the as-15
pects they must improve. Explanations have been exploited to improve user
system acceptance in expert systems and recommender systems [8], but have
not been explored in the context where automated interactions occur, such as
in multi-agent systems, or instantiated for reputation assessment methods.
Our goal is to improve, from the user perspective, thetransparencyof repu-20
tation models, which are in general purely quantitative. Reputation scores are
helpful to assess and rank providers but, with explanations of such scores, users
would be able to evaluate whether they agree with them. As a consequence,
users can make moree↵ectivechoices when taking reputation into account. We
propose an approach to explain the rationale behind the scores generated by 25
reputation assessment models. These are abstracted into a generic reputation
model, which we refer to as themulti-term reputation model (MTRM). This is
8 9 10 11 12 13 14 15 16 17 18 19 20 21 22 23 24 25 26 27 28 29 30 31 32 33 34 35 36 37 38 39 40 41 42 43 44 45 46 47 48 49 50 51 52 53 54 55 56 57
express existing reputation assessment methods, upon which explanations can
be built. Our approach generates arguments about the reasons behind repu-30
tation scores by leveraging explanation approaches proposed in the context of
multi-attribute utility theory [9, 10], and combines the arguments into
expla-nations. Explanations are produced based on information that can be obtained
from an instance of MTRM. Moreover, this generic reputation model can be
customised, leading to an instantiation of a specific underlying existing reputa-35
tion model, and model-specific arguments can then be generated. In order to
illustrate this process, we show customisations for the FIRE [4] and TRAVOS [5]
reputation models.
Despite the fact that users have generally been taken out of the loop in
evaluations of work on trust and reputation for multi-agent systems, a study 40
involving real people is essential for validating our approach. Therefore, in
or-der to evaluate our generated explanations, we conducted a user study, which
provides evidence of their usefulness. The study involve 30 participants and
fol-lowed the protocol proposed by Bilgic and Mooney [11]. As result, we observed
that, in order to assess providers, our explanations is as efficient as having de-45
tailed information about trust scores of providers, that is, with less information
(and possibly more confidentially) participants were able to assess providers.
Furthermore, our explanation arguments are less persuasive than scores when
they reveal implicit model information. In our study, arguments were presented
to participants in a textual form, generated using example templates of how 50
to transform our explanation arguments into a user-understandable form. This
choice caused participants, however, to prefer trust scores, which were presented
in a table, over textual explanations.
In summary, our key contribution is an approach to explain quantitative
reputation models, focusing on FIRE and TRAVOS as illustrative reputation 55
models. Specifically, we (i) propose a method to generate explanations of
assess-ments from quantitative reputation models, (ii) show how to leverage existing
approaches for explaining decisions made using multi-attribute decision models
8 9 10 11 12 13 14 15 16 17 18 19 20 21 22 23 24 25 26 27 28 29 30 31 32 33 34 35 36 37 38 39 40 41 42 43 44 45 46 47 48 49 50 51 52 53 54 55 56 57 58
study. 60
We describe background research and related work in Section 2. The
multi-term reputation model (MTRM) is introduced in Section 3, followed by a
de-scription of our explanation approach in Section 4. The user study performed
to evaluate our approach is presented in Section 5. Finally, we present our
conclusions in Section 6. 65
2. Background and Related Work
Two main research areas are associated with our work, namely,
explana-tions for recommender and decision support systems, and trust and reputation
assessment methods. There is much work that has been done in the former,
but not addressing our particular context. We give an overview of explanation 70
approaches and introduce those that are adopted in our work in Section 2.1.
Trust and reputation have also been widely investigated and, as a result, many
reputation models have been proposed. Our approach aims to be generic, in the
sense that it can be used with any reputation model. We instantiate it for
il-lustration using two existing reputation models, FIRE [4] and TRAVOS [5, 12], 75
as described in Section 2.2.
2.1. Explanation Generation
Over recent years, there has been an increasing interest in explanations for
recommender and decision support systems [8, 13, 14]. Explanations in such
systems have been investigated, as was the case with expert systems [15], be-80
cause explanations can promote many benefits, including increased user trust
and more e↵ective decisions [8], which are fundamental to user acceptance of
these systems.
Di↵erent studies have been performed in the context of explanations. Many
types of explanations given for recommender systems were compared in user 85
studies [13, 16]. Herlocker et al. [13] concluded that showing rates from
8 9 10 11 12 13 14 15 16 17 18 19 20 21 22 23 24 25 26 27 28 29 30 31 32 33 34 35 36 37 38 39 40 41 42 43 44 45 46 47 48 49 50 51 52 53 54 55 56 57
to the acceptance of the recommendation. However, Bilgic and Mooney [11]
observed that this kind of explanation persuades users to accept
recommenda-tions rather than helping them to make better choices. Indeed, explanarecommenda-tions 90
can be given with di↵erent purposes [8]. As Bilgic and Mooney argue,
persua-sion explanations cause users to overestimate the quality of an option and make
inaccurate choices and, consequently, their confidence in the system rapidly
de-teriorates. Our interest is thus in e↵ective explanations [8], which assist users
to make better decisions by helping them to evaluate the quality of options ac-95
cording to their own preferences. There are some studies with people that give
foundation to this kind of explanation [17, 18], with the proposal of patterns
and guidelines, which state that attributes presented in explanations must be
tailored to the user, as has been confirmed by a previous user study [19].
There are three main approaches that propose algorithms that select at-100
tributes to be part of e↵ective explanations [20, 9, 10]. Such approaches use
multi-attribute decision models as input, which makes them inadequate to be
used as is with reputation models. However, they can be used in a
complemen-tary way in our work, by being adapted to be used in our context.
The oldest approach, proposed by Klein and Shortli↵e [20], is empirically 105
motivated but lacks proper evaluation, while Labreuche’s approach [9] addresses
a limitation of this method—a formal justification of the selected arguments.
Labreuche [9] proposed an approach for selecting and generating arguments for
the family of multi-attribute decision models parameterised by weights assigned
to the criteria, such as the expected utility model and the weighted majority 110
model. The explanations generated are of four di↵erent types, generated using
di↵erent kinds of argumentation reasoning, calledanchors (all,not on average,
invert andremaining case). Anchors identify changes in a weight vectorvthat
yields an inversion of the prescription made by the decision model, leading to
why one option is preferred to another. Two strategies for the modification of 115
the weights are considered: (i) the replacement ofvby some reference weights
wF, indicating that an option is preferred to another because it is better for the
8 9 10 11 12 13 14 15 16 17 18 19 20 21 22 23 24 25 26 27 28 29 30 31 32 33 34 35 36 37 38 39 40 41 42 43 44 45 46 47 48 49 50 51 52 53 54 55 56 57 58
weightsvamong the criteria (associated with a branch-and-bound algorithm),
indicating that the preferred option is better for the most important attributes 120
and worse for the least important attributes. A trivial anchor addresses the
case of domination (the case where an option has at least one advantage with
respect to another, and no disadvantage), and another last anchor covers the
remaining cases.
An explanation generation technique was proposed by Nunes et al. [10], 125
which is founded on a study of how people justify choices [18]. The technique
is composed of a set of algorithms that select attributes to be used as part
of explanations that follow di↵erent explanation patterns, such as critical
at-tribute,cut-o↵value,decisive criteriaandtrade-o↵resolution. While Klein and
Shortli↵e’s approach selects outlier attributes and Labreuche analyses weight 130
changes, Nunes et al. consider a set of attributes as decisive when they are the
minimum set of attributes (in the sense of⇢) needed to make an option worse
than another. If this set consists of all cons of an option, then a second set of
attributes is selected: the minimum set of attributes that are pros that must
not be taken into account to enable the existence of a decisive criteria. 135
We have used adapted parts of these two introduced approaches [9, 10] in
the work described in this paper, and further details of these parts are provided
when we describe our explanation approach.
Argumentation frameworks have also been adopted for the purpose of
em-powering quantitative decision tools with inference mechanisms and respec-140
tive explanation capabilities—e.g. argumentation-enriched recommender
sys-tems have been proposed for recommending music [21], movies [22, 23], web
content [24], and learning objects [25]. In many such approaches,
Defeasi-ble Logic Programming (DeLP) [26] is employed either instead, or on top of
an existing quantitative technique in order to provide a qualitative perspec-145
tive, where conclusions/suggestions are reasoned in terms of arguments for and
against them. In particular, DeLP models (potentially inconsistent and
contra-dictory) knowledge about the domain, in terms of facts and a set of strict and
8 9 10 11 12 13 14 15 16 17 18 19 20 21 22 23 24 25 26 27 28 29 30 31 32 33 34 35 36 37 38 39 40 41 42 43 44 45 46 47 48 49 50 51 52 53 54 55 56 57
is then derived by applying backward chaining on these facts and rules. Ar-150
guments can be attacked by other arguments (e.g. those proposing opposite
conclusions), and the attacks among arguments can be resolved via associating
arguments with probabilities/preferences.
The knowledge (facts and rules) upon which the reasoning of such
argumen-tation frameworks is based is typically pre-determined, and is derived directly 155
from user preference declarations, and added on top of the (sub-)results of the
quantitative measure. Our explanation approach focuses on providing a
finer-grained analysis of the reasoning behind the quantitative measure (rather than
substituting it or building on top of it), and can be seen as a dynamic generator
of knowledge to then be used by such argumentation frameworks. 160
2.2. Reputation Models
Trust and reputation enable agents to minimise the inherent uncertainty
when self-interested individuals or organisations interact [27]. Trust can be
viewed as an assessment of the likelihood that an individual or organisation will
fulfil its commitments [28]. Reputation complements trust, and can be seen as 165
a public perception of trustworthiness [29]. Several computational models of
trust and reputation exist, which can be broadly categorised into those that
are based on credentials and those based on experience and observation of past
behaviour—see [27, 29, 2, 30] for comprehensive reviews. Credential-based
ap-proaches use policies to express when, for what, and how to determine trust 170
based on certificates, keys, or digital signatures, etc. Although such methods
are e↵ective for managing access rights and permissions, they do not support
more general reasoning about interactions, and therefore in this paper we focus
instead on experience based approaches.
Several experience based approaches use a combination of direct and indirect 175
experience to derive a numerical or probabilistic assessment of reputation [31].
ReGreT [32, 3] assesses reputation on three aspects: (i) an individual
dimen-sion from direct experience, (ii) a social dimendimen-sion using knowledge of others’
8 9 10 11 12 13 14 15 16 17 18 19 20 21 22 23 24 25 26 27 28 29 30 31 32 33 34 35 36 37 38 39 40 41 42 43 44 45 46 47 48 49 50 51 52 53 54 55 56 57 58
accounts for the di↵erent aspects that inform reputation (e.g. delivery, price, 180
and quality). FIRE [4] builds on ReGreT through the addition of role-based
trust, and certified reputation based on third-party references [4]. TRAVOS [5]
takes a probabilistic approach to assessing trust, estimating the expected value
of success of future interactions using a beta probability distribution.
The use of a binary variable (success or failure) to model outcomes is a 185
limitation of TRAVOS and alternative approaches have been proposed. For
example, BLADE [6] models agents and advisor evaluation functions as dynamic
random variables using Dirichlet distributions, enabling progressive learning of
probabilistic models through Bayesian techniques. To cope with noisy advisors,
HABIT [7] creates a Bayesian network to support reasoning about reputation. 190
However, HABIT assumes that the distribution of an agent’s behaviour is static,
an assumption not made by other approaches. Other reputation systems apply
machine learning in assessing reputation, typically in assessing stereotypical
reputation [33, 34].
Although these methods rely on di↵erent aggregations/distributions, they 195
have been used for the same purpose of estimating the reputation of agents
with which an agent wants to interact, relying on evaluations made based on
previous interactions (either by direct experience or with peers) over time. In
this paper, we adopt FIRE and TRAVOS as examples to illustrate our approach,
and describe their operation in more detail below. We focus on FIRE and 200
TRAVOS due to their simplicity and low computational overheads, compared
to approaches such as BLADE and HABIT, because the focus of this paper
is on explanation generation providing a rationale for reputation assessment,
rather than on any particular reputation assessment method itself. We selected
two methods to demonstrate the generality of our approach and the value of 205
customisations made to particular methods.
2.3. The FIRE Reputation Model
FIRE combines four types of reputation and trust: interaction trust from
8 9 10 11 12 13 14 15 16 17 18 19 20 21 22 23 24 25 26 27 28 29 30 31 32 33 34 35 36 37 38 39 40 41 42 43 44 45 46 47 48 49 50 51 52 53 54 55 56 57
trust (R), and certified reputation based on third-party references (Cr) [4]. Rep-210
utation is assessed in FIRE fromratingtuples, (a, b, t, i, v), where aandbare
agents that participated in interaction isuch that a gave b a rating value of
v 2 [ 1,+1] for the termt (e.g. reliability, quality, timeliness). A rating of
+1 is absolutely positive, 1 is absolutely negative, and 0 is neutral. In FIRE,
each agent has a history of sizeH and stores the lastH ratings it has given in 215
its local database. FIRE gives more weight to recent interactions using arating
weight function,!K, for each trust or reputation componentK2{I, W, R, Cr}.
The component trust or reputation a has in bfor term t is the weighted
mean of ratings,
TK(a, b, t) = P
ri2RK(a,b,t)!K(ri)·vi
P
ri2RK(a,b,t)!K(ri)
(1)
where RK(a, b, t) is the set of ratings stored by a regarding bfor component
K with respect to termt, and vi is the value of rating ri. Interaction trust,
TI(a, b, t) is calculated from the interaction records that the assessing agenta has in their database, RI(a, b, t). Specifically, the ratings of records matching
(a, b, t, , ) are aggregated using Equation 1, wherebis the agent being assessed,
tis the term of interest, and “ ” matches any value, and:
!I(ri) =e ⌧(ri) (2)
Here, !I(ri) is the weight for rating ri and ⌧(ri) is the time since ratingri
was recorded.
Witness and certified reputation are similarly calculated, using this aggre-220
gation over di↵erent sets of interaction ratings. For witness reputation the
assessing agent, a, uses a acquaintances to provide their ratings ofb for term
t, i.e. ratings of the form ( , b, t, , ). If the acquaintance has no relevant
ex-perience, they will pass on the request to their own acquaintances. To assess
certified reputation, the assessed agent, b, provides a set of ratings that they 225
have previously been given by other agents. The weighting used in calculating
8 9 10 11 12 13 14 15 16 17 18 19 20 21 22 23 24 25 26 27 28 29 30 31 32 33 34 35 36 37 38 39 40 41 42 43 44 45 46 47 48 49 50 51 52 53 54 55 56 57 58
Role-based trust uses ratings assigned to rules describing agent relationships,
e.g. if they are part of the same organisation, or there is a provider consumer
relationship. Rules have the form (rolea, roleb, t, e, v), representing if two agents 230
aandbtake rolesroleaandroleb, thenbis expected with a likelihood ofe2[0,1]
to have performance ofvfor termtin an interaction witha. To calculate
role-based trust, rules in the assessing agent’s database that match RR(a, b, t) are
aggregated using Equation 1, with!R(ri) =ei.
The composite term trust,T(a, b, t), in an agent with respect to a given term
tis calculated as a weighted mean of the component sources:
T(a, b, t) = P
K2{I,W,R,Cr}!K· TK(a, b, t) P
K2{I,W,R,Cr}!K
(3)
where !I, !W,!R and!Cr are parameters that determine the importance of 235
each component,!K=!K·⇢K(a, b, t), and the reliability of the reputation value
for component K is ⇢K(a, b, t). The reliability of a reputation value is
deter-mined by a combination of the rating reliability and rating deviation reliability
(details of the calculations can be found in [4]).
2.4. The TRAVOS Reputation System 240
TRAVOS is based on the Beta Reputation System [35] and extends it to
ignore reputation assessments from unreliable witnesses [5, 36, 12]. TRAVOS
uses interaction trust and witness reputation, computed using rating tuples
similar to those used in FIRE. Whereas in FIRE the rating value is a real
number, ratings in TRAVOS are binary,v2{0,1}, where 0 is a negative rating
and 1 is positive. The component trust value agentahas in agentbwith respect
to termt, is the expected value of a beta probability density function,
TK(a, b, t) = ↵K(a, b, t) ↵K(a, b, t) + K(a, b, t)
, (4)
where↵K(a, b, t) is 1 plus the number of relevant positive ratings and K(a, b, t)
is 1 plus the number of relevant negative ratings,
↵K(a, b, t) = 1 +|{ri2RK(a, b, t)|vi= 1}|,
K(a, b, t) = 1 +|{ri2RK(a, b, t)|vi= 0}|.
8 9 10 11 12 13 14 15 16 17 18 19 20 21 22 23 24 25 26 27 28 29 30 31 32 33 34 35 36 37 38 39 40 41 42 43 44 45 46 47 48 49 50 51 52 53 54 55 56 57
The beta probability density function can also be used to compute a
confi-dence in the trust value, defined by the proportion of the distribution that lies
in a range centred around the expected value,
⇢K(a, b, t) =
RTK(a,b,t)+✏
TK(a,b,t) ✏X↵K(a,b,t) 1(1 X) K(a,b,t) 1dX R1
0 U↵K(a,b,t) 1(1 U) K(a,b,t) 1dU
, (6)
where✏is a user defined parameter to define the range considered.
As with FIRE, an assessing agent computes interaction trust from the set of
ratings,RI(a, b, t), in its database that match (a, b, t, , ). The interaction trust
is thenTI(a, b, t), which has an associated confidence,⇢I(a, b, t). If⇢I(a, b, t) is
below a threshold set by the user, witnesses are asked for ratings of agentbfor 245
termt, which are used to compute the witness reputation.
Witnesses, w 2 W, provide opinions in the form of the number of
posi-tive,↵W(w, b, t) and the number of negative ratings, W(w, b, t), that they have
given b. Before the overall reputation is calculated, the witness opinions are
discounted based on their perceived accuracy to limit their e↵ect on the com-250
posite reputation score. TRAVOS stores previous ratings provided by witnesses
inobservationtuples, (a, w, b, t, i, o, v), where,wis a witness that provided
eval-uatorawith a set of ratings about providerb, which formed a beta probability
density distribution whose expected value determined the raw opinion value of
o. After processing this witness opinion and selectingbto interact with,agave 255
ba rating value ofvin interactioni.
On receipt of a new opinion from a witness, w, an evaluator, a, queries
their observation database for records where the opinion,o, provided bywfor
termtwas similar. Two opinions are said to be similar if their expected values
are close (i.e. they both lie in the same discrete interval). The coherence of
the opinion provided, o, and the rating for the subsequent interaction,v, then
determines the reliability of the new opinion provided by the witness. Given this
8 9 10 11 12 13 14 15 16 17 18 19 20 21 22 23 24 25 26 27 28 29 30 31 32 33 34 35 36 37 38 39 40 41 42 43 44 45 46 47 48 49 50 51 52 53 54 55 56 57 58
trust by summing the↵and parameters,
↵(a, b, t) =↵I(a, b, t) + X w2W
¯
↵W(w, b, t)
(a, b, t) = I(a, b, t) + X
w2W
¯W(w, b, t), (7)
where ¯↵W(w, b, t) and ¯W(w, b, t) are the discounted opinion parameters
pro-vided by witnesswregarding agent bfor termt. The composite term trust in
agentbfor termtis then,
T(a, b, t) = ↵(a, b, t)
↵(a, b, t) + (a, b, t). (8)
For full details on the calculation behind discounting see [12].
3. Multi-Term Reputation Model
In the previous section, we gave an overview of two di↵erent reputation
models, namely FIRE and TRAVOS. In order to provide a model-independent 260
explanation approach, we must first specify a common model specification that
generalises di↵erent reputation models. This generalised model, which we refer
to asmulti-term reputation model (MTRM), can be specialised by the addition
of the specific components of a particular reputation model. Note this MTRM
is not a new reputation model, but a model that captures concepts present in 265
any reputation model. Therefore, explanations provided based on this model
are applicable to any reputation model. Concepts that are usual, e.g. recency,
but not used in all reputation models can be added in MTRM extensions. We
next introduce the MTRM concepts.
All reputation models consider a way for an agent to assess how an
inter-action with another agent occurred. In FIRE, for example, agents associate
a rating with those they interact with in [ 1,+1], while in TRAVOS agents
only record success or failure, i.e. ratings are in{0,1}. These ratings are then
communicated to others who require additional information to inform their
8 9 10 11 12 13 14 15 16 17 18 19 20 21 22 23 24 25 26 27 28 29 30 31 32 33 34 35 36 37 38 39 40 41 42 43 44 45 46 47 48 49 50 51 52 53 54 55 56 57
ratings
ri=ha, b, t, K, vi (9)
where a is a source agent, b is target agent, t is a term, K is a reputation 270
type, andvis a rating value. A particular reputation model may add additional
parameters, e.g. interaction as in FIRE. Trust ratings are associated with
rep-utation types, or components, according to the component of the model that
generates them. Each model incorporates a particular set of reputation types,
KSet. TRAVOS only includes interaction (I) and witness (W) reputation types, 275
while FIRE supplements those with role-based (R) and certified (Cr) reputation.
The set of ratings associated with a particular reputation type isRK(a, b, t).
These ratings are used to calculate a trust valueTK(a, b, t), which combines
trust ratings in a single real value. In case of FIRE, as introduced in Section 2.3,
the trust value is a weighted mean of ratings, considering a recency function 280
! (ri), while TRAVOS uses a probabilistic model. If a trust value is associated
with a reputation typeK, it means that it is derived from ratings only associated
withK.
Trust values associated with di↵erent reputation types must be combined to
form a single value. In MTRM, as its name indicates, we consider that agents 285
can assess others with respect to di↵erent terms t2 T, such as cost, quality
and timeliness. The component trust values can be combined to form the term
trust T(a, b, t). We do not assume that the term trust is calculated using a
specific method such as a weighted mean or sum, but rather we assume that
the term trust can be decomposed into weights!K and trust valuesTK(a, b, t), 290
associated with di↵erent reputation types. This is straightforward in FIRE,
given that FIRE calculates trust as a weighted mean of weighted means.
How-ever, TRAVOS does not calculate a composite trust value from interaction and
witness trusts in this way, instead combining ratings from witnesses, after
ad-justment for reliability and relevance, to act as parameters of a beta probability 295
distribution whose expected value determines the composite trust value.
8 9 10 11 12 13 14 15 16 17 18 19 20 21 22 23 24 25 26 27 28 29 30 31 32 33 34 35 36 37 38 39 40 41 42 43 44 45 46 47 48 49 50 51 52 53 54 55 56 57 58
and then decompose this term trust into two trust values, one associated with
direct interaction trust, and another with witness trust.
TRAVOS computes an overall trust value, which in our case is the term trust,
by combining the direct interaction trust and witness opinions, after adjusting
them for perceived accuracy. The combination proceeds by summing the↵and
parameters of the beta probability density functions, as in Equation 7. In
FIRE, the trust component weights are determined by user preferences, while
in TRAVOS, we define them as the proportion of the final beta probability
density function that the component parameters account for. For instance, the
interaction trust weight is,
!I(a, b, t) = ↵I(a, b, t) + I(a, b, t)
↵I(a, b, t) + I(a, b, t) +Pw2W↵W¯ (w, b, t) + ¯W(w, b, t) (10)
and witness reputation weight is!W(a, b, t) = 1 !I(a, b, t). 300
Finally, existing reputation models either do not consider terms (e.g. TRAVOS)
or often do not specify how to combine values for di↵erent terms into a single
trust score (as is the case with FIRE). Therefore, inspired by multi-attribute
utility theory [37], we consider weights that establish a trade-o↵ relationship
among terms, and view term trust as a utility value. The overall trust score is
then a weighted mean of term trusts, where the weights are agents’ preferences
for terms.
T(a, b) = P
t2TP!t· T(a, b, t) t2T!t
(11)
where the parameters !t correspond to a’s preferences regarding the relative
importance of terms, andT is the set of all terms.
Note that in order for reputation models to be abstracted to our MTRM,
they should either use a weighted sum approach, like FIRE, or be decomposable
into such an approach, like TRAVOS. 305
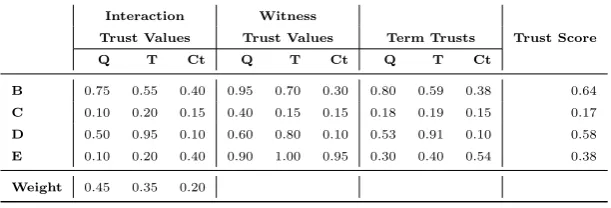
As result, our MTRM is able to capture data such as that presented in
Ta-ble 1. In this taTa-ble, we show a set of illustrative trust values from the perspective
of an agentAwith respect to four other agents (B,C,D andE), considering
three di↵erent terms—Quality (Q), Timeliness (T) and Cost (Ct). For
8 9 10 11 12 13 14 15 16 17 18 19 20 21 22 23 24 25 26 27 28 29 30 31 32 33 34 35 36 37 38 39 40 41 42 43 44 45 46 47 48 49 50 51 52 53 54 55 56 57
Interaction Witness
Trust Values Trust Values Term Trusts Trust Score
Q T Ct Q T Ct Q T Ct
B 0.75 0.55 0.40 0.95 0.70 0.30 0.80 0.59 0.38 0.64
C 0.10 0.20 0.15 0.40 0.15 0.15 0.18 0.19 0.15 0.17
D 0.50 0.95 0.10 0.60 0.80 0.10 0.53 0.91 0.10 0.58
E 0.10 0.20 0.40 0.90 1.00 0.95 0.30 0.40 0.54 0.38
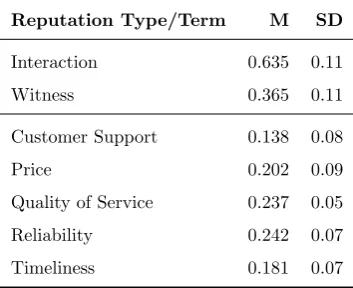
[image:16.595.145.451.174.278.2]Weight 0.45 0.35 0.20
Table 1: Running Example: Agents and Scores.
example, a recency function. Similarly, there are trust values that come from
witnesses, which are shown in the columns labelled with “Witness Trust Values”
in Table 1, for instanceTW(A, C, Q) = 0.40.
The term trust, in this case, combines interaction and witness trust values.
Assume that agentA uses the following weights: (i) interaction weight: !I = 315
0.75; and (ii) witness weight: !W = 0.25. As result, for example, we have the
quality trust with respect toBwould beT(A, B, Q) = 0.75⇥0.75+0.25⇥0.95 =
0.80.
Similarly, term trusts are combined using weights, which are shown in the
last row of Table 1, for terms resulting in the overall trust score, shown in the last 320
column in Table 1—for instance,T(A, C) = 0.17. Based on these calculations, it
can be seen that the agent with the best trust score is agentB. Although there
is a mathematical explanation that leads to this, it is hard to extract intuitive
arguments that justify whyBis the most trustworthy agent for agentA. This is
done by our explanation approach, which is presented in the following section. 325
4. Explaining Reputation Assessments
Now that we have a common reputation model, we can specify a method for
producing explanations. An explanation justifies why a particular agent (e.g.
a service provider) has a better reputation, i.e. the overall trust score, than
another from the perspective of a given agent (e.g. a client). Our explanations 330
8 9 10 11 12 13 14 15 16 17 18 19 20 21 22 23 24 25 26 27 28 29 30 31 32 33 34 35 36 37 38 39 40 41 42 43 44 45 46 47 48 49 50 51 52 53 54 55 56 57 58
that distinguish the two agents being compared, being all arguments needed to
understand which agent is better. Arguments are instantiated with parameters
selected using specified algorithms. We first present arguments that can be part
of an explanation, and then show how to use these arguments to produce an 335
explanation.
Our method not only produces arguments for our common trust model,
MTRM, but also considers the specific details of di↵erent reputation models.
Therefore we have generic arguments, generated based on MTRM, which are
supplemented with model-specific arguments. We show as examples of the latter 340
specific arguments for both FIRE and TRAVOS, which are used as illustrative
reputation assessment models in this paper.
4.1. Explanation Arguments
We first look at the possible classes of reasons why a provider may have a
better reputation than another. Such classes are associated with the di↵erent 345
components that are part of MTRM. Each class has a corresponding argument
type that can be used as part of an explanation. The generation of arguments
here is similar to the identification of decisive criteria to explain choices made
using multi-attribute decision models. We select, adapt and combine the
algo-rithms of Labreuche [9] and Nunes et al. [10] to produce our arguments. As 350
described earlier, an agent’s overall trust score is a weighted mean of term trust
values, and each of these can be decomposed into trust values for di↵erent
rep-utation types. Correspondingly, our argument types are split into three groups,
namely decisive terms, decisive reputation types, and reputation model-specific
arguments, as described below. For simplicity, but without loss of generality, 355
we assume that ratings are in [0,1], given that the approaches we leverage use
this range. FIRE and TRAVOS ratings can be easily mapped to this range.
4.1.1. Argument: Decisive Terms
The reputation of a provider for a client is a balance among trust values for
8 9 10 11 12 13 14 15 16 17 18 19 20 21 22 23 24 25 26 27 28 29 30 31 32 33 34 35 36 37 38 39 40 41 42 43 44 45 46 47 48 49 50 51 52 53 54 55 56 57
timeliness. Some terms may be irrelevant with respect to why one provider is
more trusted than another, either because they have low weight for the client
or because the di↵erences between term trust values for providers are small. To
explain why providerbhas a better overall trust score than providerb0 for an
agenta, we must identify thedecisivetermsD(a, b, b0) =hP, Cithat lead to this
365
conclusion, whereP andCare sets of terms that are the decisiveprosandcons
of bwith respect to b0, respectively. For example, ifP = {quality, cost} and
C ={timeliness}, we can derive an argument of the form “b is more trusted
thanb0because it has higher trust for quality and cost, even thoughb0has higher
trust for timeliness”. 370
A trivial case is that ofdomination, whenbhas advantages compared tob0
with respect to some terms and no disadvantages with respect to the remaining
terms. According to Labreuche, important terms are those that have weights
higher than the reference weight, which is defined as the weight that makes all
terms equality important (used in thenot on averageanchor, N OA). That is,
if there arenterms, the reference weight is!A= 1/n. We need to adapt this to
take into account the trust values for terms. Considering the di↵erence between
term trust for a termtfor providersbandb0,
t=|T(a, b, t) T(a, b0, t)|, we can say that the reference value di↵erence is A =
P t2T t
|T| , where T is the set of terms. Thus, A is the average of the di↵erences between trust values
for all terms. Given the reference weight and reference value di↵erence, the
reference weighted value di↵erence is !A· A. Decisive terms in the case of
domination are consequently those whose weighted value di↵erence is higher
than the reference weighted value di↵erence, i.e.
DDom(a, b, b0) =h{t2T|!t· t>!A· A},;i (12)
Informally, decisive pros are terms that have: (i) above average weight and
value, (ii) very high weight, or (iii) very high value. In this context “very high”
means that even though t< A,!tis high enough to cause!t· t>!A· A,
and the same reasoning is applied to t. As providerbdominatesb0, there are
8 9 10 11 12 13 14 15 16 17 18 19 20 21 22 23 24 25 26 27 28 29 30 31 32 33 34 35 36 37 38 39 40 41 42 43 44 45 46 47 48 49 50 51 52 53 54 55 56 57 58
In order to illustrate the domination case, we use the example introduced in
the previous section, considering the values presented in Table 1. By analysing
the term trusts of agents B and C, it is possible to see that B dominatesC,
becauseBhas higher trust values for all terms. In order to identify the decisive
terms, we first calculate the reference value di↵erence, which is
A=|0.80 0.18|+|0.59 0.19|+|0.38 0.15|
3 =
0.63 + 0.40 + 0.23
3 = 0.42
As!A= 0.33,!A· A= 0.14. Calculating the weighted di↵erences for quality,
timeliness and costs, we obtain 0.28, 0.14 and 0.05, respectively. As only the
first two are above the reference weighted value di↵erence1, they are the decisive
terms. An explanation argument, in this case, would be as follows.
Example 1: Bhas a better reputation thanC, because it is better in all aspects
that you consider in your preferences, mainly with respect to timeliness, and quality.
When dominance is not the case, we could apply either Labreuche’s
an-chors [9] or the patterns of Nunes et al. [10] to select decisive criteria. As the
number of terms|T|may be high and Labreuche’s approach may have
perfor-mance issues [10], we use the latter, which is briefly explained as follows. We
first define T+ ={t2T|T(a, b, t) >T(a, b0, t)}and T ={t2T|T(a, b, t) <
T(a, b0, t)}, which are the sets of all pros and cons of bwith respect tob0,
re-spectively. Using these patterns, the decisive criteria isDDC(a, b, b0) =hT⇤
+, T⇤i,
such thatT⇤
+✓T+,T⇤✓T , and
X
t2T⇤ +
!t· t> X
t2T /T⇤
!t· t (13)
T⇤
+ andT⇤ are both minimal in the sense of✓. WhenT⇤=;, it is a decisive
380
criteria pattern, otherwise it is a trade-o↵resolution pattern.
In order to better understand the selection of decisive terms when there
is no dominance, we use our running example. Consider agents B and D.
8 9 10 11 12 13 14 15 16 17 18 19 20 21 22 23 24 25 26 27 28 29 30 31 32 33 34 35 36 37 38 39 40 41 42 43 44 45 46 47 48 49 50 51 52 53 54 55 56 57
According to the trust value, the former has two pros, namely quality (weighted
di↵erence is 0.12) and cost (weighted di↵erence is 0.06), while the latter has 385
only timeliness (weighted di↵erence is 0.11) as pros. In order to justify whyD
is less trustworthy thanB, considering only quality would be enough, because its
weighted di↵erence is already higher than the weighted di↵erence of timeliness
(its con). Therefore, quality is B’s decisive criteria with respect toD. This is
illustrated in the argument below. 390
Example 2:Bhas a better reputation thanD, mainly due to quality.
4.1.2. Argument: Decisive Reputation Types
The key argument produced to explain why providerbis more trusted than
providerb0 is the set of terms that are the decisive pros ofbwith respect tob0,
and occasionally the decisive cons ofb0. Term trusts are derived from ratings of
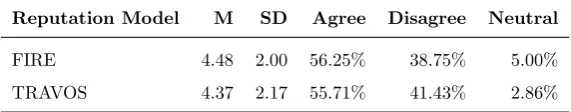
di↵erent kinds of sources, referred to as reputation types,K, being a composition 395
of trust values considering di↵erent sources. Therefore, we can again leverage
algorithms used for multi-attribute decision models, to refine the explanation.
When b dominates b0 for a term t, i.e. there exists K in the set of
repu-tation types such that TK(a, b, t) > TK(a, b0, t) and there is no K0 such that
TK0(a, b, t) < TK0(a, b0, t), then stating that t is a decisive term is sufficient, 400
and no additional argument is needed. In other cases, it is relevant to add
new arguments to the explanation. For example, assume that bhas a higher
trust score thanb0 considering a componentI (for interaction trust), b0 has a
higher trust score thanbconsideringW (for witness trust), and!I !W (Iis
more important thanW). In this case, it is helpful to state the argument “even 405
though b0 has higher ratings from third party reports, bhas higher ratings from
direct experience, which is more important.”
Our pairwise analysis of weights and values is done with Labreuche’sinvert
anchor, IV T. Although this anchor had performance issues in a previously
performed experiment with human participants [10], this occurred where there 410
8 9 10 11 12 13 14 15 16 17 18 19 20 21 22 23 24 25 26 27 28 29 30 31 32 33 34 35 36 37 38 39 40 41 42 43 44 45 46 47 48 49 50 51 52 53 54 55 56 57 58
types. We assume there is a small number of reputation types (e.g. there are
four in FIRE and two in TRAVOS) and so performance is not an issue here.
The argument given for explaining trust values considering reputation types
is a permutation ⇡(a, b, b0, t) = {(K, K0) 2 S2}, where S ✓ KSet, such that
415
T(a, b, t) <⇡(a,b,b0,t) T(a, b0, t). The operator <⇡(a,b,b0,t) compares two term trusts applying the permutation⇡(a, b, b0, t) to reputation type weights.
Conse-quently,⇡(a, b, b0, t) gives a set of pairwise changes in weights, which causes the
term trust of b0 to be higher than that ofb. Labreuche provides a
branch-and-bound algorithm for the determination of this kind of explanation [9], which for 420
brevity is not reproduced here. Given that there are limited possible
permuta-tions in our case, algorithmic efficiency is not critical.
Considering our running example, we have a case of decisive reputation types
considering agentsBandEwith respect to the timeliness term. The trust value
of agentBis better considering interaction ratings (0.55>0.20), while the trust 425
value of agent E is better considering witnesses ratings (1.00>0.70). If the
weights given to the interaction and witnesses ratings were inverted, E would
have a higher term trust than B—timeliness trust would be 0.66 for B and
0.80 forE, instead of 0.59 and 0.40, respectively. We present below a textual
argument that gives this explanation. 430
Example 3: Considering timeliness, even thoughE has higher reputation with
respect to witness reputation, which is less important,Bhas has higher reputation with
respect to own interaction, which is more important.
4.1.3. Reputation Model-specific Arguments
The way that trust and reputation values are derived from ratings is di↵erent
for each reputation model. As a consequence, it is possible to provide further
arguments other than our generic arguments if we take model particularities
into account. In this case, model-specific arguments can be generated and used 435
to supplement the generic arguments. In addition, arguments can be added
8 9 10 11 12 13 14 15 16 17 18 19 20 21 22 23 24 25 26 27 28 29 30 31 32 33 34 35 36 37 38 39 40 41 42 43 44 45 46 47 48 49 50 51 52 53 54 55 56 57
and term trusts. Here, to illustrate these possibilities, we present two
model-specific arguments: a FIRE-model-specific argument associated with trust values and
a TRAVOS-specific argument to further explain term trusts. 440
FIRE-specific Argument: Recency. The trust value for a particular reputation
type in FIRE is calculated through a weighted mean of available ratings vi.
Weights can be used to assign more importance to particular ratings, specifically
more recent ratings have a higher weight. The ratings are thus scaled using a
rating recency factor , as introduced before. The recency factor may play a
key role both in the overall trust score and in the trust value for particulartand
K. The overall trust score of a provider uses! (ri) to combine available ratings
RK(a, b, t), associated with a particular a, band t. In this case, we can also consider a reference rating weight function !A
K, which is the average weight, i.e.
!AK= 1
|RK(a, b, t)| (14)
Given this reference function, two situations might occur. First, the order
derived from the overall trust score of providers b and b0, calculated taking
into account recency, conflicts with the order derived from the overall trust
score calculated using!A
K. That is, we haveT(a, b)>T(a, b
0) andTA(a, b)<
TA(a, b0), whereTA(a, b) is the overall trust calculated using!A
K. Second, even 445
though this situation may not occur, there may still be cases whereTK(a, b, t)>
TK(a, b0, t) andTA
K(a, b, t)<TKA(a, b0, t), for a particularKandt. In the first scenario, we add an argument F(a, b, b0) to the explanation explaining that
“although on averageb0 has higher ratings thanb, recentlybhas been receiving
higher ratings thanb0, which are more valuable”. In the second case, we must
450
add a finer-grained argument F(a, b, b0, t, K), for specific K and t: “although
on averageb0has higher ratings for t thanb, considering K, recentlybhas been
receiving higher ratings thanb0, which are more valuable”.
TRAVOS-specific Argument: Low Confidence. FIRE uses weights of
8 9 10 11 12 13 14 15 16 17 18 19 20 21 22 23 24 25 26 27 28 29 30 31 32 33 34 35 36 37 38 39 40 41 42 43 44 45 46 47 48 49 50 51 52 53 54 55 56 57 58
remain fixed unless an assessor explicitly changes them. Therefore, a set of
in-teraction and witness ratings does not influence the weights of reputation types
to calculate a trust score. TRAVOS, on the other hand, evaluates how useful
interaction ratings are, before taking witness ratings into account. If an
asses-sor does not have enough confidence into its own ratings, i.e. the confidence is 460
below a given threshold, then witness ratings are used, otherwise it will rely on
its own ratings.
Therefore, it is important to know whether the trust score is based solely
on interaction ratings or on both interaction and witness ratings. If⇢I(a, b, t)
(interaction confidence) is below a threshold set by the assessor, for any of the 465
providers being assessed, it means that witness ratings are being taken into
account to consider bbetter than b0, i.e.TW(a, b, t)>TW(a, b0, t). When this
is the case, we add an argument C(a, b, b0, t) to the explanation, which can
be written in natural language in the following form: “although you have had
limited previous interactions with either borb0 with respect tot, the former is
470
considered better than the latter by witnesses”.
4.2. Explanation Generation
Above, we introduced the di↵erent arguments that can be used to form an
explanation to justify why a providerbhas a higher trust score than a providerb0.
In this section, we show how to generate such an explanation. We first identify 475
our coarse-grained argument to justify trust scores. This argument is composed
of decisive terms, which has the formD(a, b, b0) and gives the decisive pros and
cons justifying the overall trust scores. When bdominatesb0, i.e. existst2T
such that T(a, b, t) >T(a, b0, t) and there is not0 2 T such thatT(a, b, t0) <
T(a, b0, t0), the decisive criteria are given byDDom(a, b, b0), otherwise they are
480
given byDDC(a, b, b0).
Once we know the decisive criteria that justify trust scores, we can provide
fine-grained arguments that provide further understanding, considering decisive
terms t2P. First, we search for those that have a trust score associated with
decisive reputation types. This is given by⇡(a, b, b0, t), which is a permutation
8 9 10 11 12 13 14 15 16 17 18 19 20 21 22 23 24 25 26 27 28 29 30 31 32 33 34 35 36 37 38 39 40 41 42 43 44 45 46 47 48 49 50 51 52 53 54 55 56 57
Algorithm 1:Expl(a, b, b0) Input:a: an agent;b, b0: service providers
Output: : explanation with a set of arguments
1 ifdominates(b,b’)then
2 {DDom(a, b, b0)}; 3 else
4 {DDC(a, b, b0)}; 5 addSpecificArguments( ); 6 foreacht2Pdo
7 if9⇡(a, b, b0, t)such thatT(a, b, t)<⇡T(a, b0, t)then
8 [{⇡(a, b, b0, t)};
9 addSpecificTermTrustArguments( , t,T(a, b, t),T(a, b, t0)); 10 foreachK2KSetdo
11 addSpecificTrustValueArguments( , t, K,TK(a, b, t),TK(a, b, t0));
12 return ;
of weights given for the di↵erent reputation types, indicating that the weights
involved in that permutation are decisive, because if they were assigned in a
di↵erent way, we would have T(a, b, t) < T(a, b0, t). Second, we add
model-specific arguments. For example, in the case of FIRE, the argumentsF(a, b, b0)
andF(a, b, b0, t, K) are added when the selected recency weight function is the
490
cause for making the trust value ofbhigher than that ofb0, i.e. if equal weights
were given to all ratings, this would not have been the case. While in the case
of TRAVOS, the argument C(a, b, b0, t) is added when interaction ratings are
limited, and thus the opinions of witnesses are taken into account.
This method is presented in Algorithm 1, which generates an explanation 495
Expl(a, b, b0) to justify why providerbhas a higher trust score than providerb0,
for agenta. An explanation is thus a set of arguments of the types introduced
above. Note that in Algorithm 1, fine-grained arguments are generated only
for terms that are decisive pros. However, arguments may be also generated
for decisive cons, if one wants to provide further details about the trust score. 500
No fine-grained arguments are generated for the remaining terms, since they
are not decisive. In addition, Algorithm 1 calls functions that add additional
arguments to the explanations. These functions must be specified for specific
8 9 10 11 12 13 14 15 16 17 18 19 20 21 22 23 24 25 26 27 28 29 30 31 32 33 34 35 36 37 38 39 40 41 42 43 44 45 46 47 48 49 50 51 52 53 54 55 56 57 58
Algorithm 2:FIRE: addSpecificArguments Input: : explanation
Output: : explanation with added arguments
1 ifT(a, b)>T(a, b0)andTA(a, b)<TA(a, b0)then
2 [{F(a, b, b0)};
3 return ;
Algorithm 3:FIRE: addSpecificTrustValueArguments
Input: : explanation;t: term;K: reputation typeTK(a, b, t),TK(a, b0, t): trust values
Output: : explanation with added arguments
1 ifTK(a, b, t)>TK(a, b0, t)andTA
K(a, b, t)<TKA(a, b0, t)then
2 [{F(a, b, b0, t, K)};
3 return ;
Algorithm 4:TRAVOS: addSpecificTermTrustArguments Input: : explanation;t: term;⇢I(a, b, t),⇢I(a, b0, t): confidence;TW(a, b, t),
TW(a, b0, t): trust values
Output: : explanation with added arguments
1 if(⇢I(a, b, t)<✏or⇢I(a, b0, t)<✏) andTW(a, b, t)>TW(a, b0, t).then
2 [{C(a, b, b0, t)};
3 return ;
to explain the trust score as a whole and particular trust values, as shown in 505
Algorithms 2 and 3. Similarly, for TRAVOS we can add arguments to explain
term trust, as shown in Algorithm 4.
Finally, we now show how an explanation Expl(a, b, b0), which is a set of
arguments, can be translated to human-readable form. For illustration, we
adopt a textual form. Parts shown in brackets are optional, and thus may not 510
appear in all explanations. Note that two of the optional arguments are
FIRE-specific and one is TRAVOS-FIRE-specific. In addition, optional arguments may be
added more than once, depending on the number of arguments that are part of
the explanation.
8 9 10 11 12 13 14 15 16 17 18 19 20 21 22 23 24 25 26 27 28 29 30 31 32 33 34 35 36 37 38 39 40 41 42 43 44 45 46 47 48 49 50 51 52 53 54 55 56 57
due to list of pros inP [, even though Providerb0 provides better
list of cons inC ]C6=;.
[In addition, Providerb0 has, on average, higher ratings than Providerb , but
Providerb has been recently receiving higher ratings than Providerb0 , which are
more valuable.]F(a,b,b0)
[Considering Termt , even though Providerb0 has a higher trust value
consid-ering Reputation TypeK , which is less important, Providerb has a higher trust
value considering Reputation TypeK0 , which is more important.]
8(K,K0)2⇡(a,b,b0,t) [Moreover, although you have had limited previous interactions with either
Providerb or Providerb0 with respect to Termt , the former is considered
better than the latter by witnesses.]8C(a,b,b0,t)
[Moreover, Providerb0 has, on average, higher ratings for Termt than b,
considering Reputation TypeK , but Providerb has been recently receiving higher
ratings than Providerb0 , which are more valuable.]
8F(a,b,b0,t,K)
5. User Study 515
In this section, we therefore present a user study conducted to evaluate our
proposed explanation approach.
5.1. Goal and Research Questions
Reputation assessment models are often used in multiagent systems to allow
autonomous agents (which can be humans) to identify in which agents they can 520
trust to interact with. Our explanations can be used as a means for agents
to exchange information regarding the reputation of other agents, without the
need for exposing the reputation model details or detailed scores. However, as
our explanations reveal less information than components of trust scores, we
must evaluate if they are helpful for agents or users to better choose another 525
agent (which can be, e.g. a service provider) to interact with. More specifically,
we aim to answer the following research questions.
1. Are our explanations more e↵ective in helping users to understand
reputation-based recommendations than quantitative scores alone?
8 9 10 11 12 13 14 15 16 17 18 19 20 21 22 23 24 25 26 27 28 29 30 31 32 33 34 35 36 37 38 39 40 41 42 43 44 45 46 47 48 49 50 51 52 53 54 55 56 57 58
In order to answer these questions, we present our explanations to users using
our example explanation templates. Our hypothesis is that users are better
able to understand the rationale behind recommendations when they receive
explanations instead of only quantitative information (i.e. reputation scores).
Our first research question is aligned with this hypothesis. However, given that 535
the e↵ectiveness of such explanations may be di↵erent to how users perceive
their usefulness, the second research question aims to explore this relationship.
5.2. Procedure
Our user study followed an adaptation of the protocol previously adopted to
conduct user studies that involve the evaluation of explanations in recommender 540
systems [11, 16]. The steps of this protocol are the following [11]: (1) get sample
ratings from the user; (2) compute a recommendationr; (3) for each explanation
system, present rto the user with e’s explanation and ask the user to rater;
and (4) ask the user to try r and then rate it again. In the remainder of this
section we present the steps we followed to conduct the user study. 545
Construction of Provider Model. Our study involves participants rating and
receiving recommendations of service providers based on reputation models.
In order to have a set of providers to be part of the study, we create a set
of simulated providers. Providers are described with a model that specifies
the probabilities of transaction outcomes, e.g. considering a provider of delivery 550
services, an outcome is the number of days taken to deliver a package. Outcomes
are associated with terms, e.g. the outcome of delivering a package is associated
with the term timeliness.
Participant Data and Preference Elicitation. Participants initiate the study by
providing data about themselves and preferences for di↵erent terms. Addition-555
ally, they provide preferences for reputation types, required by the FIRE model.
Collection of Sample Ratings. From each participant, we collect 15 sample
rat-ings in the following way: (i) randomly select a provider, (ii) simulate an
8 9 10 11 12 13 14 15 16 17 18 19 20 21 22 23 24 25 26 27 28 29 30 31 32 33 34 35 36 37 38 39 40 41 42 43 44 45 46 47 48 49 50 51 52 53 54 55 56 57
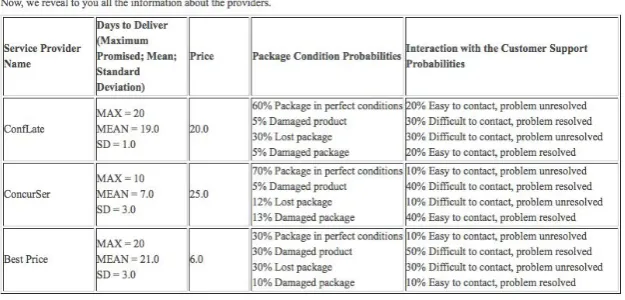
the result of the interaction to the participant and ask them to rate the provider 560
with respect to each term. We present an example of an interaction outcome in
Figure 1a. Note that providers may be selected more than once, and likely have
di↵erent outcomes in each interaction. Each set of ratings is associated with a
round, which is interpreted as a timestamp for FIRE and a round for TRAVOS.
These sample ratings are used to build both the FIRE and TRAVOS models for 565
each participant. Participants provide ratings with a value between 0 and 1 (or
not applicable). For FIRE, this value is used as is, and for TRAVOS we used a
threshold of 0.5 to distinguish between successful and unsuccessful interactions.
Moreover, TRAVOS requires a confidence threshold, which was set to 0.2. We
selected a low threshold given that participants have few repeated experiences 570
with the same provider, causing confidence to be usually low. In this way, we
balance situations where witness opinions are used or not.
Explanation Evaluation. We randomly select three providers from the set of
providers and rank them using their computed reputation scores (step 2 of the
protocol), which are based on the reputation model, ratings (from the partic-575
ipant and peers) and preferences. We randomly select the model to be used
and which explanatory information is provided to users: (i) FIRE with scores
alone, (ii) FIRE with explanation arguments alone, (iii) TRAVOS with scores
alone, or (iv) TRAVOS with explanation arguments alone. Examples of
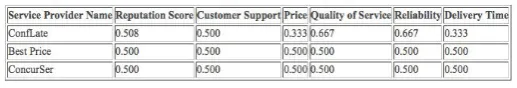
expla-nation arguments and scores are shown in Figures 2a and 2b, respectively. Note 580
that participants are not aware that there are two underlying reputation
mod-els driving the recommendations. Then, we show to participants the provider
ranking, together with the selected explanatory information (step 3 of the
pro-tocol), and ask them to answer in a 7-point Likert scale whether they agree
with the statement: Considering the information provided above, I would order 585
the presented providers in the same way that they were ordered, according to
my preferences. Next, we show participants the same ranking together with the
full provider model (i.e. the probabilities of the outcomes), such as presented in
8 9 10 11 12 13 14 15 16 17 18 19 20 21 22 23 24 25 26 27 28 29 30 31 32 33 34 35 36 37 38 39 40 41 42 43 44 45 46 47 48 49 50 51 52 53 54 55 56 57 58
(a) Sample Ratings: Generated Outcome.
[image:29.595.142.455.294.444.2](b) Full Provider Information.
Figure 1: Screenshots of the Web Application (1).
them again the same question (step 4 of the protocol). Based on these answers 590
we measure how the scores given for the first question (scores or explanation
arguments) di↵er from the scores given for the provider model. With full
in-formation of providers’ probabilities, participants know exactly what to expect
by interacting with providers; however, this complete information is usually
un-known. Therefore, the participant score with respect to full information is used 595
as a baseline: the closer the participant score for explanation arguments or
rep-utation scores, the better. This is therefore the metric we collect to evaluate
the e↵ectiveness of explanatory information, in the form of absolute di↵erence
between the two answers, referred to asscore di↵erence. This step is repeated
8 9 10 11 12 13 14 15 16 17 18 19 20 21 22 23 24 25 26 27 28 29 30 31 32 33 34 35 36 37 38 39 40 41 42 43 44 45 46 47 48 49 50 51 52 53 54 55 56 57
(a) Explanation Arguments.
[image:30.595.145.404.346.390.2](b) Explanation Scores.
Figure 2: Screenshots of the Web Application (2).
Perceived E↵ectiveness Questionnaire. To collect information regarding the
per-ceived value of the provided explanations, we ask participants to evaluate (in a
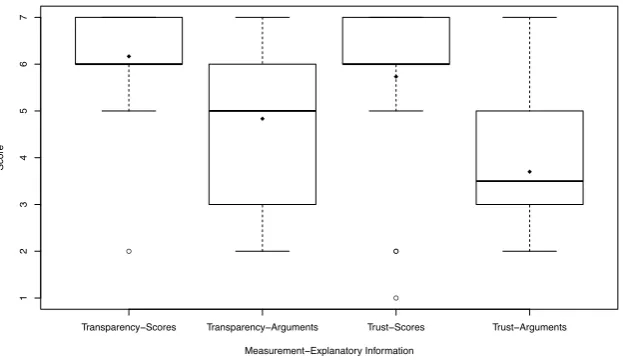
7-point Likert scale) the two forms of describing providers (with textual
explana-tions and with reputation scores) with respect to (i) transparency: I understand
why the providers were ranked in the presented way through the explanationsand 605
(ii) trust: I feel that these explanations are trustworthy. In addition, we also ask
an open-ended question to participants, in which participants have to explain
their preference for scores or explanation arguments.
5.3. Target Domain and Application Support
To execute the procedure described above, we implemented a web application 610
to support the study, from which screenshots are presented in Figure 1 and 2.
We selected delivery services as the domain, given that it is suitable for our
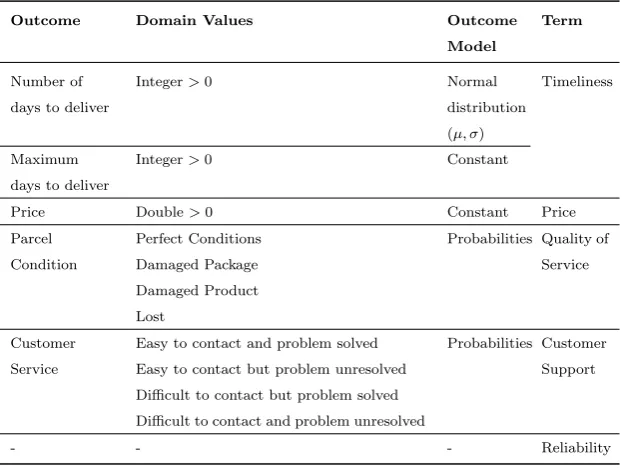
8 9 10 11 12 13 14 15 16 17 18 19 20 21 22 23 24 25 26 27 28 29 30 31 32 33 34 35 36 37 38 39 40 41 42 43 44 45 46 47 48 49 50 51 52 53 54 55 56 57 58
Table 2: Provider Model and Terms.
Outcome Domain Values Outcome Term
Model
Number of
days to deliver
Integer>0 Normal
distribution
(µ, )
Timeliness
Maximum
days to deliver
Integer>0 Constant
Price Double>0 Constant Price
Parcel
Condition
Perfect Conditions
Damaged Package
Damaged Product
Lost
Probabilities Quality of
Service
Customer
Service
Easy to contact and problem solved
Easy to contact but problem unresolved
Difficult to contact but problem solved
Difficult to contact and problem unresolved
Probabilities Customer
Support
- - - Reliability
once and, if not, they are aware of how it works and its possible outcomes, and
(ii) participants do not need toconcretely experience such services to be able 615
to evaluate them, i.e. the domain can be simulated.
Service providers are modelled with probabilities associated with di↵erent
outcomes, which are listed in Table 2. For example, providers are associated
with a constant value that indicates the maximum days they take to deliver
a package. They are also associated with a variable representing the average 620
number of days that it takes to deliver packages and the standard deviation.
Therefore, to simulate the number of days taken we used randomisation with a
normal distribution defined by these parameters.
Participants evaluate providers with respect to each term presented in the
rightmost column of Table 2. These terms are associated with the outcome that 625
we believe that the participant would take into account to rate a term. Note
8 9 10 11 12 13 14 15 16 17 18 19 20 21 22 23 24 25 26 27 28 29 30 31 32 33 34 35 36 37 38 39 40 41 42 43 44 45 46 47 48 49 50 51 52 53 54 55 56 57
Table 3: Characteristics of Participants (N = 30).
Age 16–25 years 26–35 years
23 (77%) 7 (23%)
Gender Male Female
29 (97%) 1 (3%)
Course Undergraduate Graduate
Level 23 (77%) 7 (23%)
related to repeated experiences that the participant has with the same provider.
We modelled 10 providers, each being associated with two sets of model
parameters. We use the first set of parameters to collect the first half of the 630
set of sample ratings, and the second set of parameters to collect the remaining
samples. In this way, we simulate change in the providers’ behaviour, and allow
for the fact that the ratings provided can change over time.
5.4. Participants and Preferences
Our study participants were selected using convenience sampling. Gradu-635
ate and undergraduate students of a Brazilian Computer Science program were
invited to participate as volunteers. Data was collected in two separate time
slots, and participants that participated within the same time slot were
consid-ered peers, in order to compute witness trust. In total, our study involved 30
participants, such that 9 participated in the first time slot and 21 participated 640
in the second. We detail characteristics of the participants in Table 3.
In addition to collecting participant characteristics, we also asked them to
provide their preferences with respect to reputation types and terms.
Descrip-tive information was provided to allow them to understand the required
infor-mation. In Table 4, we present the preferences provided by participants. Note 645