1
Effect of magnesium addition on the cell structure of foams produced from
1re-melted aluminium alloy scrap
2G. S. Vinod-Kumar1,4, K. Heim1,2, J. Jerry4, F. Garcia-Moreno1,2,A. R. Kennedy3, J. Banhart1,2
3
1Technische Universität Berlin, Hardenbergstraße 36, 10623 Berlin, Germany
4
2Helmholtz-Zentrum Berlin für Materialien und Energie, Hahn Meitner Platz, 14109 Berlin, Germany
5
3Division of Manufacturing, University of Nottingham, Nottingham, NG2 7RD, UK,
6
4 SRM Research Institute, SRM University, Kattankulathur, 603203, India
7
Abstract 8
Closed-cell foams were produced from re-melted aluminium alloy scrap that contained 9
0.13 wt.% Mg magnesium in the as-received state and higher levels after adding 1, 2 or 10
5 wt.% Mg. The excess Mg gave rise to the fragmentation of long oxide filaments present in 11
the scrap alloy into smaller filaments and improved its distribution and wetting by the Al ma-12
trix. Foaming the re-melted scrap alloy containing 1,2 and 5 wt.% Mg excess showed stabil-13
ity and good expansion in comparison to the scrap alloy containing 0.13 wt.% Mg only, but 14
the cells became non-equiaxed when the Mg concentration was high (2 wt.% excess) due to 15
cell wall rupture during solidification. Compressibility and energy absorption behaviour were 16
studied for scrap alloy foams containing 1 wt.% Mg excess, which is the optimum level to 17
obtain good expansion, stability and uniform cell size. Foams with densities in the range of 18
0.2-0.4 g·cm-1produced by holding at the foaming temperature for different times were used 19
for the investigation. A uniform cell structure led to flatter stress plateaus, higher energy ab-20
sorption efficiencies and reduced "knockdown" in strength compared with commercial foams 21
made by gas bubbling. The mechanical performance found is comparable to that of commer-22
cial foams made by a similar method but the expected costs are lower. 23
2 Keywords
24
Scrap aluminium alloy, Closed cell Al foams, oxide bi-films, MgAl2O4 (spinal), compressive
25
strength 26
1. Introduction 27
Closed-cell aluminum alloy foams produced through the liquid metal route are potentially 28
cheaper in comparison to foams produced using metal powders because of the lower number 29
of processing steps[1-2]. Liquid metal foaming requires ceramic or intermetallic particles for 30
foam stabilization [3-5].Ceramic particles such as SiC, Al2O3, TiB2, TiC[6] and also
31
MgAl2O4[7] have been found to be effective stabilizing agents for aluminum foams but the
32
introduction of these particles into the matrix requires additional processing steps. There is a 33
school of thought that oxide bi-films which get entrapped during ingot casting will also acts 34
as stabilisation agent for foams[6, 8]. 35
Attempts have been made to utilise the foam-stabilizing properties of oxide bi-films by using 36
scrap aluminium alloys produced by melting swarfs (machining chips and turnings of auto-37
motive castings) as a foamable precursor. By re-melting these swarfs the thick oxide skins 38
contained are introduced into the alloy as oxide films. Ha et al. reported that these oxide films 39
enhance viscosity of the melt and aid in foaming [9]. Haesche et al. have utilised thixo cast-40
ing to produce foamable precursors from AlSi9Cu3 or AlMg4.5Mn alloy chips by using-41
CaCO3 or CaMg(CO3)2as a blowing agent[10]. However, in all previous studies it was
re-42
ported that the observed cell morphology of scrap aluminium alloy foam was distorted due to 43
the poor distribution of inherent oxides in the matrix. Using scrap alloys for foaming finds 44
potential due to their low cost in comparison to expensive particle-reinforced metal matrix 45
composites produced by ex-situ or in-situ methods. The authors have demonstrated in previ-46
ous studies[11-12]that re-melted scrap aluminium alloy foams with optimum expansion and 47
3 LM26 alloy castings) and holding them in the liquid state during which the oxides are dis-49
persed. To enable the reaction, the oxide concentration in the scrap was increased by heat 50
treating the swarfs at 500 °C for several hours before melting. 1 or 2 wt.% Mg was added and 51
this Mg reacts with the oxides to form MgAl2O4 (spinel) and MgO as reaction products. This
52
promotes good wetting of oxides and distributes them uniformly in the Al matrix. 53
In the work presented here, the cell structure and cell size distribution of re-melted Al scrap 54
alloy foams containing various concentrations of Mg (0.13 wt.% as-received, and 1, 2 and 5 55
wt.% in excess to this level) and foamed at various holding time was investigated. The aim of 56
this study was to understand to which extent the inherent oxides filaments undergo fragmen-57
tation and how much MgAl2O4 and MgO is formed when Mg is added at increased levels.
58
The results are correlated to the expansion, stability, cell structure and cell size distribution of 59
the foams produced. The main difference between the scrap alloy used in the present and pre-60
vious work [11-12] is the oxide concentration, which is less in the present work since no heat 61
treatment was carried out for the swarfs before melting. 62
The prospects of using re-melted Al scrap alloy foams in structural applications have to be 63
evaluated even though they show a promising foaming behaviour. The base alloy of the 64
swarfs, LM26, exhibits very low ductility and the presence of oxides further decreases ductil-65
ity and deteriorates the mechanical properties of the foam. Therefore, the compressibility and 66
the energy absorption behaviour of foams of various densities displaying good cell structure 67
and distribution were studied. Their performance is compared to foams made by commercial-68
ly available liquid routes, also known as Cymat and Alporas foams. 69
2. Experimental Procedure 70
The scrap used in the present study was received as mm-sized swarfs (machining chips and 71
turnings) of LM26 (Al–10 wt.%Si–3 wt.% Cu) alloy, which is commonly used for making 72
4
ured by optical emission spectroscopy (OES) is given in table 1. The machining chips already 74
contain 0.13 wt.% of Mg in the as-received state. The material was first heated to 673 K 75
(400 °C) to remove residual oil and cutting lubricants. Then it was directly converted into 76
ingots by melting in a graphite crucible at 1023 K (750 ºC). No additional heat treatment was 77
carried out as done in previous studies where the oxide content in the swarfs was increased 78
[11-12]. During melting, the chips were fused by vigorous intermittent stirring for 30 min. 79
Magnesium was admixed in excess to 0.13 wt.% (base alloy concentration) at various levels 80
(1, 2 and 5 wt.%) by using a Al-25 wt.% Mg master alloy. After this, the melt was kept iso-81
thermally at 1023 K (750 ºC) for 4 h for conditioning (reaction). The conditioned melt was 82
again stirred and cast into a steel mould. X-ray diffraction for phase analysis of the scrap al-83
loys was performed using Cu-Kα radiation. The re-melted scrap alloys (and cross sections of
84
foams) were metallographically polished and electro-polished using a mixture of orthophos-85
phoric acid, ethanol and water as the electrolyte. The polished samples were observed using a 86
high-resolution scanning electron microscope (HRSEM). Elemental analysis was done using 87
energy dispersive X-ray spectroscopy (EDX). 88
Foaming was performed by melting 40 g of each alloy in an alumina crucible in a re-89
sistive heating furnace at 973 K (700 ºC). After the melt had reached the desired temperature, 90
1.6 wt.% of as-received TiH2 powder was admixed to the melt using a graphite stirrer rotating
91
at 600 rpm for 80 s. After mixing, the melt was held isothermally inside the furnace for dif-92
ferent holding times, namely100 s, 140 s and 180 s, during which it was allowed to foam. 93
After this, the sample was taken out and allowed to solidify in resting air. X-ray tomography 94
of the foams was performed by rotating them through 360° in steps of 1° while acquiring X-ray 95
radiographic images after each step. Three-dimensional (3D) reconstruction of the data was car-96
ried out using the commercial software ‘Octopus’. After reconstruction, the commercial software 97
5 tribution and circularity for selected foams was calculated by analyzing the reconstructed tomo-99
graphic slices taken from the central part of the foams. This analysis was performed by using the 100
software ‘Image J 1.35j’. 101
For compression tests, foams were made from the alloy containing a Mg excess of 1 wt.% 102
and applying holding times of either 100 s or 140 s. Samples of(25×25×25) mm3size were
103
sliced by electro-discharge machining. Compression testing was performed at a rate of 104
2 mm.min-1. Mechanical testing and data analysis were conducted according to “ISO 105
13314:2011(E)” standard. 106
107
3. Results 108
Figures 1a and b show SEM photomicrographs of re-melted scrap alloy in the as-received 109
condition (containing 0.13wt.% of Mg) and in the alloy with 1wt.% excess Mg addition. The 110
longer aluminium oxide filaments seen in the aluminium matrix (Fig. 1a) containing only 111
0.13 wt.% of Mg get fragmented into smaller oxide films after adding 1 wt.% Mg(Fig. 1b). 112
The alloy also shows Fe- and Cu-based intermetallic compounds in the matrix. A closer look 113
at the microstructure (Fig.1c,d) of the re-melted scrap alloy containing 1wt.% Mg shows that 114
the surface of the fragmented oxide films is covered by fine MgAl2O4 (spinel) particles of less
115
than 2 m size. 116
6 118
119
Fig.1 SEM micrographs of re-melted aluminium scrap alloy. (a) As received (0.13 wt.%Mg), 120
(b) with 1 wt.% Mg excess, (c) MgAl2O4 particles on the surface of an Al oxide film,
121
(d) octahedral morphology of MgAl2O4 spinel particles.
122
The EDX stacked spectrums (Fig.2) taken at different particles (one spectrum for each parti-123
cle) confirms the presence of Al2O3, MgAl2O4 and other Fe- and Cu-based intermetallic
com-124
pounds in the aluminium matrix. The regions in which EDX spectra were taken are encircled 125
in the SEM pictures (Fig.1a,c). The X-ray diffraction patterns (Fig. 3) of the re-melted alu-126
minium scrap alloys containing various amounts of Mg (0, 1, 2 and 5 wt.% in excess to the 127
0.13 wt.% in the as-received material) point at the presence of MgAl2O4, MgO, Mg2Si and
128
small amounts of other transition phases. The XRD spectra show that addition of more Mg 129
does not increase the amount of MgAl2O4 or MgO in the alloys as seen by the peak intensities
130
7 alloy, which is independent of Mg content. However, increasing the Mg content does increase 132
the level of Mg2Si formation.
133
134
Fig.2 Energy dispersive spectrum (EDX) of (1) aluminium oxide, (2) MgAl2O4, (3) Fe-based
135
and (4) Cu-based intermetallics present in the alloy. The regions in which the EDX 136
spectra were taken are encircled in the SEM micrographs of Figure 1. 137
8 139
Fig.3 XRD plots of re-melted aluminium scrap alloy with various Mg concentrations. 140
Figure 4 a,b shows X-ray tomographic reconstructions of longitudinal cross sections of foams 141
produced from re-melted scrap alloys containing 0.13 wt.% Mg. The foams were produced at 142
973 K (700 °C) and held for 100 s (Fig.4a) or 140 s (Fig.4b) and were solidified by air cool-143
ing. The foam showed good expansion after 100 s of holding at the foaming temperature and 144
its macrostructure exhibits an equiaxed cell structure and uniform cell size distribution 145
throughout the cross section. No defects such cell wall rupture, deformed cells or drainage are 146
observed. Upon holding for 140 s the foam started to collapse. The liquid sump at the bottom 147
of the foam indicates drainage (Fig. 4b).The 2Dcell size distribution of the foam obtained 148
after 100 s of holding is given in Fig. 4c.The analysis is based on the area fraction, which is 149
defined as the area contribution of a cell size class related to the total area of all the cells 150
[13].The mean cell size D as provided by log-normal fitting of the distributions is 151
3.420.1 mm. The cells in the foam held for 140 s are full of defects and irregular and there-152
9 The 2D cell circularity of the foam obtained after 100 s of holding shows (Fig. 4d) that most 154
of the cells are close to circularity, indicating that they are of equiaxed (polyhedral) shape. 155
Here, the circularity C of a cell is defined as 4𝜋𝐴/𝑃2, where A and P are the area and perime-156
ter of the cell, respectively. If C approaches 1, a cell resembles a circle. The details of the 157
analysis are reported in Ref. [13]. 158
159
160
Fig.4 X-ray tomographic reconstructions of longitudinal cross sections of foams made from 161
scrap alloy containing 0.13 wt.% Mg and produced by uninterrupted foaming in an 162
alumina crucible at 973 K (700 °C) for (a) 100 s (b) 140 s. (c) 2D cell size distribution 163
and (d) Circularity vs. equivalent diameter of the cells for the foam held for 100 s. 164
(c)
(d)
10
Figures 5 a - c shows 3D X-ray tomographic reconstructions of longitudinal cross sections of 165
foams produced from re-melted scrap alloys containing 1, 2 and 5 wt.% Mg addition. The 166
foams were produced at 973 K (700 °C) and held for 140 s before solidification. Figure 5 d 167
shows the macrostructure of the foam containing 5 wt.% Mg, which was held for 180 s. For 168
100 s holding time, the expansion was not complete for the foams containing 1, 2 and 5 wt.% 169
Mg addition. Delayed expansion of foam with increased Mg content was already reported in 170
Refs. [11-12]. The foam with 1 wt.% Mg addition showed good expansion and stability even 171
after 140 s of holding unlike the foam with 0.13 wt.% Mg content. The cells are finer and 172
equiaxed in shape and uniformly distributed throughout the cross section. The expansion ob-173
served for the foams with 2 and 5 wt.% Mg is less in comparison to that of the foam contain-174
ing 1 wt.% Mg. The cell structure of the foams with 2 and 5 wt.% Mg addition are non-175
equiaxed in shape in comparison to 1 wt.% Mg, see below for a quantitative analysis. To wit-176
ness expansion during further holding, the alloy containing 5 wt.% Mg excess was also held 177
at the foaming temperature for 180 s. The foam continued to expand, but the foam structure 178
exhibited many large cells of irregular shape after. No drainage was seen in any of the foams 179
containing 1, 2 and 5 wt.% Mg excess that was held for 140 s or 180 s. 180
181
182
11 184
185
Fig.5 X-ray tomographic reconstructions of longitudinal cross sections of scrap alloy foams 186
produced by uninterrupted foaming in an alumina crucible at 973 K (700 °C) for 140 s. (a) 187
1 wt.% Mg, (b) 2 wt.% Mg, (c) 5 wt.% Mg and (d) foam containing 5 wt.% Mg held for 188
180 s. 189
Analysis of the 2D cell size distribution was done for the foams containing 1, 2 or 5 wt.% Mg 190
excess that were held for 140 s, see Fig. 6 a-c. The foam with 1 wt.% Mg addition shows an 191
uniform cell size distribution and a mean cell size D of 3.21 0.15 mm. In contrast, the analy-192
sis reveals a non-uniform cell size distribution for the foam with 2 and 5 wt.% Mg excess 193
with slightly lower mean cell sizes. The foam containing 5 wt.% Mg excess was held for 194
(c)
(d)
12
180 s and exhibits even larger mean cell size D, see Fig. 6d. There is no trend in the cell size 195
distribution as a function of Mg addition, but there is a significant increase in the cell size 196
when the time of holding of the foams is increased to 180 s. 197
198
199
Fig.6 2D cell size distributions for scrap alloy foams produced by uninterrupted foaming in 200
an alumina crucible at 973 K (700 °C) for 140 s. (a) 1 wt.% Mg addition, (b) 2 wt.% 201
Mg addition, (c) 5 wt.% Mg addition, (d) 5 wt.% Mg addition but180 s holding time. 202
The 2D cell circularity analysis (Fig. 7a-c) of the foams with 1, 2 and 5 wt.% Mg excess held 203
for 140 s shows that a large number of cells are not equiaxed and this number increases with 204
an increase in Mg. The foam with 5 wt.% Mg excess and held for 180 s also contains non-205
equiaxed large cells. The cell circularity of the foam containing 0.13 wt.% Mg obtained after 206
(a)
(b)
(c)
13 100 s foaming (Fig.4d) is not comparable with that of the foams with 1, 2 and 5 wt.% Mg 207
excess. The former showed mostly equiaxed cells throughout the foam cross section. 208
209
[image:13.595.51.529.133.539.2]210
Fig.7 Circularity vs. equivalent diameter of the cells in re-melted scrap alloy foams produced 211
by uninterrupted foaming in an alumina crucible at 973 K (700 °C) for 140 s. (a) to (d) corre-212
sponding to Fig. 5. 213
Figure 8 shows the comparative plot of circularity of the foams containing 0.13wt.% Mg and 214
1 wt.% Mg. The mean circularity value of the former is 0.85±0.012 while the latter is 215
0.69±0.004. 216
217
218
(c)
(d)
14 219
Fig.8 Comparison of circularity of foams containing 0.13wt.% Mg (Fig. 3d) and 1 wt.% Mg 220
(Fig. 6a). The mean circularity value (Gaussian fit) of the foam containing 0.13wt.% 221
Mg is 0.85±0.012 and for the foam containing 1wt.% Mg 0.69±0.004. 222
For comparison of cell structure, an X-ray tomographic reconstruction of a transverse section 223
of the foam with 0.13 wt.% Mg obtained after 100 s of holding is compared to reconstruc-224
tions of foams containing 1, 2 or 5 wt.% Mg excess and foamed for 140 s (Fig. 9).Clearly, the 225
foams with higher Mg contents exhibit a less equiaxed cell structure and less uniform distri-226
bution in comparison to the foam with 0.13 wt.% Mg. All the elongated cells are associated 227
with remnants of broken cell walls, which indicate that cell wall rupture has taken place and 228
has caused cell coalescence. In addition, the periphery of the foams is denser for 2 and 5 wt.% 229
Mg addition, which reflects the pronounced collapse of cells taking place on the foam surface 230
during solidification. 231
15 233
234
Fig.9X-ray tomographic reconstructions of transverse sections of re-melted Al scrap alloy 235
foamsproduced by uninterrupted foaming in an alumina crucible at 973 K (700 °C). (a) 236
0.13 wt.% Mg held for 100 s,(b) 1 wt.% Mg addition, (c) 2 wt.% Mg addition, (d) 5 237
wt.% Mg addition, (b-d) held for 140 s. Arrows point at remnants of broken cell walls. 238
The foams containing 1 wt.% Mg excess obtained by foaming for 100 s and140 s were cho-239
sen for a compressibility and energy absorption study due to their stability and uniform cell 240
structure even after longer holding. Foams with 2 and 5 wt.% Mg excess possess more bro-241
ken cell walls and are therefore not taken for mechanical property evaluation. For the com-242
pression studies, 5 samples were sliced into cubes of (25×25) mm2 size from the top to the
243
(d)
(c)
16
bottom of both foams that we call foam-1and foam-2depending on whether they were held for 244
100 s or 140 s, respectively. The densities of each sample obtained in this way vary from 0.19 245
to 0.37 g.cm-1(table 2). Figure 10a presents a closer view of the cross sections of a re-melted 246
Al scrap foam containing 1 wt.% Mg excess, foamed for 140s and having a density of 247
0.19 g.cm-1 (foam-2). It is apparent that the cell structure is reasonably uniform. 248
Figures 10 b,c show the structures for Cymat and Alporas foams with densities of 0.38g.cm-1 249
and 0.22 g.cm-1, respectively[14]. Figure 10d presents the structure of a Formgrip foam with a 250
density of 0.30 g.cm-1[15]. Although the foam densities are not comparable in this image, a 251
fair comparison of the foam structures can be made. It is well known that Cymat foams dis-252
play a much wider distribution of cell sizes than Alporas foams. If foams with similar densi-253
ties are compared (all at roughly 0.2 g.cm-1) then the Cymat foam is coarser with cells of a 254
mean diameter of roughly 7–8 mm [14], compared to 3–4 mm for Alporas[14, 16-17]. The 255
cell size and uniformity for the foam made from re-melted Al scrap are unlike those for the 256
Cymat foam (made by bubbling gas into an Al-Si melt using SiC particles to stabilise the 257
bubbles) and more closely resemble those for Alporas[18]and Formgrip foams [15],which are 258
also made by TiH2 decomposition in a Al alloy melt.
17 260
Fig.10 Foam macrostructures for (a) foam made from re-melted scrap, foam2 (1 wt.% Mg 261
addition, holding time is 140s and density is 0.19 g.cm-1), (b) Cymat foam [3] (density 262
= 0.38 g.cm-1), (c) Alporas foam [3] (density = 0.22 g.cm-1) and,(d) Formgrip foam 263
(density = 0.3 g.cm-1) [4]. 264
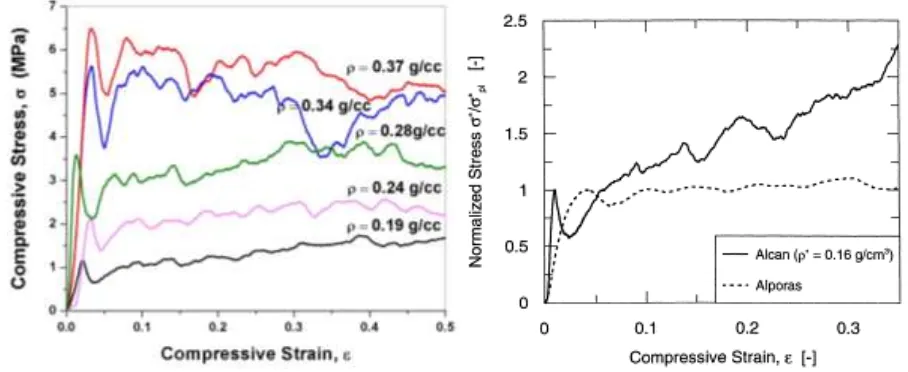
The compressive stress-strain curves for the re-melted Al scrap foams are given in Fig. 11a. 265
As expected, there is an increase in the yield stress with increasing foam density. Table 2 266
presents these values as measured from the initial maximum. Beyond yielding, the stress-267
18
observations during compressive testing of brittle fracture of the cell walls after collapse and 269
significant crumbling (images not shown). 270
Table 2 also presents data for the energy absorbed per unit volume (in MJ.m-3) at 50% strain. 271
The efficiency of energy absorption across the range of densities is roughly 80–85%. For this 272
level of compressive strain, which is below the onset of densification (at typically 65–70% 273
strain), the flat plateau for the Alporas foam means that the efficiency is >90%. For the Cy-274
mat foam, it is <70% owing to the steadily increasing stress with strain[14, 19], see Fig.11b. 275
[image:18.595.70.524.279.465.2]276
Fig.11Compressive stress–strain plots of (a) re-melted scrap alloy foams containing 1 wt.% 277
Mg excess obtained after 100 s and 140 s holding (b) Cymat (Alcan) foam and Alporas 278
foam (taken from [17]). 279
4. Discussion 280
The amount of oxide present in the alloy is 0.110.01 wt.% based on the oxygen content in 281
the swarfs (machining chips and turnings).No heat treatment was carried out to increase the 282
oxygen content in the swarfs as it was done in previous studies [11-12].If all the oxygen is 283
converted into oxide, this corresponds to 0.23 wt.% Al2O3. After melting the swarfs, the
con-284
centration of oxides in the alloy would certainly increase during prolonged holding of the 285
19 melted scrap alloy is < 1 wt.%. Magnesium added to the melt for conditioning reacts with 287
aluminium oxide and forms MgAl2O4(spinel) and MgO as already small amounts of Mg
288
(0.02 wt.%) can destabilize Al2O3 to form MgAl2O4 spinel. At higher Mg concentrations
289
(0.06 wt.%),MgO is formed at temperatures around 1000 K (727 °C)[20]. All the Mg
concen-290
trations studied here, namely 0.13% wt.% and excesses of 1, 2 and 5 wt.%, led to the for-291
mation of MgAl2O4 and MgO, but there is no significant increase in MgAl2O4 or MgO on
292
increasing the Mg concentration. This could be attributed to the large size of the oxide films. 293
Vinod-Kumar et al. have shown that complete reaction of Mg with the oxides to form large 294
volumes of MgAl2O4 requires a higher oxide concentration (e.g. 5 wt.% of SiO2) and the
ox-295
ides should be finer in size (the mean size was 44 µm in that case)[7]. In the present work, the 296
reaction is incomplete due to large oxides and therefore the excess Mg reacts with Si 297
(10.59 wt.% content in the alloy) to form Mg2Si during solidification. Therefore, adding more
298
than 1 wt.% Mg during conditioning of the melt is not useful in fragmenting the oxide films 299
or distributing them in the matrix to a greater extent. 300
The uniform and equiaxed cell structure and good expansion of re-melted Al scrap alloy foam 301
without the addition of excess Mg (Fig. 4a, content only 0.13 wt.% Mg) indicates than long 302
oxide filaments can act as a stabilizing agent but only for a shorter period (100 s). Holding 303
the liquid foam for 140 s caused collapse in the cells due to drainage, see Fig. 4b. Fragmenta-304
tion of long oxide filaments into short films and their distribution in the matrix has significant 305
impact on the foaming behaviour particularly on expansion and stability upon longer holding. 306
The equally distributed cell structure as we could see in the foam containing 1 wt.% Mg (Fig. 307
5a) may be attributed to the fragmentation of long oxide filaments into shorter oxide films 308
and good wetting aided by MgAl2O4 particles.
309
Shape irregularities, i.e. non-equiaxed cells, are found frequently for foams containing 2 or 310
20
mean circularity values shown in Fig. 8) in comparison to the foam with 0.13 wt.% Mg, but 312
not as significantly as for 2 and 5 wt.%. Assumptions were made that the increase in the vis-313
cosity of melt (containing free Mg) during stirring and admixing the blowing agent[21]could 314
be a reason for the formation of a non-equiaxed cell structure. Incidentally, Alporas foams 315
that are made from a highly viscous melt produced by admixing Ca and stirring for as long as 316
15 to 20 min[18]exhibit an equiaxed cell structure. Therefore, the non-equiaxed cell structure 317
here should be rather attributed to the rupture of cell walls during solidification. Even during 318
solidification the phenomenon of solidification expansion (SE) [22] can occur, which leads to 319
cell wall thinning due to stretching and consecutive rupture and coalescence. This is clearly 320
evident from the remnants of broken cell wall observed in the 2D radioscopic images of 321
foams (Fig. 9a-d). Mukherjee et al. have pointed out that partially broken cell walls are a 322
clear indication that rupture took place during solidification[22]. If rupture occurred in the 323
liquid state the liquid metal in a broken film would be redistributed into the surrounding 324
structure and the geometry would be re-adjusted to an equiaxed bubble without leaving any 325
traces of the ruptured cell wall. During solidification, the increase in viscosity (caused by the 326
increasing solid fraction) will not allow the melt to redistribute in the cell wall and attain 327
equilibrium structure. The base alloy composition of the re-melted scrap investigated here is 328
Al–10 wt.% Si and has a larger solid-liquid co-existence region than in the base material of 329
Alporas foams that is almost pure Al. 330
However, non-equiaxed cells are seen more frequently in foams with higher Mg addition(1, 2 331
and 5 wt.%) than in the foam based on an alloy with just 0.13 wt.% Mg where cells are equi-332
axed and fewer broken cell walls are observed. This indicates that the viscosity increase dur-333
ing solidification is not only because of the increasing solid fraction but also due to the for-334
mation of Mg2Si particles. Mg2Si forms at higher concentration of Mg and its volume
21 tion increases with Mg concentration in the alloy (Fig. 3). Mg2Si particles are large and
336
blocky in shape as seen in the interior of a foam cell wall (Fig. 12). 337
338
Fig.12 SEM micrograph of re-melted Al scrap foam containing 2wt.%Mg excess showing 339
Mg2Si phases in the interior of a cell wall and oxide films at the gas solid interface.
340
The compressive stress-strains plot of re-melted aluminium alloy scrap foams of various den-341
sities containing 1 wt.% Mg excess show good strength but wavy strain plateaus, which 342
points at brittleness of the foams. This brittle behaviour is to be expected as the base alloy 343
(LM26) has very limited ductility (<1%) and this will decrease further with the presence of 344
significant levels of oxide films resulting from re-melting the scrap chips. 345
Comparisons can be made with the stress-strain behavior of commercial foams [17] which 346
have been normalized with respect to the initial maximum stress (Fig. 11b). At first inspec-347
tion, the undulating curves resemble that for Cymat foam in which the cell material is also 348
brittle in nature (due to using a brittle Al-Si-SiC matrix alloy). However, unlike the Cymat 349
foam, the stress does not continually rise with progressive strain and in this respect there is 350
similarity to the Alporas foam. The much flatter stress-strain curve for the Alporas foam is 351
22
mation of multiple deformation bands that are uniformly distributed throughout the sample 353
and enables progressive collapse to occur both by the expansion of existing bands and the 354
formation of new ones. In contrast, deformation of the more irregular Cymat foam is highly 355
localized in bands (generally containing large pores or areas of low density), which then pro-356
gress to other regions in the foam only after the cells in the band have reached the point of 357
densification. 358
The initial maximum yield strengths for Alporas foams with densities in the range of 0.2– 359
0.4 g.cm-1 typically vary between 1.4–2.4 MPa [14,16,19]. For Cymat foams, the comparable 360
property is sensitive to the foaming direction and the gravity vector. For a comparable direc-361
tion to that tested in this work, strengths between 1.2–5.0 MPa were observed[16]. The 362
strengths for the scrap and Cymat foams are of course higher than that for the Alporas foam 363
due to the higher inherent strength of the matrix material which is estimated to be 120– 364
170 MPa for Alporas, 310–390 MPa for Cymat[14,17] and 290–310 MPa for the foamable 365
re-melted scrap alloy (calculated as part of this study from hardness measurements of the 366
foamable base material containing 1 wt.% Mg). 367
Predictions for the yield strength using either the approach of Ref.[14] or [16] and typical 368
matrix strength data as given above reveal higher “knockdown” factors (i.e. deviations from 369
the predicted properties) for the Cymat foam than for either the Alporas or scrap-based 370
equivalents. This supports prior hypotheses that relate these larger reductions in the expected 371
strength (and indeed the stiffness) observed in the Cymat foam to the greater anisotropy, het-372
erogeneity and variations in density as well as a higher occurrence and severity of cell wall 373
defects (wiggles, holes, fractures), which result from both the foaming and foam handling 374
processes specific to Cymat foam [14,16]. 375
23 5. Conclusions
377
Mg additions in excess to the level contained in the base scrap alloy (0.13 wt.%) promote 378
fragmentation and good distribution of oxides in the aluminium matrix. Formation of 379
MgAl2O4 (spinel) of octahedral morphology on the surface of the oxides can be observed.
380
Increasing Mg additions to 2 or 5 wt.% does not cause any notable further increase in the 381
formation of MgAl2O4 or MgO compared to 1 wt.% addition and no further fragmentation
382
of oxides or better distribution could be seen. However, an increase of Mg addition causes 383
the formation of Mg2Si during solidification.
384
Foaming re-melted Al scrap alloy without any additional Mg in excess to the 0.13 wt.% in 385
the base alloy led to an equiaxed cell structure, indicating that long oxide filaments can act 386
as stabilizing agent, but only if the holding time was limited to 100 s. Upon longer holding 387
(e.g. 140 s), strong drainage in the foam set in and foam collapse was observed. 388
With 1 wt.% Mg excess, the expansion and the stability of foam upon longer holding 389
(140 s) are good due to fragmentation and good distribution of oxides. The foam with 390
1 wt.% Mg excess showed very good cell structure and a uniform cell size distribution. 391
Increasing Mg additions to 2 or 5 wt.% led to stability even after longer holding but the 392
expansion slowed down. Corresponding foams showed a less equiaxed cell structure caused 393
by cell wall rupture and coalescence that occurred during solidification than foams without 394
or with just 1 wt.% Mg addition. 395
Solidification expansion and the increase in viscosity during solidification of afoam are the 396
reason for non-equiaxed cell structures. In foams that contain 2 or5 wt.% Mg excess, the 397
increase in viscosity during solidification and the formation of non-equiaxed cells are still 398
more pronounced due to the formation of Mg2Si during solidification.
399
During compression tests, foams with 1 wt.% Mg excess (having optimum cell structure) of 400
24
behaviour of a low-ductility Al-Si casting alloy containing significant levels of oxides. 402
However, their uniform pore structure leads them to have flatter compression stress plat-403
eaus, higher energy absorption efficiencies and a reduced “knockdown” in properties, 404
which is comparable with that of Alporas foams made in the same way. Therefore, foams 405
made from re-melted alloy scrap could offer the same performance as Alporas foams but at 406
a lower cost. 407
Acknowledgements 408
The corresponding author thanks German DFG, Grants GA 1304/2-1 and BA 1170/17-1 and 409
Indian Naval Research Board, Grants NRB-317/MAT/13-14 for the support of this study 410
411
References 412
1. J. Banhart, Prog. Mater. Sci., 2001. vol. 46, pp. 559-632. 413
2. L. Drenchev, J. Sobczak, S. Malinov, W. Sha, Mater.Sci. Technol., 2006, vol. 22, pp. 414
1135-47. 415
3. S. W. Ip, S.Y.Wang, J. M. Toguri, Can. Metall. Q, 1999, vol. 38, pp. 81-92. 416
4. J. Banhart, J.Met., 2000, vol.52,pp. 22-27. 417
5. N. Babcsán, D. Leitlmeier, H.P. Degischer, Materialwiss.Werkstofftech., 2003, vol.34, 418
pp. 22-29. 419
6. N. Babcsán, F.Garcia-Moreno, J. Banhart, Colloids Surf., A, 2007,vol.309, pp. 254-63. 420
7. G. S. Vinod Kumar, M. Chakraborty, F. Garcia-Moreno, J. Banhart, Metall. Mater. 421
Trans. A, 2011, vol.42, pp. 2898-908. 422
8. J. Banhart, Adv. Eng. Mater., 2006,vol.8, pp.781-94. 423
9. W. Ha, S. K. Kim, H.H Jo, Y.J Kim, Mater.Sci.Technol., 2005, vol.21, pp. 495-99. 424
10.M. Haesche, D. Lehmhus, J. Weise, M. Wichmann, I. C. M.Mocellin, J. Mater.Sci. 425
25 11.G. S. Vinod Kumar, K. Heim, F. Garcia-Moreno, J. Banhart, A. R. Kennedy, Adv. 427
Eng. Mater., 2013, vol.15, pp.129-33. 428
12.G. S. Vinod Kumar, K. Heim, F. Garcia-Moreno, J. Banhart, A. R. Kennedy,.Int. J. 429
Mater. Res., 2015, vol.106, pp. 978-87. 430
13.M. Mukherjee, U. Ramamurty, F. Garcia-Moreno, J. Banhart, Acta Mater., 2010, 431
vol.58, pp. 5031-42. 432
14.E. Andrews, W. Sanders, L.J. Gibson, Mater. Sci. Eng. A, 1999, vol.270, pp. 113-24. 433
15.V. Gergely and B. Clyne, Adv. Eng. Mater., 2000, vol.2, pp.175-78. 434
16.O.Olurin, N. Fleck, M. Ashby, Mater. Sci. Eng. A, 2000, vol.291, pp.136-46. 435
17.A. E. Simoneand L.J. Gibson, Acta Mater., 1998. vol.46, pp.3109-23. 436
18.T. Miyoshi, M. Itoh, S. Akiyama, A. Kitahara, Adv. Eng. Mater., 2000, vol.2, pp. 437
179-83. 438
19.U. Ramamurty, A. Paul, Acta Mater., 2004, vol.52, pp.869-76. 439
20.B.C. Pai, G. Ramani, R. M. Pillai, K. G. Satyanarayana, J.Mater.Sci., 1995, vol.30, pp. 440
1903-11. 441
21.S.Y. Kim, Y.S. Um, B.Y. Hur,Mater. Sci. Forum, 2006, vol. 510-511, pp. 902-5, 2006 442
22.M. Mukherjee,F.Garcia-Moreno, J. Banhart, Scripta Mater., 2010, vol.63, pp. 235-38. 443
444
445
446
447
448
449
26
Table Caption
[image:26.595.34.479.106.445.2]451
Table 1. Chemical composition of swarf chips measured by OES 452
Element Si Cu Fe Mn Mg Zn Al
wt.% 10.50 1.60 1.20 0.29 0.13 1.10 balance
453
Table 2. Mechanical properties for scrap foams 454
Foams Mg added in excess to 0.13 wt.% (wt.%)
Holding time (s)
density (g.cm-1)
yield strength (MPa)
Eabs(MJ.m-3)
foam 1 1 100s 0.34 5.63 2.36
0.37 6.49 2.64
foam 2 1 140s 0.19 1.16 0.64
0.24 2.10 1.07
0.28 3.58 1.47
455