warwick.ac.uk/lib-publications
Manuscript version: Published Version
The version presented in WRAP is the published version (Version of Record).
Persistent WRAP URL:
http://wrap.warwick.ac.uk/115247
How to cite:
The repository item page linked to above, will contain details on accessing citation guidance
from the publisher.
Copyright and reuse:
The Warwick Research Archive Portal (WRAP) makes this work of researchers of the
University of Warwick available open access under the following conditions.
This article is made available under the Creative Commons Attribution 4.0 International
license (CC BY 4.0) and may be reused according to the conditions of the license. For more
details see:
http://creativecommons.org/licenses/by/4.0/.
Publisher’s statement:
Please refer to the repository item page, publisher’s statement section, for further
information.
O R I G I N A L A R T I C L E
Effect of section geometry on development of
shrinkage-induced deformations in box girder bridges
Haidong Huang.Reyes Garcia .Maurizio Guadagnini.Kypros Pilakoutas
Received: 27 June 2017 / Accepted: 1 September 2017 / Published online: 9 September 2017 ÓThe Author(s) 2017. This article is an open access publication
Abstract Non-uniform shrinkage strains can lead to significant additional deflections in large box girder bridges, leading to serviceability problems. This article examines experimentally and analytically the effect of different cross-section geometries on the shrinkage camber of bridge box girders. Small-scale beams were tested to determine the development of shrinkage strains across the beams of depth. Param-eters investigated include cross section thickness, drying conditions, and type of concrete mix. Based on the experimental results, inverse analysis is utilised to obtain a surface factor and a hydro-shrinkage coeffi-cient. In this study, such vales are used to determine, for the first time, shrinkage-induced bending defor-mations of long-span bridges using a hydro-mechan-ical approach. The results are then used to examine numerically the effect of different section geometries on the development of shrinkage camber. It is shown that the analytical predictions match the experimental results with an accuracy of 85%. A further parametric study is carried out to investigate the effects of
specimen geometry and ambient relative humidity. The hydro-mechanical approach is further validated using shrinkage field data from the 230 m two-span box girder Yiju River Bridge (China). The approach proposed in this study is expected to contribute towards improving the predictions of the long term behaviour of box girder bridges and towards better bridge management.
Keywords ShrinkageSize effects Hydro-mechanical couplingBox girder bridges DeflectionsCamber
1 Introduction
Box girders are widely used in the design and construction of prestressed concrete (PC) bridges due to their structural efficiency and cost-effective-ness. However, in recent years numerous of such bridges experienced excessive vertical deflections at mid-span, affecting significantly serviceability and aesthetics [1]. Previous research has attributed these large deflections to additional curvatures produced by non-uniform shrinkage strain across the depth of concrete girders [2,3]. Changes in the sectional shape and size are also expected to contribute to the development of shrinkage camber as the drying rate is not uniform over the cross section. To date, H. Huang
Department of Bridge Engineering, Chongqing Jiao Tong University, 66 Xuefu Street, Nan’an District,
Chongqing 400074, China
R. Garcia (&)M. GuadagniniK. Pilakoutas Department of Civil and Structural Engineering, The University of Sheffield, Sir Frederick Mappin Building, Mappin Street, Sheffield S1 3JD, UK
however, the shrinkage camber caused by sectional shape has not been examined experimentally.
The process of drying shrinkage is caused by diffusion of moisture from the inside to the outer surface of concrete when this is exposed to a drying environment. The most effective way to mitigate the effect of shrinkage deformations is to prevent the loss of moisture and to protect the concrete from rapid drying [4]. However, the complete elimination of internal deformations is practically impossible. As a result, it is important to develop practical ways to account for shrinkage strains during construction as well as for structural assessment required for bridge management.
Current design guidelines include approximate analytical models to predict the long-term shrinkage behavior of concrete (e.g. ACI 209 [5] and Model Code 2010 (MC 2010) [6]). These models account for factors such as type of concrete, ambient relative humidity (RH), as well as cross section size and shape. In these models, the theoretical cross section thickness is defined by an average drying path length represent-ing the entire cross section [3], which reflects the expectation that uniform drying shrinkage produces only axial shortening deformation but no deflection. While the above models are widely used in bridge design/analysis, they were proved unsuitable for cal-culating deflections of long span bridges with box girders [7,8].
Different studies have investigated non-uniform shrinkage effects in box girder sections. Using the KB bridge (in Palau) as case study, Krˇı´stek [8] estimated the different shrinkage and creep effects of box girder bridges by assigning different shrinkage properties to each part of a whole box section, using different thicknesses for the web, top and bottom slabs. Krˇı´stek concluded that this approach can produce more accurate predictions than using the whole box section for calculating long-term deflections and stress redis-tributions. A more accurate 3D solid model of the KB bridge identified that the non-uniform distribution of drying shrinkage within the box girder section (due to the variation in thickness among different parts of the section) was one of the causes for excessive vertical deflections [2]. Malm and Sundquist [9] examined the shrinkage behaviour of the hollow box-girder Gro¨ndal bridge (Sweden) using finite element (FE) analysis. The results showed that, after 2 years of service, non-uniform drying shrinkage accounted for 18% of the
total bridge deflection. However, the above studies ignored the fact that shrinkage and creep depend on the section thickness, which varies across the cross section and along the bridge. Therefore, to accurately simulate the behaviour of an entire bridge, a large number of different geometries and shrinkage and creep models are needed, which makes the analysis computationally demanding and time-consuming.
To address the above drawbacks, more precise (yet complex) moisture diffusion analyses have been used to evaluate differential drying shrinkage deformations. For instance, numerical methods based on finite differences have been adopted to analyse the effect of internal RH changes over the cross section depth, along with a shrinkage coefficient that relates the internal RH and shrinkage deformations [10–13]. Multi-field models that consider thermal-diffusion coupling effects were also used to assess the thermal-shrinkage stress of large concrete structures [14–17]. Theoretically, the above mentioned approach based on hydro-mechanical analysis can be used to predict the time dependent deformations of box girders with complex cross sections. However, the input parame-ters in the diffusion model (e.g. diffusion coefficient, surface factor and hydro-shrinkage coefficient) affect the accuracy of the predictions. The moisture diffusion coefficient depends on the internal RH of concrete and reflects the moisture transfer during drying. Existing guidelines (e.g. Model Code 90 [18] and MC2010 [6]) suggest analytical expressions to compute the mois-ture diffusion coefficient. The surface factor (also called transport coefficient or convection coefficient) represents the velocity of internal moisture that evaporates through the concrete surface to the envi-ronment. The surface factor depends on the w/c ratio and the moisture gradient and, consequently, its value should be determined on a case by case basis. Previous research also found that surface factor values had a large scatter [19,20]. The hydro-shrinkage coefficient (also called contraction coefficient and shrinkage coefficient) is the coupling condition between free shrinkage strain and varying moisture. Typical values of hydro-shrinkage coefficient range from 1.2 to 3.0 mm/m [21, 22]. The surface factor and the hydro-shrinkage coefficient can be calibrated using a combination of tests results and parametric studies.
bridges. Section2of this study discusses methods for calculating shrinkage camber. Subsequently, Sect.3
presents and discusses results of an experimental programme aimed to obtain surface factors and hydro-shrinkage coefficients from beam specimens. Sec-tion4 proposes to use, for the first time, a hydro-mechanical coupling model to simulate the shrinkage-induced bending deformation of the tested beams. The model is further validated by predicting the deflections of an actual case study bridge (Sect. 5). Concluding remarks of this study are given in Sect.6. This article aims to contribute towards the development of more accurate models to assess the overall deflection of box girder bridges so as to improve the performance, serviceability and economic viability of structures.
2 Calculation of shrinkage camber and moisture diffusion
2.1 Shrinkage camber
Non-uniform shrinkage over the beam depth can produce both shortening deformation and bending deformations along the beam. By assuming that every small element in the cross section can deform freely, the free shrinkage straineshat an element located at (x, y) from the onset of shrinkage strain can be calculated as follows:
eshðx;yÞ ¼bð1DHðx;yÞÞ ð1Þ
wherebis the hydro-shrinkage coefficient; andDHis the change of pore humidity at (x,y).
If a plane strain distribution along the beam depth is assumed, the shrinkage curvaturewshcan be obtained:
wshðts;tÞ ¼ 1 I
Zt
ts ZZ
A
DeshðyycÞdAdt ð2Þ
wherets andt are the time at the onset of shrinkage strain and the analysis time, respectively;yycis the distance from the element to the neutral axis of the whole section;Iis the moment of inertia of the whole section; andAis the area of the whole section.
Likewise, the longitudinal average straineshis:
eshðts;tÞ ¼ 1 A
Zt
ts ZZ
A
DeshdAdt ð3Þ
where all the variables are as defined before. It should be noted that the internal reinforcement restrains the development of shrinkage-induced deformations, and that this can lead to stress and strain redistributions over the cross section’s height. However, in current design practice, the restrain of reinforcement is usually neglected in typical prestressed bridges with relative low reinforcement ratios. As a result, such restraining effect are neglected in subsequent analysis of the case study bridge presented later in this article.
2.2 Moisture diffusion over cross section
The time-dependent shrinkage of concrete consists of four main sources, including drying, autogenous, plastic and carbonation shrinkage. Water in concrete is consumed during hydration, and therefore the internal moisture decreases and affects the humidity diffusion process. As a result, autogenous shrinkage is significant in high-strength concrete during the early ages. According to Fick’s second law, the diffusion equation with the effect of self-desiccation [23] can be expressed as:
oH
ot ¼ r½DðHÞrH þ
oHa
ot Hðx;yÞ ¼H0ðx;yÞ
DðHÞ oH on
jS¼fðHenHsÞ
8 > > > > < > > > > :
ð4Þ
where His the pore humidity;D(H) is the moisture diffusion coefficient;oHa
ot is the change rate of internal
humidity due to self-desiccation;H0ðx;yÞis the initial condition function which denotes the initial internal humidity distribution at an element located at (x,y);f is the surface factor;Henis the environmental humid-ity; andHsis the relative humidity on the exposed face S.
Equation (4) can be solved using finite difference methods that solve time-dependent nonlinear diffusion problems [24]. Accordingly, the FE governing equa-tion in nonlinear diffusion analysis is [25]:
D
½ f g þH ½ C H_ ¼f gR ð5Þ
where ½ D is the element humidity diffusion matrix; C
Raphson iteration methods, the nonlinear transient equation can be rewritten as:
i1
tþDt½D i
DH
f g þ½ Ci tþDt H_
¼tþDtfRg tiþ1Dt½ D i1
tþDt½ H ð6Þ
whereDtis the time step;iis the iteration number; and
DH
f gis the element humidity variation matrix fromt to Dt. According to the Euler backward difference method,i
tþDt H_ can be expressed as:
i
tþDt H_ ¼ i1
tþDtf g þH ifDHg tf gH
Dt ð7Þ
The hydro-shrinkage coefficient blinks the mois-ture diffusion model and the structural shrinkage model described in Sect.2.1. The time-dependent internal humidity distribution can be determined using Eqs. (5)–(7), whereas the shrinkage strain and curva-ture can be calculated using Eqs. (1)–(3). In this study, ADINAÒ[26] software is used to simulate the drying process in concrete. The decrease of internal humidity due to self-desiccation is modelled by the time-dependent uniform drying process, as shown later in Sect.4.1.
In summary, to determine the development of shrinkage-induced deformations using the hydro-me-chanical approach described in the previous sections, the following main assumptions and calculation steps are necessary:
1. Calibrate the surface factor f and the hydro-shrinkage coefficientbusing inverse analyses; 2. Calculate the time-dependent internal humidity
distribution assuming that only drying and self-desiccation occur; and
3. Assume a plane strain distribution along the beam depth and determine both shortening deformation and bending deformations along the beam using section analysis.
3 Experimental programme
3.1 Test specimens and exposure conditions
Four non-symmetric I cross section beams (group I) were produced and tested to examine the camber due to non-uniform shrinkage. The beams were cast sideways to eliminate differences in concrete
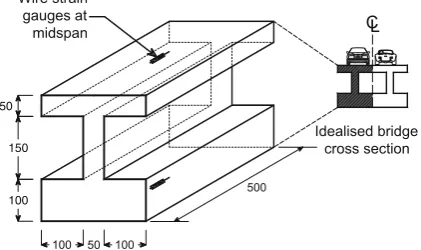
properties along the height of the beam. The simplified scaled-down geometry of the short I beams replicated approximately half of a box girder section, as shown in Fig.1. The beams had a total depth of 300 mm, a total length of 500 mm and a web thickness of 50 mm, as shown in Fig. 1. The thicknesses of the top and bottom slabs (flanges) were 50 and 100 mm, respectively. For comparison, four control concrete prisms (specimens B and BS) of 10091009450 mm were also cast. No reinforcement was used in the beams and prisms.
The I beam specimens were subjected to different exposure conditions to promote concrete drying shrinkage. To amplify the effect of differential shrinkage, the surfaces of the web and bottom slab of two specimens (IP-1 and IP-2) were epoxy coated to prevent drying, whereas two beam counterparts (I-1 and I-2) were fully exposed to the environment. Two prisms (BS) were fully epoxy coated on all surfaces, whereas two prisms (B) had only one surface exposed to the environment. Table1 summarises the main characteristics of the tested specimens and their corresponding the mean concrete compressive strengthfc.
3.2 Material properties
The I beams and prisms were cast using two batches of normal-strength concrete (mixes C1 and C2) typical of bridge construction in China. To investigate the effect of water-cement (w/c) ratio on drying and autogenous shrinkage, w/c ratios of 0.37 and 0.40 were selected for mixes C1 and C2, respectively. The following pro-portions were used for mix C1: cement=460 kg/m3, gravel =1270 kg/m3, sand=520 kg/m3, whereas for mix C2: cement=410 kg/m3, gravel=
1275 kg/m3, sand=545 kg/m3. For each batch, fc
Idealised bridge cross section
100
500
50
C Wire strain
gauges at midspan
100
L
50
150
100
[image:5.547.288.499.520.645.2]was obtained from concrete cubes tested at 28 days according to the Chinese JTG D60 bridge design code [27].
All specimens were moist-cured for 3 days follow-ing castfollow-ing, after which the epoxy coatfollow-ing was applied onto the faces of the selected specimens. During testing, all specimens were kept in standard laboratory conditions. It should be noted that the tested beams have the same exposure conditions on the inner and outer faces of the simulated cross section. This is because, in actual bridge construction practice, the inner parts of the box sections are also exposed to the environment during the construction period of the cantilever segments (which can last for several months or years).
The I beams were rotated 90°and simply supported on two steel rods to ensure that only free deformations occurred during the test. To measure the development of strain during drying, two vibrating wire strain gauges were installed along the centerline of the beams: one at the top slab and one beneath the bottom slab, as shown in Fig.1. The strain gauges had a measurement range of±1500leand an accuracy of 1 le. The prisms were also supported on two steel rods and monitored by vibrating wire strain gauges. Measurements were read every day during the first week of testing. The beams and prims were monitored for a period of 115 days.
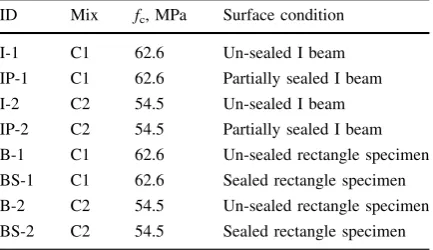
Figure2a–b show the evolution of shrinkage strains measured at the top (Top test data points) and bottom (Bot test data points) of the un-sealed specimens I-1 and I-2. As expected, the shrinkage strains were different at these locations, thus confirming that both axial shortening and shrinkage bending occurred during the tests. The difference between the measured data from top and bottom strain gauges (Top-Bot test)
indicates the magnitude of the camber deformation, which results in additional bending deformations. The results indicate that during the first 58 days, the shrinkage strain on the top developed faster than that on the bottom, while the bending deformation increased. However, after 58 days, the camber decreased after reaching a peak value. These results were expected since, at the initial stages of the test, the development of drying shrinkage at the (thinner) top slab was faster than at the bottom slab. Consequently, an increasing upward camber deformation occurred over time but only up to a peak point. After this, drying shrinkage at the top slab developed more slowly than at the bottom slab because the majority of internal moisture in the former has been consumed by convection. The Top-Bot curve decreased with time, thus leading to a downward camber deformation.
Figure2c–d also show the evolution of shrinkage strains at the top and bottom of the sealed specimens IP-1 and IP-2, respectively. As expected, the differ-ence between shrinkage strains on the top and bottom slabs is up to 55% higher than those of the corre-sponding un-sealed specimens (shown in Fig. 2a–b). However, shrinkage strains were still measured on the sealed surface of the specimens. This can be attributed to autogenous shrinkage but also to restraining effects of the sealed flange.
4 Numerical analysis
[image:6.547.47.264.73.198.2]Based on the experimental results from Sect.3, this section presents an inverse analysis performed to obtain the surface factor and the hydro-shrinkage coefficient. A parametric analysis is then carried out to examine the influence of specimen geometry and ambient RH on the shrinkage behaviour of the tested beams. It should be mentioned that solar radiation can significantly affect the long term drying process in actual concrete bridges. However, to simulate actual environmental conditions of a bridge, a more complex hydro-thermo-mechanical model would be needed to couple the effect of moisture, temperature and defor-mation fields, thus resulting in very demanding computational analyses. As a result, current guidelines use ‘‘average’’ RH and environmental temperature, which are also adopted in the calculations of this study.
Table 1 Main characteristics of tested specimens
ID Mix fc, MPa Surface condition
I-1 C1 62.6 Un-sealed I beam
IP-1 C1 62.6 Partially sealed I beam
I-2 C2 54.5 Un-sealed I beam
IP-2 C2 54.5 Partially sealed I beam
B-1 C1 62.6 Un-sealed rectangle specimen
BS-1 C1 62.6 Sealed rectangle specimen
B-2 C2 54.5 Un-sealed rectangle specimen
4.1 Basic parameters for modelling
To determine suitable parameters for a hydro-me-chanical model, a moisture diffusion analysis is first performed. This study adopts the approach suggested by the recent MC2010 [6], where the moisture diffusion coefficientD(H) is calculated as:
DðHÞ ¼D1 aþ
1a
1þ 1H
1Hc
n
0 B @
1 C
A ð8Þ
where H is the relative pore humidity; D1 is the maximum ofD(H) forH=1.0 (D1=1 910-8[m2/ s]/fck,fck=characteristic concrete strength); andHcis the relative pore humidity atD(H)=0.5D1. Accord-ing to MC2010, approximate values a =0.05, Hc=0.80 andn=15 can be used in the analysis.
A surface factorfand a hydro-shrinkage coefficient are required for the moisture diffusion analysis.
Previous literature indicates that the surface factor fdepends on the water-cement ratio and the moisture gradient, and a wide range of values were suggested [19, 28]. Likewise, the hydro-shrinkage coefficient was found to range between 1.1 910-3 and 3.0910-3[21,22].
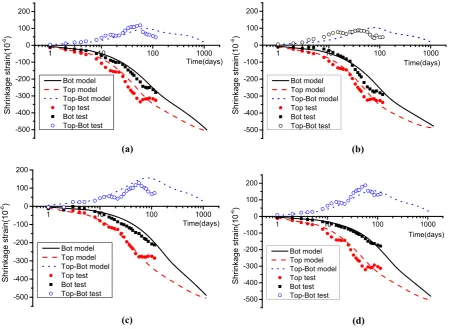
In addition, free shrinkage strain is difficult to measure directly due to internal restraining effects. The FEA package ADINAÒ[26] was used to perform inverse analyses and estimate the surface factor and the hydro-shrinkage coefficient [19]. The results indicate that the best match is obtained for f values of 0.3 and 0.5 mm/day for mixes C1 and C2, respectively (see Fig.3). Likewise, the use of a hydro-shrinkage coefficient values of 0.0014–0.0015 led to good predictions for both concrete mixes. Consequently, these values are used in subsequent analyses.
At an early age, the internal moisture in concrete is consumed due to self-desiccation, thus leading to -500
-400 -300 -200 -100 0 100 200
Time(days)
Shrinkage strain(10
-6 )
Bot model Top model Top-Bot model Top test Bot test Top-Bot test
-500 -400 -300 -200 -100 0 100 200
Time(days)
Shrinkage strain(10
-6 )
Bot model Top model Top-Bot model Top test Bot test Top-Bot test
(a) (b)
-500 -400 -300 -200 -100 0 100 200
Time(days)
Shrinkage strain(10
-6 )
Bot model Top model Top-Bot model Top test Bot test Top-Bot test
1 10 100 1000 1 10 100 1000
1 10 100 1000
1 10 100 1000
-500 -400 -300 -200 -100 0 100 200
Time(days)
Shrinkage strain(10
-6 )
Bot model Top model Top-Bot model Top test Bot test Top-Bot test
(c) (d)
[image:7.547.50.500.57.386.2]autogenous shrinkage. Since the experiments were conducted in a relatively short time, the effect of concrete self-desiccation needs to be accounted for in the analysis. As water is consumed by hydration, the internal RH decreases and interacts with the humidity diffusion process. The autogenous shrinkage depends on the water to binder ratio and on temperature. Whilst some predictive models have been previously pro-posed to compute autogenous shrinkage [23,29], this study adopts the approach proposed in MC2010. Accordingly, the basic shrinkageecbsis calculated as:
ecbs¼ecbs0bbsðtÞ ð9Þ
where ecbs0 is the basic notional coefficient (which depends on the cement type and concrete compressive strength); andbbsðtÞis a time development function for basic shrinkage strain. The time development function for autogenous strainbbs(t) can be computed as follows:
bbsðtÞ ¼1e
0:2pffiffit ð10Þ
By differentiating Eq. (10) with respect tot, Eq. (9) can be rewritten as:
_ ecbsðtÞ ¼
0:1ecbs0e0:2 ffiffi
t
p
ffiffi t
p ð11Þ
Thus the change of internal humidity due to self-desiccation can be calculated as:
oHa
ot ¼
0:1ecbs0e0:2 ffiffi
t
p
bpffiffit ð12Þ
where all the variables are as defined above.
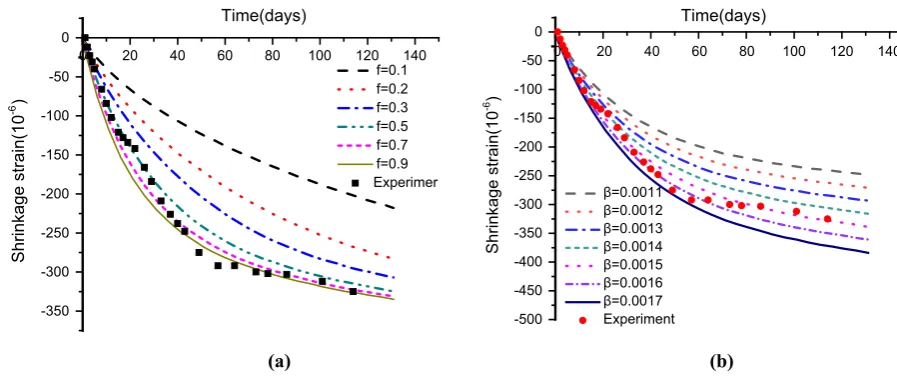
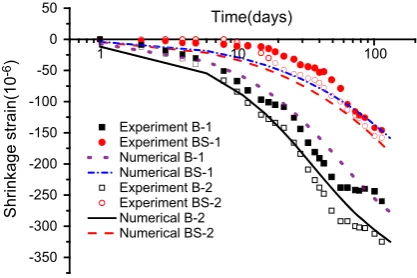
To validate the autogenous shrinkage model, FE analyses were carried out to predict the behavior of prisms with sealed and unsealed surfaces. The surface factorf was set to ‘0’ in the analysis to simulate the effect of sealed surfaces, thus assuming that no moisture evaporated from the surface of the specimens and that only autogenous shrinkage occurred. Con-versely, on the unsealed surfaces, fwas set to 0.3 and 0.5 mm/day for mixes C1 and C2, respectively. Figure4shows that the FE models predict the results of the tested prisms with good accuracy, in particular for the sealed specimens. The differences between the numerical predictions and the experimental results can be attributed to (a) the use of ‘average’ environmental conditions and temperature in the FE modelling, and (b) the intrinsic inhomogeneity of concrete structure, which led to different conditions along the prisms.
4.2 FE modelling of hydro-mechanical behaviour
As discussed in Sect.2, the calculation of shrinkage deformations requires: (1) analysing the time-depen-dent moisture distribution over the cross section of the element, and (2) determining the shrinkage camber and resultant deformation through section analysis. In this study, the hydro-mechanical behaviour of the I
0 20 40 60 80 100 120 140 0 20 40 60 80 100 120 140
-350 -300 -250 -200 -150 -100 -50 0
0
Shrinkage strain(10
-6 )
Time(days) Time(days)
f=0.1 f=0.2 f=0.3 f=0.5 f=0.7 f=0.9
-500 -450 -400 -350 -300 -250 -200 -150 -100 -50 0
0
Shrinkage strain(10
-6 )
β=0.0011 β=0.0012 β=0.0013 β=0.0014 β=0.0015 β=0.0016 β=0.0017 Experiment Experimer
(a) (b)
[image:8.547.46.495.56.245.2]beams was simulated using the diffusion model developed in Sects. 2and4, and a mechanical model (fibre-based section analysis [30]). These two models are linked by the hydro-shrinkage coefficient b (see Eqs.1,4and12). 2D diffusion elements were adopted to calculate the internal distribution of RH, whereas fibre elements were used to calculate time-dependent deformations. Both diffusion and mechanical models were discretised using quadrilateral elements with the same mesh size. The analyses to calculate the internal distribution of RH were performed using the general FEA package ADINAÒ[26], while the section anal-yses were carried out using routines programmed in MatlabÒsoftware [31]. Based on the RH measured in the laboratory, a constant ambient RH=70% was used for the exposed surface in the diffusion model. The time-dependent internal RH due to self-desicca-tion was also considered in the FE modelling.
4.3 Numerical results and discussion
Figure2a–d compare the FE predictions with the experimental results of the I beams. The figures indi-cate that the FE predictions are in close agreement with the experimental results. The differences between the predictions and the test data can be attributed to the variation of environmental conditions (RH) and tem-perature during the tests, which cannot be captured by the FE models. This is confirmed by the smaller difference obtained between predictions and test results for the unsealed surface conditions (see Fig.2b) when compared to partially sealed surface conditions (Fig.2c). These results confirm that it is possible to develop appropriate numerical models to
predict the shrinkage behaviour of the I beams with an acceptable accuracy. The results also indicate that the calibrated models can be used to perform further parametric analyses on the I beams. As expected, as the RH stabilises through the section, the difference in shrinkage between Top and Bottom slabs reduces, consequently reducing the shrinkage camber.
The experimental and FE results presented in Fig.2a–d confirm that the cross section shape can lead to shrinkage camber and that it influences the development of shrinkage-induced deformations at different depths of the specimen. The results also indicate that the numerical approach adopted in this study can predict the shrinkage camber and shrinkage strain of the tested specimens with good accuracy. However, due to the limited number of specimens tested in this study, the influence of different cross section geometry and ambient RH on shrinkage camber was not examined. These effects are examined in the following section, which presents the results of a parametric study that was carried out to analyse the shrinkage camber of I beams with different cross sections and ambient RH.
4.4 Parametric analysis using FE models
4.4.1 Influence of section depth
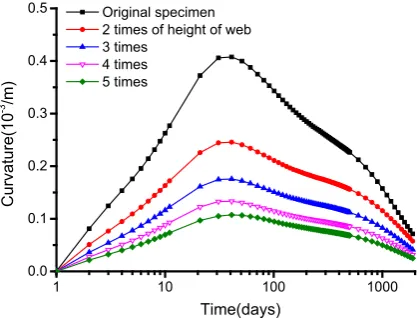
To determine how the section depth influences shrinkage camber (expressed as curvature), the height of the web was scaled up 2–5 times. This led to web depths of 150, 300, 450, 600 and 750 mm. The rest of the section dimensions were kept the same. The results in Fig.5 show that the maximum value of shrinkage camber decreases as the height of the web increases. However, as the web thickness was the same, all peak values of camber are observed at around 30–40 days.
4.4.2 Influence of size
Figure6 compares results of shrinkage camber for different section sizes. In this case, the original section was scaled up geometrically by factors of 2–5 times, thus leading to sections of (flange width9total depth) 250 9300, 500 9600, 750 9900, 100091200 and 125091500 mm. The results indicate that size affects both the maximum value of shrinkage camber and the time at which it is achieved. For example, the change in scale factor from 1 to 5
1 10 100
-350 -300 -250 -200 -150 -100 -50 0 50
1 100
Shrinkage strain(10
-6)
Time(days)
Experiment B-1 Experiment BS-1 Numerical B-1 Numerical BS-1 Experiment B-2 Experiment BS-2 Numerical B-2 Numerical BS-2
[image:9.547.51.260.59.198.2]reduced the maximum camber from 0.40 to 0.05/mm, while the time difference between peak camber was approximately 950 days.
4.4.3 Influence of ambient humidity
Figure7compares the response of the original model subjected to environmental RH varying from 40 to 80%. The results indicate that, as the RH increases, the maximum value of the shrinkage camber decreases from 0.95/mm (RH=40%) to 0.32/mm (RH=80%). It is also shown that the higher the RH, the earlier the camber reduces and tends to zero. Such trend is attributed to the internal moisture balancing with the external ambient RH.
5 Case study validation
5.1 Description of the bridge
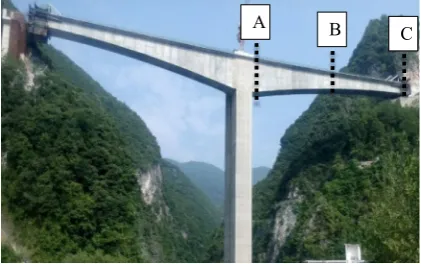
The Yiju River Bridge at Chongqing, China (see Fig.8) is selected as a case study to validate the hydro-mechanical FE approach proposed in this study. The two-span prestressed concrete box girder bridge was segmentally constructed over the Yiju River in 2016. The left and right spans of the bridge are 115 m long each, whereas the height of the main hollow box-section pier is 85.8 m. The 0.8 m thick main pier has transversal and longitudinal dimensions of 8.0 m and 9.0 m, respectively. The 23 91794.5 m solid pile cap is supported by 12 concrete piles of 3 m diameter. The cross section consists of a single box girder with an 11.0 m wide cantilever slab. The total girder depth reduces from 14.98 m at the main pier (at section ‘‘A’’ in Fig. 8) to 4.5 m at the closure segment (at section ‘‘C’’ in Fig. 8). Likewise, the thickness of the bottom slab and web vary along the bridge. Three diaphragms are located within the box girder at all supports. The superstructure was built using a cast-in-place cantilevered system using 52 segments of different length (2, 3, 4, 4.8 and 5 m). These segments were presstressed using two sets of tendons: 18 tendons of 15.2 mm diameter (in the top slab) and 23 tendons of 15.2 mm diameter (in the bottom slab), with initial forces of 3375 and 4312 kN, respectively. The total construction time of the superstructure was 330 days.
1 10 100 1000
0.0 0.1 0.2 0.3 0.4 0.5
Curvature(10
-3 /m)
Time(days) Original specimen 2 times of height of web 3 times
4 times 5 times
Fig. 5 Shrinkage camber with different web depth
1 10 100 1000
0.0 0.1 0.2 0.3 0.4 0.5
Curvature(10
-3 /m)
Time(days)
Original specimen 2 times zooming 3 times zooming 4 times zooming 5 times zooming
Fig. 6 Shrinkage camber with different section size
1 10 100 1000
0.0 0.1 0.2 0.3 0.4 0.5 0.6 0.7 0.8 0.9 1.0
Curvature(10
-3 /m)
Time(days) 40%
50% 60% 70% 80%
[image:10.547.51.260.59.218.2] [image:10.547.51.259.254.411.2] [image:10.547.287.500.473.635.2]The RH inside the top slab of the box girder section was measured using a digital sensor with RH and temperature accuracies of±2% and±0.3°C, respec-tively. Three digital RH sensors were installed on the top slab of the mid-span section ‘‘B’’ at depths of 0, 30 and 100 mm from the top slab surface. The sensors were fixed to steel rebars, which in turn were welded to the girder’s reinforcing cage. PVC tubes of 30 mm diameter protected the sensors during concrete cast-ing. The data was collected using DC powered equipment.
5.2 FE validation and results
A total of 26 sectional models were used to simulate the 52 cantilever segments of the bridge in ADINAÒ software. Due to symmetry, only half of the bridge’s cross section was modelled to reduce computational time. In the diffusion analysis, an average measured environment humidityHe=0.70 was applied on the box girder surfaces as the convection boundary. The elastic modulus (E=3.459104MPa) was obtained from tests on cubes, whereas the surface factor (f=0.0005 m/day) and the hydro-shrinkage coeffi-cient (b =1.58910-3) were determined from a parametric analysis based on MC2010 and measured data.
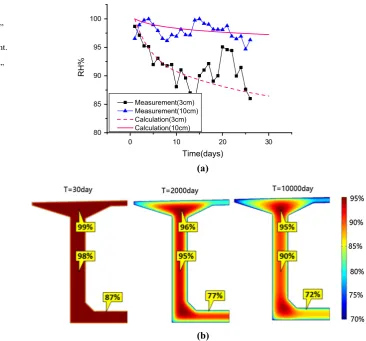
The digital sensor on the box girder surface recorded ambient RH ranging from 51 to 100%, while the ambient temperature varied from 20 to 40°C during the measuring period (27 days). The short measuring period was due to the practical and financial constraints of the project. Figure9a shows that the internal RH at depths of 30 and 100 mm decrease over
time due to self-desiccation and drying of concrete. The measured internal RH at 30 mm depth decreases from 100 to 87% after 27 days. As expected, the RH at 30 mm is lower than that at 100 mm depth. The field data also show that the internal RH is significantly affected by the variation of ambient RH and temper-ature, as shown by the large scatter of data at 30 mm depth. Figure9a also shows that the sectional diffu-sion analysis over the cross section of the bridge captures well the trend of the internal RH at both depths. Since the FE models use an average ambient RH, the calculated time-dependent RH curves are much smoother than the measured data.
Figure9b compares the calculated distribution of the internal RH at ages of 30, 2000 and 10,000 days (approximately 0, 5 and 27 years, respectively). It is shown that, within the first 30 days, the drying depth from the exposed surface is 50–100 mm and the internal RH at the center of the slab and web varies less than 1%. However, after 2000 days, the drying depth increases and some parts of the box section (e.g. thin top slabs) dry at a faster rate than the web. The internal RH of the thicker sections of the top and bottom slabs remains relatively high (up to 95%) even after 10,000 days, thus leading to a low shrinkage strain.
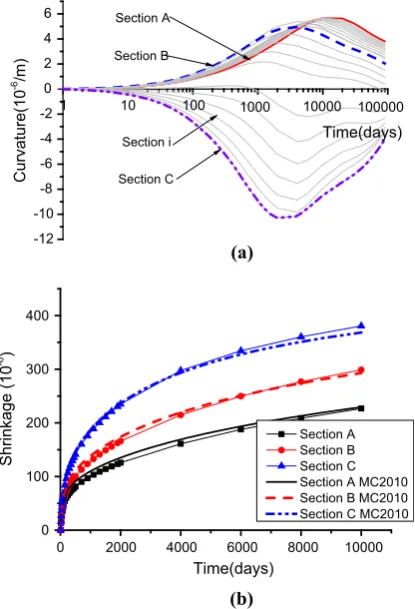
To study the long term shrinkage camber and shrinkage strain, the Yiju River bridge was divided into 26 sections in ADINAÒ. The sections had the same drying boundary conditions used in the previous analysis. The restrain of the bridge supports was considered by assigning suitable structural boundaries in the analysis of time-dependent deflection. As this study examines long periods of time, an average RH of 70% and an average temperature of 20°C were adopted in the FE models, which are deemed repre-sentative of future conditions at the Yiju River bridge. Dead load was neglected in the analysis. Figure 10a compares the development of shrinkage camber over time at sections ‘‘A’’, ‘‘B’’ and ‘‘C’’, which are representative of the bridge’s sections at the pier, midspan and closure segments. The results confirm that shrinkage camber occurs at all sections due to differential drying across the box section, and that the magnitude of shrinkage camber depends on the size of the section. For example, the bottom slab thickness of section ‘‘A’’ is 1.92 m, or 2.5 times the slab thickness of section ‘‘B’’, and the maximum shrinkage camber at ‘‘A’’ is 6910-6/m, i.e. 1.5 times the value at ‘‘B’’ (4 910-6/m). Figure10a also shows that the A B C
[image:11.547.49.260.60.192.2]evolution of shrinkage camber at ‘‘A’’ lags behind that at ‘‘B’’. Unlike sections ‘‘A’’ and ‘‘B’’, a negative shrinkage camber is observed at ‘‘C’’ as at this section the top slab is thicker than the bottom slab. The minimum shrinkage camber is -10910-6/m at 2000 days and the residual shrinkage camber is
-8910-6/m at 10,000 days.
Figure10b compares the longitudinal average axial shrinkage strain at sections ‘‘A’’, ‘‘B’’ and ‘‘C’’ calculated according to Eq.3 and MC 2010. The results in the figure were obtained using the nominal thickness given by MC 2010, which is defined as two times the ratio of the cross-sectional area to the perimeter of the structural member in contact with the atmosphere. This led to nominal thicknesses of 1181, 795 and 497 mm at sections ‘‘A’’, ‘‘B’’ and ‘‘C’’, respectively. It should be noted that the hydro-shrinkage coefficient b in the presented model is calculated using MC 2010. The results in Fig.10b show that the calculated shrinkage strain closely
matches the MC 2010 predictions (Fig. 10b) when a valueb¼1:58103is used. Moreover, the relative error of shrinkage strain predictions and the MC 2010 models is around ±5%, which is considered suffi-ciently accurate. As expected, the results show that the time dependent axial shrinkage strain is significantly affected by the nominal thickness of the box girder section. The shrinkage strain at ‘‘C’’ calculated by the proposed approach is 381leat 10,000 days, which is 1.68 times the value at ‘‘A’’.
Figure11 shows the calculated box girder deflec-tion due to shrinkage camber at two points ‘S1’ and ‘S2’, which are approximately located at the free end and mid-span of the cantilever girder. As expected, the varying thickness of the web and bottom slab produces significant upward vertical displacements along the cantilever girder. This deflection increases over time up to 11,000 days, when it reaches maximum values of 3.0 cm and 1.8 cm at ‘S1’ and ‘S2’, respectively. After this peak point, the deflection decreases since the
0 10 20 30
80 85 90 95 100
RH%
Time(days) Measurement(3cm) Measurement(10cm) Calculation(3cm) Calculation(10cm)
(a)
(b) Fig. 9 Comparison of
measured and calculated internal RH at section ‘‘B’’ of Yiju River Bridge. aInternal RH development. bCalculated RH
[image:12.547.135.502.55.396.2]majority of internal moisture in the top slab has been consumed by convection, the shrinkage at the top slab developed more slowly than at the bottom slab. According to the design, creep and prestressing losses will produce a 4.3 cm downward deflection in the bridge after 27 years of service. However, around 70% of such deflection can be potentially compensated by the shrinkage camber of the box girder section. It should be also noted that the influence of creep was disregarded in the analyses. Accordingly, current research by the authors is investigating the influence of creep on shrinkage-induced deformations, and their findings will be published in a forthcoming paper.
Overall, the results of this study indicate that the long term behaviour of long-span box girder bridges is affected by shrinkage camber, and therefore such additional curvatures need to be included in the analysis and design. Based on the results of this study, it can be concluded that the use of data from simple tests, along with inverse FE analyses implementing the adopted hydro-mechanical FE approach, can be used to simulate the shrinkage behaviour of concrete girders exposed to different ambient conditions. Due to the limited test data used for the calibration of the FE models adopted in this study, future research should focus on the determination of suitable surface factors and hydro-shrinkage coefficient values.
6 Conclusions
This article examined experimentally and analytically the effect of different geometries on the development of shrinkage camber in bridge box girders. Small-scale concrete specimens were subjected to different expo-sure conditions to meaexpo-sure the development of shrinkage. Based on the experimental results, a parametric analysis was performed to obtain the surface factor and the hydro-shrinkage coefficient. The test results were then used to examine analytically the effect of geometry and ambient relative humidity on the development of shrinkage deformation of the specimens using a hydro-mechanical approach. The proposed approach was then verified using the Yiju River Bridge (China) as a case study. Based on the experimental and analytical results presented in this article, the following conclusions are drawn:
-12 -10 -8 -6 -4 -2 0 2 4 6
Section i Section A
Section B
Section C
Curvature(10
-6 /m)
Time(days)
(a)
(b)
1 10 100 1000 10000 100000
0 2000 4000 6000 8000 10000
0 100 200 300 400
Shrinkage (10
-6 )
Time(days)
[image:13.547.52.260.59.364.2]Section A Section B Section C Section A MC2010 Section B MC2010 Section C MC2010
Fig. 10 a Evolution of shrinkage camber with time and b shrinkage at sections ‘‘A’’, ‘‘B’’ and ‘‘C’’ of Yiju River Bridge.aShrinkage curvature,bShrinkage strain
1 10 100 1000 10000 100000
0.0 0.5 1.0 1.5 2.0 2.5 3.0 3.5
Deflection(cm)
Time(days)
S1 S2
[image:13.547.49.257.435.600.2]1. Test results from concrete beams with I cross section indicate that axial shortening (due to uniform shrinkage) and shrinkage camber (due to different cross section geometry) occurred simul-taneously. The shrinkage camber increased ini-tially up to a peak point, after which it decreased. The results also indicate that the shrinkage camber can recover when the RH of the testing environ-ment increases.
2. Based on test results and FE inverse analyses, surface factorsf=0.3–0.5 mm/day and a hydro-shrinkage coefficients b =0.0014–0.0015 were derived for typical concrete mixes used in bridge design/construction in China. The use of these values in a hydro-mechanical approach proved very effective at simulating the experimental shrinkage-induced bending deformations of the I beams subjected to different exposure conditions. 3. Results from parametric FE analyses confirm that section size and ambient humidity are the main factors affecting the development of shrinkage deformations in concrete girders. Moreover, the section size affects both the maximum value of shrinkage camber and the time at which it is achieved. However, only the thickness of the cross section components had a major influence on the response after the maximum camber was achieved. 4. The proposed hydro-mechanical FE approach provides a reasonable estimate of the RH of sections of the Yiju River Bridge. Based on these estimates, it is shown that in the long term (27 years), approximately 70% of the vertical deflection can be potentially compensated by the shrinkage camber of the box girder section (excluding creep effects).
5. The results of this study confirm that the long term behaviour of long-span box girder bridges is affected by shrinkage camber, and therefore such additional curvatures need to be included during initial analysis and subsequent assessment.
Acknowledgements The first authors thankfully acknowledge the financial support of the Research Fund for the Doctoral Program of Higher Education of China (Grant No. 20125522120001).
Compliance with ethical standards
Conflict of interest The authors declare that there is no financial or other conflict of interest relevant to the subject of this article.
Open Access This article is distributed under the terms of the Creative Commons Attribution 4.0 International License (http:// creativecommons.org/licenses/by/4.0/), which permits unre-stricted use, distribution, and reproduction in any medium, provided you give appropriate credit to the original author(s) and the source, provide a link to the Creative Com-mons license, and indicate if changes were made.
References
1. Gribniak V, Kaklauskas G, Kliukas R, Jakubovskis R (2013) Shrinkage effect on short-term deformation behavior of reinforced concrete—when it should not be neglected. Mater Des 51:1060–1070. doi:10.1016/j.matdes.2013.05. 028
2. Bazˇant ZP, Yu Q, Li GH (2012) Excessive long-time deflections of prestressed box girders. I: record-span bridge in Palau and other paradigms. J Struct Eng 138(6):676–689. doi:10.1061/(asce)st.1943-541x
3. Bazˇant ZP, Yu Q, Li GH (2012) Excessive long-time deflections of prestressed box girders. II: numerical analysis and lessons learned. J Struct Eng 138(6):687–698. doi:10. 1061/(asce)st.1943-541x
4. ACI (2010) ACI 231R-10: report on early-age cracking: causes, measurement, and mitigation. American Concrete Institute, Farmington Hills
5. ACI (2008) ACI 209.2R-08: guide for modeling and cal-culating shrinkage and creep in hardened concrete. Ameri-can Concrete Institute, Farmington Hills
6. CEB (2013) Fib model code for concrete structures 2010. Wilhelm Ernst & Sohn, Berlin
7. Bazˇant ZP, Donmez A (2015) Extrapolation of short-time drying shrinkage tests based on measured diffusion size effect: concept and reality. Mater Struct 14:1–10. doi:10. 1617/s11527-014-0507-0
8. Krˇı´stek V, Bazˇant ZP, Zich M, Kohoutkova´ A (2006) Box girder bridge deflections. ACI Concr Int 28(1):55–63 9. Malm R, Sundquist H (2010) Time-dependent analyses of
segmentally constructed balanced cantilever bridges. Eng Struct 32(4):1038–1045. doi:10.1016/j.engstruct.2009.12. 030
10. Bakhshi M, Mobasher B, Soranakom C (2012) Moisture loss characteristics of cement-based materials under early-age drying and shrinkearly-age conditions. Constr Build Mater 30:413–425. doi:10.1016/j.conbuildmat.2011.11.015 11. Kim JK, Lee CS (1998) Prediction of differential drying
shrinkage in concrete. Cem Concr Res 28(7):985–994 12. Orta Cortes, JL (2009) Restrained shrinkage in bridge decks
with concrete overlays, Ph.D. thesis, University of Western Ontario, p 218
13. Li Z, Perez Lara MA, Bolander JE (2006) Restraining effects of fibers during non-uniform drying of cement composites. Cem Concr Res 36(9):1643–1652. doi:10.1016/ j.cemconres.2006.04.001
15. Knoppik-Wro´bel A, Klemczak B (2015) Degree of restraint concept in analysis of early-age stresses in concrete walls. Eng Struct 102:369–386. doi:10.1016/j.engstruct.2015.08. 025
16. Briffaut M, Benboudjema F, Torrenti JM, Nahas G (2011) Numerical analysis of the thermal active restrained shrink-age ring test to study the early shrink-age behavior of massive concrete structures. Eng Struct 33(4):1390–1401. doi:10. 1016/j.engstruct.2010.12.044
17. Kwak HG, Ha SJ, Kim JK (2006) Non-structural cracking in RC walls. Cem Concr Res 36(4):749–760. doi:10.1016/j. cemconres.2005.12.001
18. CEB (1990) CEB-FIP model code for concrete structures. Lausanne, Switzerland
19. Jafarifar N, Pilakoutas K, Bennett T (2014) Moisture transport and drying shrinkage properties of steel–fibre-re-inforced-concrete. Constr Build Mater 73:41–50. doi:10. 1016/j.conbuildmat.2014.09.039
20. West RP, Holmes N (2005) Predicting moisture movement during the drying of concrete floors using finite elements. Constr Build Mater 19(9):674–681. doi:10.1016/j. conbuildmat.2005.02.014
21. Bernard O, Bruhwiler E (2003) The effect of reinforcement in the new layer on hygral cracking in hybrid structural elements. Mater Struct 36:118–126
22. Sadouki H, Van Mier JGM (1997) Simulation of hygral crack growth in concrete repair systems. Mater Struct 30:518–526
23. Kim JK, Lee CS (1999) Moisture diffusion of concrete considering self-desiccation at early ages. Cem Concr Res 29:1921–1927
24. Bathe KJ (1996) Finite element procedures, 1st edn. Pren-tice-Hall, Upper Saddle River
25. Zhu BF (2014) Thermal stresses and temperature control of mass concrete, 1st edn. Butterworth-Heinemann, Waltham 26. ARaD Inc (2001) ADINA—theory and modeling guide.
Report 01–7, Watertown, MA
27. China Ministry of Transport (2004) Code for design of highway reinforced concrete and prestressed concrete bridges and culverts—JTG D62-2004. Beijing, China (in Chinese)
28. Kaklauskas G, Gribniak V, Bacinskas D, Vainiunas P (2009) Shrinkage influence on tension stiffening in concrete members. Eng Struct 31(6):1305–1312. doi:10.1016/j. engstruct.2008.10.007
29. Yoo SW, Koh KT, Kwon SJ, Park SG (2013) Analysis technique for flexural behavior in RC beam considering autogenous shrinkage effect. Constr Build Mater 47:560–568. doi:10.1016/j.conbuildmat.2013.05.061 30. Vasiliev V, Morozov EV (2013) Advanced mechanics of
composite materials and structural elements, 3rd edn. Elsevier, Waltham