Journal of Biomaterials and Nanobiotechnology,2011, 2, 173-180
doi:10.4236/jbnb.2011.22022 Published Online April 2011 (http://www.scirp.org/journal/jbnb)
Microscopic Observation of the Intercellular
Transport of CdTe Quantum Dot Aggregates
Through Tunneling-Nanotubes
Lan Mi1, Rongling Xiong1, Yu Zhang1, Zheng Li1, Weidong Yang2, Ji-Yao Chen3 , Pei-Nan Wang1*
1Key Laboratory of Micro and Nano Photonic Structures (Ministry of Education), Department of Optical Science and Engineering,
Fudan University, Shanghai, China; 2Department of Biological Sciences, Center for Photochemical Sciences, Bowling Green State
University, Bowling Green, USA; 3Surface Physics Laboratory (National key laboratory), Department of Physics, Fudan University,
Shanghai, China.
Email: *pnwang@fudan.edu.cn
Received December 9th, 2010; revised February 10th, 2011; accepted February 14th, 2011.
ABSTRACT
Various inorganic nanoparticles are being considered for applications in life science as fluorescent labels and for such therapeutic applications as drug delivery or targeted cell destruction. It is of importance to understand their intercellu-lar transport behaviors and mechanisms. Here, the intercelluintercellu-lar transport of internalized CdTe quantum dot (QD) ag-gregates through tunneling-nanotubes (TNTs) between human hepatocellular carcinoma cells was studied by time-resolved confocal fluorescence microscopy. TNTs are known to connect eukaryotic cells to provide important pathways for intercellular communications. The formation, shrinkage, elongation and rupture of TNTs were clearly observed by microscopy. We found TNTs contained only F-actin or both microtubules and F-actin. Two transport mod-es for QD aggregatmod-es through the TNTs were observed: the microtubule-based bidirectional motion and the ac-tin-dependent unidirectional motion. The mean square displacement analyses revealed that the intercellular transporta-tions of QDs along TNTs were mediated by active processes. The bidirectional intercellular transport of QDs within lysosomes through the TNT was also observed.
Keywords: Quantum Dot, Tunneling-Nanotubes, Active Transport, Fluorescence, Microtubule, Filament
1. Introduction
The tunneling-nanotubes (TNTs) were originally
de-scribed by Gerdes et al for cultured rat neuronal PC12
cells in 2004 [1]. The TNTs are thin tubular protrusions formed from the plasma membranes that connect eu-karyotic cells. The lengths of TNTs can reach several cell diameters [1]. They were observed in a variety of cell types both in vivo and in vitro, including the mouse
cor-neal [2], neuronal [1,3], myeloid [4-7], immune [6-11], epithelial [1,12-15] and mast cells [16]. A multitude of cargos, including calcium fluxes [5], [16], bacteria [7], nucleic acids [17], virus [8,11], endosomal vesicles [1,7], lysosomes [3,7], mitochondria [7,17,18], and QDs [19] were observed to be transported through TNTs. Thus, TNTs play an important role in cell-to-cell communica-tion and represent a general mechanism for funccommunica-tional connectivity between living cells. The communications mediated by these long-range physical connections among
living cells are more widespread than previously thought. Recently, a great variety of inorganic nanoparticles (NPs) was synthesized and widely applied in life science as fluorescent labels and in therapeutic applications as drug delivery or targeted cell destruction [20-22]. While intercellular transport can enhance the effectiveness of NP therapeutics, it also potentially results in toxicity to the tissue. Undoubtedly, nanotoxicology has to be ma- tured as a scientific discipline to enable the widespread application of NPs. Hence, it is of great importance to understand the behavior and mechanism of the intercel-lular transport of NPs.
fluores-cence microscopy. The QDs are sufficiently bright and photostable for the long term tracking of intercellular events [22,23].
2. Materials and Methods
2.1. Cell CultureQGY-7703 cells obtained from the Cell Bank of Shang-hai Science Academy were seeded into a Petri dish con-taining DMEM-H medium with 10 % fetal bovine serum, 100 μg·mL–1 streptomycin and 100 μg·mL–1 neomycin.
The cells were then cultured in a fully humidified incu-bator at 37℃ with 5 % CO2 for 24 h.
2.2. Cell Uptake of QDs and Living Cell Staining The water-soluble thiol-capped CdTe QDs with the emission peak at 601 nm were prepared via the modified hydrothermal route using the thioglycolic acid as a stabi-lizer [24]. When the cells reached 80 % confluence, the QDs aqueous solution was added into the culture dish to reach a final concentration of 50 - 100 μg·mL–1. The cells
were then incubated for 15-30 min in the incubator for uptake of QDs.
For imaging of lysosomes, the QD loaded cells were further incubated with 50 nM LysoTracker Green DND-26 in growth medium (Invitrogen, Molecular Probes) for another 15 min to stain lysosomes. After in-cubation, the Petri dish with the adhered living cells was washed with phosphate-buffered saline (PBS) three times to remove the unbound QDs and fluorescent probes. During the microscopic examination, the cells were kept
at 37℃/5% CO2 in a temperature controller mounted on
the microscope stage (Olympus). 2.3. Fixation and Immunostaining
The QGY cells were fixed with 4% paraformaldehyde (Sigma) for 30 min at room temperature, and then ex-tracted with 0.1% (v/v) Triton X-100 in 4% paraformal-dehyde for 15 min. After washing three times with PBS, the Petri dishes with attached cells were treated with 1% BSA block for 2 h at 4℃, and then incubated in 2 μg
·
mL–1affinity purified anti-α-tubulin (DM1A; eBioscience)
overnight at 4℃. After washing three times with 0.05%
Tween20/PBS, the cells were stained with 2 μg
·
mL–1R-Phycoerythrin conjugated goat anti-mouse IgG (Mul-tiSciences) for α-tubulin labeling and 5 - 10 nM Alexa Fluor® 488 phalloidin conjugate (Invitrogen, Molecular Probes) for F-actin labeling for 2 h at room temperature. Meanwhile, to reduce nonspecific background staining, 1% BSA was added to the staining solution. The dishes with attached cells were washed three times with 0.05% Tween20/PBS before microscopic observation.
2.4. Microscopy
The three-dimensional (3-D) fluorescence images and the
DIC micrographs were acquired by a laser scanning confocal microscope (Olympus, FV-300, IX71) using a
488 nm Ar+ laser (MELLES GRIOT) as the excitation
source and a 60× oil objective to focus the laser beam. The fluorescence images of QDs and lysosomes were recorded simultaneously in two channels of the micro-scope with a 585-640-nm bandpass filter for QDs and a 505-550-nm bandpass filter for lysosomes. Using the t-scan mode (15-180 seconds interval per frame with 2.8-second exposure time for each image) of the micro-scope, the dynamic morphological change of TNTs and the intercellular transportation of QDs were recorded. Similar method was used to detect the F-actin and mi-crotubes in TNTs. The fluorescence images of F-actin and microtubes were recorded simultaneously in two channels with a 505-550-nm and a 585-640-nm bandpass filter, respectively.
3. Results and Discussion
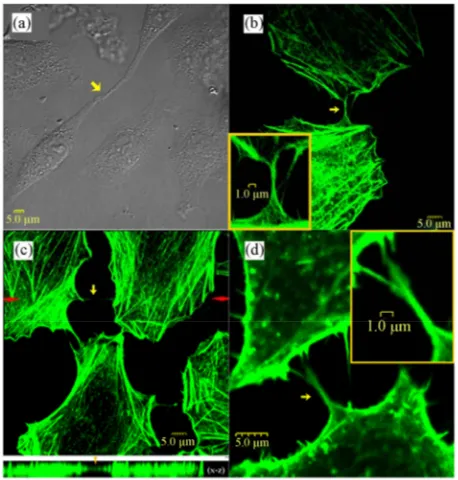
3.1. TNT StructuresThe QGY cells connected by TNTs were observed in both differential interference contrast (DIC) micrographs and F-actin stained fluorescence images (Figure 1). The TNTs stretched between interconnected cells at their nearest distance. Typically, a seamless transition of the membrane from the TNT to both connected cells was observed, such as those shown in Figure 1(a,b). The junction border between the protrusion of one cell and the membrane of the other connected cell was rarely ob-served in this work. The DIC image (Figure 1(a)) dem-onstrates that the protrusions from the two neighboring cells met with each other to form a TNT and the joining point can be seen in the middle of the TNT as marked with an arrowhead. The fluorescence image (Figure 1(c)) shows a 3-D confocal micrograph of the F-actin-stained QGY cells, where the main image exhibits the TNTs in the X-Y plane and the lower part shows an X-Z profile
along the TNT in the main image marked with a pair of red arrows. It can be seen clearly that the TNT hovers in the medium and has no contact to the substratum, which is a criterion described for TNTs [1,25]. Interestingly, a TNT from a cell branched into two TNTs connecting one nearby cell as shown in Figure 1(d).
Microscopic Observation of the Intercellular Transport of CdTe Quantum Dot Aggregates Through Tunneling-Nanotubes 175
Figure 1. TNTs connecting QGY cells. TNTs are marked with arrowheads in all the images. No junction border be-tween the nanotube and cell surface is observed. (a) DIC images showing the formation of a TNT, where the joining point of the protrusions from the two neighboring cells can be see in the middle of the TNT as marked with an arrow-head. (b-d) Fixed QGY cells were stained with Alexa Fluor® 488 phalloidin (green) to show F-actin contained TNTs. (c) The main image exhibits the TNTs in the X-Y plane and the lower part is an X-Z profile along the TNT in the main im-age marked with a red arrowhead. (d) A branched TNT connecting two cells. The enlarged views are shown as insets.
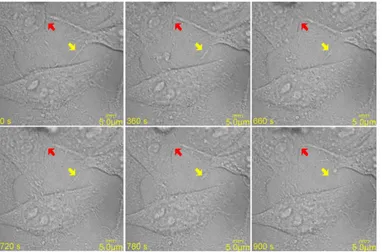
The dynamic morphological changes of TNTs and the intercellular transport behaviors of QDs via TNTs were studied using the t-scan mode of the microscope (per frame with 15-180 seconds interval and 2.8-second ex-posure time). The rupture of a TNT through apparent retraction of the nanotube due to the mechanical stress was demonstrated in Figure 3 (marked with a yellow arrow). A protrusion from a QGY cell reached the brane of a neighboring cell and the fusion of the branes at the contact point formed a continuous mem-brane bridge can be seen in the same figure (marked with a red arrow). Interestingly, the TNT was broken when one of the connected cells died by necrosis as shown in Figure 4.
Both the elongation and shrinkage of TNTs were ob-served in the time-resolved DIC micrographs. Cell mi-gration was often observed for the adherent QGY cells in the Petri dish. Elongation or shrinkage of a TNT oc-curred when two TNT-connected cells moving apart or closer. It was suggested that cells maintain a membrane reservoir, which provides a membrane flow into the
growing or elongating TNT and draws back the mem-brane from the shortening TNT [26-28]. However, it seemed that there existed mechanical stress to make TNTs stretched to straight lines with shortest lengths to facilitate the cell-to-cell communication.
3.2. Transportation of QDs Along TNTs
The TNTs could also be observed by differential inter-ference contrast (DIC) microscopy as shown in Figure 5. With DIC and fluorescence images acquired by the t-scan mode of the microscope, the intercellular transport behaviors of QDs via TNTs were studied. The water- soluble CdTe QDs were incubated with the QGY cells for 15-30 min. The internalization of QDs was then ob-served clearly with the 3-D confocal micrographs. The internalized QDs were not diffusely distributed inside the cell. A common observation is that QDs tend to aggre-gate inside living cells and are often trapped in organelles such as vesicles, endosomes, and lysosomes [29,30]. Mi-croscopic analysis further revealed that the internalized QD aggregates could be transported along TNTs. A se-ries of time-resolved frames selected from a video is shown in Figures 5(b)-(d) to demonstrate the transport of a QD aggregate along the TNT. The size of this QD aggregate was estimated to be about 1.2 μm, which was in a comparative large size than previously reported car-gos [5,7,8,11,16,19]. It took 1400 seconds for this QD aggregate to traverse a distance of 4.6 μm in the TNT, corresponding to a transport speed of 3.3 nm·s–1.
Unlike the reported actin-dependent unidirectional transport of cargos through TNTs [1,3,18], our inspec-tions revealed that the QD aggregate changed speed, transiently stopped, or changed direction during its transport along the TNT, corresponding to a bidirectional manner. Figure 5(e) shows its trajectory along the TNT. Since the TNT changed its length during the QD trans-port, the displacement of the QD aggregate was meas-ured relative to the stationary central point of the TNT. It can be seen clearly that the motion of QDs was bidirec-tional, in accord with the previous report of the micro-tubule-based vesicular traffic [7].
Figures 5(f)-(i) show a time-lapse image sequence of two QD aggregates traveling along a TNT towards the cell at the right side. The sizes of these two QD aggre-gates were estimated to around 0.5-0.7 μm in diameter, smaller than the QD aggregate described above in Fig-ures 5(a)-(d). Their moving speeds were measured to be
about 28 (yellow arrow) and 21 (green arrow) nm·s–1,
respectively. These transport speeds are much higher than the net transport speed of the QD aggregate (3.3 nm
·
s–1) inFigure 2. Fixed QGY cells were stained with Alexa Fluor® 488 phalloidin for F-actin (green) and immunostained with an antibody against α-tubulin (red). (a) A TNT between QGY cells contains F-actin but no microtubule. (b) A TNT between QGY cells contains both F-actin and microtubules. Enlarged views of the TNTs are shown in the insets of the figures. The fluorescence images of F-actin and microtubes were recorded simultaneously in two channels of the microscope with a 505- 550-nm and a 585-640-nm bandpass filter, respectively.
[image:4.595.110.492.432.684.2]Microscopic Observation of the Intercellular Transport of CdTe Quantum Dot Aggregates Through Tunneling-Nanotubes 177
Figure 4. The TNT marked with a yellow arrow was broken when one of the connected cells died by necrosis.
Figure 5. (a) DIC micrograph of two QGY cells connected by a TNT. (b)-(d) Time-lapse merged images of DIC and fluorescence micrographs to show the transport of a QD aggregate (marked with yellow arrowheads) through a TNT. The red color denotes the fluorescence from QDs. (Scale bar, 5 μm.) (e) Trajectory of the QD aggregate in (b)-(d). Posi-tion 0 represents the starting posiPosi-tion of the QD aggregate in the TNT once our measurement began. (f)-(i) Time-lapse images to show two QD aggregates (marked with yellow and green arrows, respectively) traveling along a TNT. (Scale bar, 5 μm.) (j) Trajectories of the two QD aggre-gates in (f)-(i), where (5) corresponds to the QD aggregate marked with the yellow arrow and (6) the green arrow. (k) MSD plots for the four periods of continuous moving in (e) that marked as (1), (2), (3) and (4) and the two unidirec-tional moving in (j) that marked as (5) and (6). The straight lines in the plot are the fitted lines. S represents the slope of the fitted line and R the correlation coefficient.
two QD aggregates were unidirectional as shown in Fig-ure 5(j), corresponding to the actin-dependent transpor-tations.
When calculating the moving rates of the QD aggre-gate in the four continuous moving periods in Figure 5(e), it was found that these speeds had the similar value of 18 ± 4 nm
·
s–1, which were much faster than the netspeed of the bidirectional motion of the QDs (3.3 nm
·
s–1)but were close to the speeds of the unidirectional mo-tions in Figure 5(j) (28 and 21 nm
·
s–1). It means thebidirectional motion greatly reduced the transport speed.
The mean square displacement (MSD) is commonly used to determine whether the movement is active trans-port or diffusion [13]. The movement can be attributed to the free diffusion when the slope of a log–log plot of MSD as a function of time equals 1, whereas a slope less than 1 refers obstructed movement, and a slope greater than 1 indicates an active transport [31]. As shown in Figure 5(e), there are four periods of the continuous movements. Three of them were forward movements and one backward. By choosing these four continuous movements in Figure 5(e) denoted as (1) to (4) and the two unidirectional movements in Figure 5(j) denoted as (5) and (6), we calculated the relationships of log MSD versus log t. The results are plotted in Figure 5(k), where the starting time and the displacement of the starting po-sition for every movement were set as 0. All the simu-lated slopes (from 1.72 to 3.04) support that the QDs were transported actively along the TNT.
By estimating the size of the QD aggregate and the thickness of the TNT in Figure 5(a), we found that the diameter of the QD aggregate is a little larger than that of the TNT. As reviewed in Ref. [32], this phenomenon was observed previously and called vesicular dilatation. The vesicle-like dilatations of the TNTs may be formed be-cause of an organelle, vesicle or supramolecular assem-bly with a larger diameter being transported inside them. These dilatations can be transported along the TNT and then released into the cytoplasm of the second cell [12,33,34].
There were two classes of TNTs as shown in Figure 2, which can be distinguished by their cytoskeletal struc-ture and their functional properties. As reported by
On-felt et al, thin TNTs contained only F-actin, whereas
thicker nanotubes, i.e., those > ~0.7 μm in diameter,
The bidirectional microtubule-based transport mode has been reviewed by Gross in detail [34]. The transport modes of cargos along TNTs between cells should be same due to the similar cytoskeletal structure. There are three classes of molecular motors which transport cargos along the actin filaments or the microtubules with a cer-tain direction: the myosin motors that move along actin filaments unidirectionally; the kinesin motors that move along microtubules, predominantly towards the micro-tubule plus-ends; and the dynein motors that move to-wards the microtubule minus-ends. For microtubule- based transport mode, kinesin and dynein motors can make the cargo move back and forth as a result [34]. The net or average direction of transport depends on which kind of motor plays the dominant role at one moment. For the actin-dependent transport mode, the myosin pro-tein moves the cargo unidirectionally. Figure 6 shows the bidirectional and unidirectional transportations of QDs along a TNT schematically.
3.3. Transportation of QDs Inside lysosomes Along TNTs
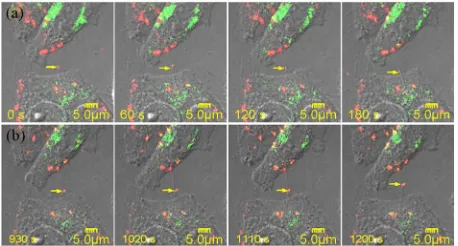
[image:6.595.307.536.478.601.2]As reported, a wide variety of intracellular compartments was observed to traffic through the TNTs between ma-crophages and arrive in the cytoplasm of cells [7]. In our previous work, co-localization of QDs with lysosomes in living cells has been observed [35]. Lysosomes are one of the major destinations of internalized QDs. Hence, it is possible that QDs could transport between cells within lysosomes. To verify this hypothesis, the lysosomes in QGY cells were stained with LysoTracker after the cells were incubated with QDs. The fluorescence images of QDs and lysosomes were recorded simultaneously in two
Figure 6. Schematic diagram of possible models for TNT- mediated transport of QDs. For microtubule-based trans-port, the kinesin motors move the cargo along microtubules, predominantly towards the microtubule plus-ends and the dynein motors move the cargo towards the microtubule minus-ends. These two kinds of motors can make the cargo move back and forth as a result. While the myosin motors move the cargo unidirectionally along the actin filament.
with a 585-640-nm bandpass filter for QDs and a 505- channels of the microscope 550-nm bandpass filter for lysosomes. In the fluorescence micrographs, the red and green colors denote the QDs and the lysosomes, respec-tively, and the yellow color in the overlaid images repre-sents the mixed fluorescence from LysoTracker and QDs. As shown in Figure 7(a), a QD aggregate was trans-ported along a TNT in the bidirectional manner from the first cell in the upper side of the figure to the second cell at the lower side. After a while, a QD loaded lysosome (yellow color) moved backward along the same TNT to the first cell as shown in Figure 7(b). It means that QDs can transport between cells within or without lysosomes. However, the mechanism should be the same since the internalized QDs are believed to be aggregated inside the endocytotic vesicles.
4. Conclusions
TNTs with different diameters were observed to connect QGY cells. The TNTs contained only F-actin or both microtubules and F-actin. The formation, shrinkage, elon-gation and rupture of TNTs between QGY cells were observed. The internalized QD aggregates were trans-ported to the neighboring cells via TNTs either in a bidi-rectional or a unidibidi-rectional manner. The transport of QDs within lysosomes was also observed. The MSD analyses revealed that the intercellular transportations of QDs along TNTs were mediated by active processes. A fully understanding of the TNT-mediated intercellular transport mechanism for NPs will provide solid funda-mental knowledge for the application of NPs in drug de-livery.
[image:6.595.59.286.497.630.2]Microscopic Observation of the Intercellular Transport of CdTe Quantum Dot Aggregates Through Tunneling-Nanotubes 179
5. Acknowledgements
This work is supported by National Natural Science Foundation of China (61008055, 11074053), the Ph.D. Programs Foundation of Ministry of Education of China (20100071120029) and Shanghai Educational Develop-ment Foundation (2008CG03).
REFERENCES
[1] A. Rustom, R. Saffrich, I. Markovic, P. Walther and H. H. Gerdes, “Notubular Highways for Intercellular Organelle Transport,” Science, Vol. 303, No. 5660, 2004, pp. 1007- 1010. doi:10.1126/science.1093133
[2] H. R. Chinnery, E. Pearlman and P. G. McMenamin, “Cutting Edge: Membrane Nanotubes in Vivo: A Feature of Mhc Class Ii+ Cells in The Mouse Corneal,” The
Journal of Immunology, Vol. 180, No. 9, 2008, pp.
5779-5783.
[3] K. Gousset, E. Schiff, C. Langevin, Z. Marijanovic, A. Caputo, D. T. Browman, N. Chenouard, F. de Chaumont, A. Martino, J. Enninga, J. C. Olivo-Marin, D. Mannel and C. Zurzolo, “Prions Hijack Tunnelling Nanotubes for In-tercellular Spread,” Nature Cell Biology,Vol. 11, No. 3, 2009, pp. 328-336. doi:10.1038/ncb1841
[4] D. M. Davis and S. Sowinski, “Membrane Nanotubes: Dynamic Long-Distance Connections between Animal Cells,” Nature Reviews Molecular Cell Biology, Vol. 9, No. 6, 2008, pp. 431-436. doi:10.1038/nrm2399
[5] S. C. Watkins and R. D. Salter, “Functional Connectivity between Immune Cells Mediated by Tunneling Nano-tubules,” Immunity, Vol. 23, No. 2005, pp. 309-318. [6] B. Onfelt, S. Nedvetzki, K. Yanagi and D. M. Davis,
“Cutting Edge: Membrane Nanotubes Connect Immune Cells,” Journal of Immunology, Vol. 173, No. 3, 2004, pp. 1511-1513.
[7] B. Onfelt, S. Nedvetzki, R. K. P. Benninger, M. A. Purb-hoo, S. Sowinski, A. N. Hume, M. C. Seabra, M. A. A. Neil, P. M. W. French and D. M. Davis, “Structurally Distinct Membrane Nanotubes between Human Macro-phages Support Long-Distance Vesicular Traffic or Surf-ing of Bacteria,” Journal of Immunology, Vol. 177, No. 12, 2006, pp. 8476-8483.
[8] S. Sowinski, C. Jolly, O. Berninghausen, M. A. Purbhoo, A. Chauveau, K. Kohler, and et al. , “Membrane nano-tubes Physically Connect T Cells over Long Distances Presenting a Novel Route for Hiv-1 Transmission,” Na-ture Cell Biology, Vol. 10, No. 2, 2008, pp. 211-219. doi:10.1038/ncb1682
[9] O. Rechavi, I. Goldstein and Y. Kloog, “Intercellular Exchange of Proteins: The Immune Cell Habit of Shar-ing,” FEBS Letters, Vol. 583, No. 11, 2009, pp. 1792- 1799. doi:10.1016/j.febslet.2009.03.014
[10] D. M. Davis, “Mechanisms and Functions for the Dura-tion of Intercellular Contacts Made by Lymphocytes,” Nature Reviews Immunology, Vol. 9, No. 8, 2009, pp. 543-555. doi:10.1038/nri2602
[11] E. A. Eugenin, P. J. Gaskill and J. W. Berman, “Tunnel-ing Nanotubes (Tnt) are Induced by Hiv-Infection of Macrophages: A Potential Mechanism for Intercellular Hiv Trafficking,” Cell Immunology, Vol. 254, No. 2, 2009, pp. 142-148. doi:10.1016/j.cellimm.2008.08.005 [12] P. Veranic, M. Lokar, G. J. Schutz, J. Weghuber, S.
Wie-ser, H. Haegerstrand, V. Kralj-Iglic and A. Iglic, “Differ-ent Types of Cell-to-Cell Connections Mediated by Nano- tubular Structures,” Biophysical Journal, Vol. 95, No. 9, 2008, pp. 4416-4425.
doi:10.1529/biophysj.108.131375
[13] S. Gurke, J. F. V. Barroso, E. Hodneland, N. V. Buko-reshtliev, O. Schlicker and H. H. Gerdes, “Tunneling Nanotube (Tnt)-Like Structures Facilitate a Constitutive, Actomyosin-Dependent Exchange of Endocytic Organ-elles between Normal Rat Kidney Cells,” Experimental Cell Research, Vol. 314, No. 20, 2008, pp. 3669-3683. doi:10.1016/j.yexcr.2008.08.022
[14] N. M. Sherer, M. J. Lehmann, L. F. Jimenez-Soto, C. Horensavitz, M. Pypaert and W. Mothes, “Retroviruses Can Establish Filopodial Bridges for Efficient Cell-To- Cell Transmission,” Nature Cell Biology, Vol. 9, No. 3, 2007, pp. 310-315. doi:10.1038/ncb1544
[15] M. Lokar, A. Iglič and P. Veranič, “Protruding Membrane Nanotubes: Attachment of Tubular Protrusions to Adja-cent Cells by Several Anchoring Junctions,” Protoplasma, Vol. 246, 2010, pp. 81-87.
doi:10.1007/s00709-010-0143-7
[16] F. B. Nimita H. Fifadara, Shoichiro Ono and Santa J. Ono, “Interaction between Activated Chemokine Receptor 1 and Fceri at Membrane Rafts Promotes Communication and F-Actin-Rich Cytoneme Extensions between Mast Cells,” International Immunology, Vol. 22, No. 2, 2010, pp. 113-128. doi:10.1093/intimm/dxp118
[17] P. Tavi, T. Korhonen, S. L. H. Nninen, J. D. Bruton, S. Lööf, A. Simon and H. Westerblad, “Myogenic Skeletal Muscle Satellite Cells Communicate by Tunnelling Na-notubes,” Journal of Cellular Physiology, Vol. 223, No. 2, 2010, pp. 376-383.
[18] M. Koyanagi, R. P. Brandes, J. Haendeler, A. M. Zeiher and S. Dimmeler, “Cell-to-Cell Connection of Endothe-lial Progenitor Cells With Cardiac Myocytes by Nano-tubes,” Circulation Research, Vol. 96, 2005, pp. 1039- 1041. doi:10.1161/01.RES.0000168650.23479.0c [19] K. He, W. Luo, Y. Zhang, F. Liu, D. Liu, L. Xu, L. Qin,
C. Xiong, Z. Lu, X. Fang and Y. Zhang, “Intercellular Transfer of Quantum Dots Mediated by Membrane Na-notubes,” ACS Nano, Vol. 4, No. 6, 2010, pp. 3015-3022. doi:10.1021/nn1002198
doi:10.1021/nn800072t
[22] J. Rao, A. Dragulescu-Andrasi and H. Yao, “Fluorescence Imaging in Vivo: Recent Advances,” Current Opinion in Cell Biology, Vol. 18, 2007, pp. 17-25.
[23] J. Gao and B. Xu, “Applications of nanomaterials inside cells,” Nano Today, Vol. 4, 2009, pp. 37-51.
doi:10.1016/j.nantod.2008.10.009
[24] J. Guo, W. L. Yang and C. C. Wang, “Systematic Study of the Photoluminescence Dependence of Thiol-Capped CdTe Nanocrystals on the Reaction Conditions,” Journal Of Physical Chemistry, Vol. 109, 2005, pp. 17467-17473. doi:10.1021/jp044770z
[25] H. H. Gerdes, N. V. Bukoreshtliev and J. F. V. Barroso, “Tunneling nanotubes: A New Route for the Exchange of Components between Animal Cells,” FEBS Letter, Vol. 581, No. 11, 2007, pp. 2194-2201.
doi:10.1016/j.febslet.2007.03.071
[26] S. Gurke, J. F. V. Barroso and H. H. Gerdes, “The Art of Cellular Communication: Tunneling Nanotubes Bridge the Divide,” Histochemistry and Cell Biology, Vol. 129, No. 5, 2008, pp. 539-550.
doi:10.1007/s00418-008-0412-0
[27] D. Raucher and M. P. Sheetz, “Characteristics of a Mem-brane Reservoir Buffering MemMem-brane Tension,” Bio-physical Journal, Vol. 77, 1999, pp. 1992-2002.
doi:10.1016/S0006-3495(99)77040-2
[28] M. Sun, J. S. Graham, B. Hegedüs, F. Marga, Y. Zhang, G. Forgacs and M. Grandbois, “Multiple Membrane Tethers Probed by Atomic Force Microscopy,” Biophysi-cal Journal , Vol. 89, 2005, pp. 4320-4329.
doi:10.1529/biophysj.104.058180
[29] G. Ruan, A. Agrawal, A. I. Marcus and S. Nie, “Imaging and Tracking of Tat Peptide-Conjugated Quantum Dots in Living Cells: New Insights into Nanoparticle Uptake, In-tracellular Transport, and Vesicle Shedding,” Journal of the American Chemical Society, Vol. 129, 2007, pp. 14759-14766. doi:10.1021/ja074936k
[30] A. M. Smith, H. Duan, A. M. Mohs and S. Nie, “Biocon-jugated Quantum Dots for in Vivo Molecular and Cellular Imaging,” Advanced Drug Delivery Reviews, Vol. 60, 2008, pp. 1226-1240. doi:10.1016/j.addr.2008.03.015 [31] M. J. Saxton, “Anomalous Diffusion Due to Obstacles: A
Monte Carlo Study,” Biophysical Journal, Vol. 66, 1994, pp. 394-401. doi:10.1016/S0006-3495(94)80789-1 [32] M. Lokar, Š. Perutková, V. Kralj-Iglič, A. Iglič and P.
Veranič, “Advances in Planar Lipid Bilayers and Lipo-somes,” Elsevier: Burlington, 2009; Vol. 10.
doi:10.1016/S1554-4516(09)10003-0
[33] A. Iglič, M. Lokar, B. Babnik, T. Slivnik and P. Veranič, “Possible Role of Flexible Red Blood Cell Membrane Nanodomains in the Growth and Stability of Membrane Nanotubes,” Blood Cells Molecules, and Diseases, Vol. 39, 2007, pp. 14-23. doi:10.1016/j.bcmd.2007.02.013 [34] S. P. Gross, “Hither and Yon: A Review of Bi-Directional
Microtubule-Based Transport,” Physical Biology, Vol. 1, 2004, pp. R1-R11. doi:10.1088/1478-3967/1/2/R01 [35] Y. Zhang, L. Mi, R. Xiong, P.-N. Wang, J.-Y. Chen, W.