Predicting and Optimizing Image Compression
Oleksandr Murashko
School of Computer Science University of St Andrews, UK
[email protected]
John Thomson
School of Computer Science University of St Andrews, UK
[email protected]
Hugh Leather
School of Informatics University of Edinburgh, UK
[email protected]
ABSTRACT
Image compression is a core task for mobile devices, social media and cloud storage backend services. Key evaluation criteria for compression are: the quality of the output, the compression ratio achieved and the computational time (and energy) expended. Predicting the effectiveness of standard compression implementations like libjpeg and WebP on a novel image is challenging, and often leads to non-optimal compression.
This paper presents a machine learning-based technique to accurately model the outcome of image compression for arbitrary new images in terms of quality and compression ratio, without requiring significant additional computational time and energy. Using this model, we can actively adapt the aggressiveness of compression on a per image basis to accurately fit user requirements, leading to a more optimal compression.
Keywords
Image compression; machine learning; JPEG; WebP
1.
INTRODUCTION
Photography is one of the key use scenarios for mobile devices. The demands of the modern consumer are ever in-creasing – a single photo might now be expected to be auto-matically uploaded to multiple cloud services, re-compressed, edited, and shared with others via social media apps. This combined with the trend for high resolution sensors in mo-bile cameras means significantly increased pressure on cel-lular networks and storage requirements. Similarly, social media and cloud storage services frequently serve images at different resolutions, requiring multiple server-side compres-sions of the uploaded source, often on-the-fly. There is a clear incentive to minimize file size of images, while main-taining a required level of quality, and not increasing energy consumption, which is so critical to both mobile and cloud services.
Permission to make digital or hard copies of all or part of this work for personal or classroom use is granted without fee provided that copies are not made or distributed for profit or commercial advantage and that copies bear this notice and the full citation on the first page. Copyrights for components of this work owned by others than the author(s) must be honored. Abstracting with credit is permitted. To copy otherwise, or republish, to post on servers or to redistribute to lists, requires prior specific permission and/or a fee. Request permissions from [email protected].
MM ’16, October 15–19, 2016, Amsterdam, The Netherlands. c
2016 Copyright held by the owner/author(s). Publication rights licensed to ACM. ISBN 978-1-4503-3603-1/16/10. . . $15.00
DOI:http://dx.doi.org/10.1145/2964284.2967305
This paper presents a machine learning-based technique to accurately predict the outcome of image compression from an uncompressed source like a camera sensor, or a resized image, in terms of image quality and compression ratio. Us-ing our models, we can actively adapt the aggressiveness of compression on a per image basis to accurately fit user re-quirements in terms of required image quality (as measured by PSNR or MSSIM [21]) or compression ratio, while max-imizing the free objective.
User requirements are essentially arbitrary, but our tech-nique can adapt to any desired quality level or target file size. Taking a common usage scenario where a mobile de-vice compresses 16 MP image into JPEG at quality factor
(QF) 90, we observe the 5th percentile of quality over a large dataset. Assuming this as a minimum acceptable quality, we can maintain the same minimum quality while reducing the average file size by 38%, resulting in consequent savings in bandwidth, storage and energy of transmission.
We employ a classic machine learning approach to build a statistical model – extracting features from uncompressed images using a fast analysis pass, and mapping these features and compression parameters to compression ratio. By build-ing the model based on a dataset of 50 000 different images, from 0.24 MP to 24 MP, we are able to adequately char-acterise the space of images, such that new, unseen images can be predicted accurately. We implement our technique for bothlibjpeg[2] and Google’sWebP[1] compressors, with each requiring its own models.
2.
RELATED WORK
The most well known open source JPEG codecs, libjpeg
execution time and energy consumption are known to be highly correlated [9].
Google’s WebP compressor does provide options to more accurately target a particular image quality (specified in PSNR) or target file size, but at the expense of significantly longer compression time. The WebP manual [1] explains this additional time by making ‘several passes of partial en-coding’ to fit the given constraints. By contrast, our work requires no additional recompressions.
Several papers have looked at the problem of predicting the effects of recompressing already compressed images.
Chandra et al. consider JPEG image transcoding [4]. Their method involves generating a statistical table to de-termine if recompressing a particular image is worthwhile in terms of predefined tradeoff between reduced size and lower quality. To navigate this table, they use parameters of the compressed JPEG image obtained from manipulating DCT coefficients. The idea of using coefficients of image spectral transformations has inspired our feature design.
Coulombe and Pigeon present their own predictor of file size and image complexity for JPEG over a number of papers describing similar techniques [14, 5, 15, 16, 17, 11, 18]. The key idea underpinning these works is to use the compres-sion ratio of an already encoded image as input to nearest neighbor and table-based predictors, under the assumption that file size and quality grow monotonically with increasing quality factor, and neighbor values of quality factor corre-spond to similar compression ratio and quality level. Our approach differs as it does not require the input image to be compressed and instead works on uncompressed images. Nevertheless, we compare experimentally with their work and show a significantly lower error in our model, despite having less information as input.
There are a number of papers that discuss image feature extraction for a range of purposes. Many of these features are complex and related mostly to computer vision problems like in [12]. However, others consider low-level features – in particular, discrete wavelet transform coefficients are used by Hanghang et al. [19] to indicate the amount of blur in the images and by Viola et al. [20] to detect faces. We do not believe that features designed for vision are likely to be transferable to our problem.
3.
METHODOLOGY
In order to predict the image quality and file size of our compressed images, we employ a classical machine learning approach. We gathered a dataset of 500 000 uncompressed images – a set of 100 different image resolutions logarithmi-cally distributed by size in the range [0.24; 24] megapixels. These images were resampled down from larger photographs to the desired size using the Fant method [6], which is a geometrically accurate anti-aliasing technique. The origi-nal images of different sizes from 24 MP to approximately 36 MP were collected from a wide selection of image-hosting websites and personal archives. None of the images were du-plicates, which we engineered by design, and verified using an external tool – “Awesome Duplicate Photo Finder” [8]. The dataset was equally split into standard training (50 000 images), validation (50 000) and testing (400 000) sets. The experiments were conducted on an Intel Core i7 5820K @ 4.0 GHz, 16 GB RAM running Ubuntu 14.04 64-bit with GCC 4.8 compiler. The software used was libjpeg-turbo-1.4.2 and libwebp-0.4.3.
3.1
Feature description
Descriptive features are the key to any successful machine learning approach. We designed a feature set to capture the complexity and compression characteristics of the image from its pixel data.
[image:2.612.317.557.215.391.2]The features were devised manually, based on the assump-tion that highly detailed and noisy images are less compress-ible –e.g. the average magnitude of the image gradient, the amplitude of high-frequency components of different spec-tral transformations like discrete cosine transform, discrete Haar wavelet transform and the Walsh-Hadamard transform [13, fig. 3]. The assumption behind the selection was that some high-frequency image characteristics correlate with the amount of noise in the image.
Figure 1: Differences between pixels and blocks for calculating features: (a) f1 and f4, (b) f2 and f5, (c) f3 and f6; and convolutions for features (d) f7, (e)f8, (f ) f9
The first step in calculating a set of content features for an image is to divide it onto fragments 8×8 pixels. This facilitates usage of Intel AVX instructions in program im-plementation. Subsequently, the raw pixel values in RGB format are converted toY CbCrcolor space following ITU-R
BT.601 standard [7], but using full range for luminance and chrominance components.
We define featuref1 as a mean absolute neighbor pixel difference. Figure 1a shows selected differences in 8×8 frag-ment with arrows. More simply, if a and b are brightness levels of adjacent pixels, then this feature is an arithmetical average of|a−b|. In our implementation we consider only some of possible differences in the fragment to optimize for specific AVX instructions like horizontal subtraction.
Feature f2 is a mean absolute difference between neigh-bor blocks of 2×2 pixels. It can be considered as a ”lower frequency” modification of the f1. Conceptuallyf2 is the same asf1, but instead of pixelsaandbwe use mean values for adjacent blocks 2×2 (figure 1b). Again, not all possible differences are considered due to usage of AVX instructions. Featuref3is a mean absolute difference between neighbor blocks of 4×4 pixels. f3 is an analogue off1andf2 (figure 1c).
Featuresf4,f5 and f6 are very similar to the described
absolute, for example,f4 is a mean squared neighbor pixel difference.
Features f7 and f9 are mean absolute values of “check-board” convolutions in all non-overlapping blocks of 2×2 and 8×8 pixels respectively (fig. 1d and 1f). By “checkboard” convolution we mean the last high-frequency basis function in 2-dimensional Walsh-Hadamard transform (WHT) of the respective size [13, fig. 3]. Featuref8is another WHT coef-ficient of lower frequency calculated in blocks of 4×4 pixels (fig. 1e).
f10is the only feature calculated for chrominance compo-nents of the image. f10 is exactly the same asf2, but it is calculated and averaged for both color componentsCb and
Crinstead of luminanceY.
The dynamic range of these features is quite large, and the majority of values are close to zero (but always >0). Consequently the coverage of the feature space is very ir-regular. Therefore, we logarithmize all 10 features to make them suitable for regression: fi ← ln(fi+ 1). Increment
[image:3.612.53.295.288.666.2]is required to avoid ln(0). Logarithmizing makes feature values distribution close to normal.
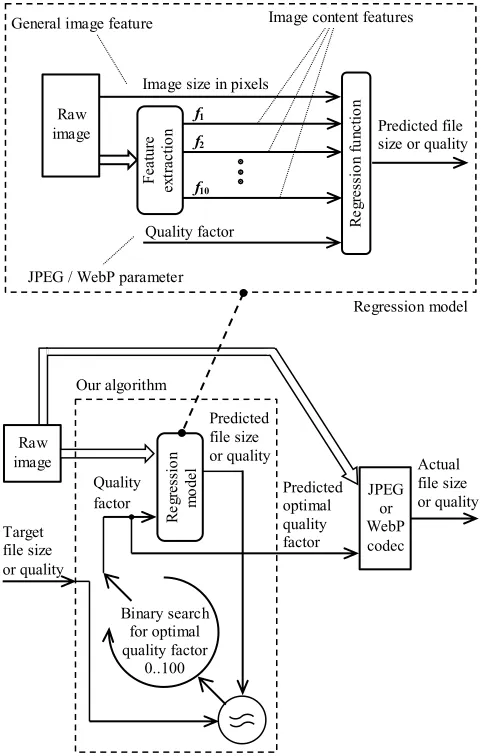
Figure 2: Sketch of our method.
3.2
Modelling
We construct our models empirically from the training data set, modelling the mapping from uncompressed input image and quality factor to either quality or file size. We do this for both libjpeg and WebP, meaning we use four models in total. As described in figure 2, the inputs to the model consist of: the image size in pixels, the quality factor used for compression and ten features extracted from the raw image as described above. In addition, all inputs to the regression models should be statistically standardized as we do not know which are the most important, so we assume that they have approximately the same influence on the result during training process. For this purpose we use z-score standardization [10, p. 524]:
standardized input value=input value−mean
standard deviation.
We employ a classic feedforward, back propogation multi-layer perceptron with one hidden multi-layer, using gradient de-scent, as described by Bishop [3]. Initially, we trained a simple linear regression model [3], but the results were poor, justifying the more complex non-linear approach. We also trained both linear regressors and MLPs with just the im-age size and quality factor as inputs, ignoring the features altogether. This approach was also unsuccessful, illustrat-ing the importance of features in the regression. The best parametrization of the model was selected using the valida-tion set, and the results reported on the testing set as is standard practice.
Once the models are trained, they can be used as a proxy to quickly search the optimization space for specified user requirement, as show in figure 2.
4.
RESULTS
We present results in terms of the accuracy of predictions, and in real-world use case scenarios where we use the mod-els to actually find optimal compression parameters. We demonstrate the technique and its universality using both JPEG and WebP formats.
A summary of the prediction error of the core regression models is presented in table 1. These models map input image and quality factor to the objective. The real-world compression results which follow all use these models.
Table 1: Mean errors of core regression functions Objective Average test set error JPEG file size 3.06% (percentage error) JPEG MSSIM 0.008 (absolute error) WebP file size 4.75% (percentage error) WebP PSNR 0.22 dB (absolute error)
4.1
JPEG
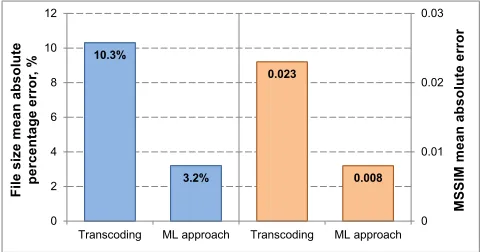
[image:3.612.344.528.546.603.2]We compare against a reimplementation of the Coulombe and Pigeon’s JPEG transcoding method [5]. This method works only for recompressing already compressed images, so we initially compress the input image with random QF 60–95 as input for their model, requiring an additional compres-sion. Nevertheless, we outperform Coulombe and Pigeon substantially in both prediction of file size, and quality as shown in figure 3.
Using our method, the file size mean absolute percentage error for the entire test set is 3.2%, which is expectedly sim-ilar to the error of the respective regression model in table 1. JPEG transcoding performed considerably worse, producing 10.3% error (fig. 3). The mean absolute error of fitting the MSSIM requirement in our method was much smaller than in JPEG transcoding: 0.008 versus 0.023.
Figure 3: Error in objectives between target and actual JPEG images
The accuracy of the model allows users to confidently ask more from the compressor while maintaining important con-straints. A potential use case might be a requirement for the minimum quality of compression not to drop below 0.94 MSSIM in more than 5% of cases. This is roughly the effect of selecting a QF of 90 forlibjpeg – a commonly used set-ting. Using our accurate predictor, we can compress more aggressively in general, moving the error distribution, while maintaining the minimum quality constraint.
[image:4.612.53.294.223.349.2]Figure 4 illustrates this on a dataset of 1000 unseen im-ages of 16 MP – a common camera phone resolution. More aggressive compression gives a mean file size of 1.94 MB per image, compared to 3.12 MB for QF 90.
Figure 4: Distributions of quality for 16 MP images
4.2
WebP
Unlikelibjpeg, WebP encoder already supports targeting quality and file size, allowing us to compare directly with the
existing implementation. Here we use PSNR as the image quality metric as that is the metric used by WebP for quality targeting. In order to increase the accuracy of prediction, WebP supports a multiple pass option, which performs par-tial recompressions to facilitate a search to fit the objective, at the cost of increased compression time.
[image:4.612.317.556.244.370.2]Figures 5 and 6 show a comparison of our approach with WebP’s pass options for compressing 4000 images of 24 MP. Our approach greatly outperforms WebP in terms of accu-racy for both quality and file size prediction, with a mean absolute error in PSNR of 0.63 dB compared to 5.36 dB, and a mean absolute percentage error of 5% compared to 109%. It is slightly slower however, due to the feature ex-traction stage. Allowing WebP four passes closes the gap significantly at the cost of longer compression time, but it is still outperformed by our technique. In an energy sensitive environment, such an increase is likely to be unacceptable.
[image:4.612.317.558.426.552.2]Figure 5: Error in file size between target and actual WebP images against time
Figure 6: Error in image quality between target and actual WebP images against time
5.
CONCLUSION
[image:4.612.58.291.541.646.2]6.
REFERENCES
[1] WebP manual, Google Developers. https:
//developers.google.com/speed/webp/docs/cwebp, December 2015.
[2] Independent JPEG group. http://www.ijg.org/, January 2016.
[3] C. M. Bishop.Neural Networks for Pattern
Recognition. Oxford University Press, Inc., New York, NY, USA, 1995.
[4] S. Chandra and C. S. Ellis. JPEG compression metric as a quality aware image transcoding. In2nd USENIX Symposium on Internet Technologies & Systems (USITS’99), 1999.
[5] S. Coulombe and S. Pigeon. Low-complexity
transcoding of JPEG images with near-optimal quality using a predictive quality factor and scaling
parameters.Image Processing, IEEE Transactions on, 19(3):712–721, 2010.
[6] K. Fant. A nonaliasing, real-time spatial transform technique.Computer Graphics and Applications, IEEE, 6(1):71–80, January 1986.
[7] ITU. Recommendation ITU-R BT.601-7. https://www.itu.int/dms pubrec/itu-r/rec/bt/ R-REC-BT.601-7-201103-I!!PDF-E.pdf, March 2011. [8] U. Javaid. Find & remove similar photos instantly.
http://www.addictivetips.com/windows-tips/ find-remove-similar-photos-instantly, June 2010. [9] A. Lewis, S. Ghosh, and N.-F. Tzeng. Run-time
energy consumption estimation based on workload in server systems. InProceedings of the 2008 Conference on Power Aware Computing and Systems,
HotPower’08, pages 4–4, Berkeley, CA, USA, 2008. USENIX Association.
[10] T. Little.The Oxford Handbook of Quantitative Methods, Vol. 2: Statistical Analysis. Oxford Library of Psychology. Oxford University Press, 2013. [11] H. Louafi, S. Coulombe, and U. Chandra. Efficient
near-optimal dynamic content adaptation applied to JPEG slides presentations in mobile web conferencing. InAdvanced Information Networking and Applications (AINA), 2013 IEEE 27th International Conference on, pages 724–731, March 2013.
[12] L. Marchesotti, F. Perronnin, D. Larlus, and G. Csurka. Assessing the aesthetic quality of photographs using generic image descriptors. In
Computer Vision (ICCV), 2011 IEEE International Conference on, pages 1784–1791, Nov 2011.
[13] M. Montgomery. Next generation video: Introducing daala part 3. https://people.xiph.org/˜xiphmont/ demo/daala/demo3.shtml, August 2013.
[14] S. Pigeon and S. Coulombe. Computationally efficient algorithms for predicting the file size of JPEG images subject to changes of quality factor and scaling. In
Communications, 2008 24th Biennial Symposium on, pages 378–382, June 2008.
[15] S. Pigeon and S. Coulombe. Efficient clustering-based algorithm for predicting file size and structural similarity of transcoded JPEG images. InMultimedia (ISM), 2011 IEEE International Symposium on, pages 137–142, Dec 2011.
[16] S. Pigeon and S. Coulombe. Optimal quality-aware predictor-based adaptation of multimedia messages. In
Intelligent Data Acquisition and Advanced Computing Systems (IDAACS), 2011 IEEE 6th International Conference on, volume 1, pages 496–499, Sept 2011. [17] S. Pigeon and S. Coulombe. K-means based prediction
of transcoded JPEG file size and structural similarity.
International Journal of Multimedia Data Engineering and Management (IJMDEM), 3(2):41–57, 2012. [18] S. Pigeon and S. Coulombe. Quality-aware
predictor-based adaptation of still images for the multimedia messaging service.Multimedia tools and applications, 72(2):1841–1865, 2014.
[19] H. Tong, M. Li, H. Zhang, and C. Zhang. Blur detection for digital images using wavelet transform. InMultimedia and Expo, 2004. ICME ’04. 2004 IEEE International Conference on, volume 1, pages 17–20 Vol.1, June 2004.
[20] P. Viola and M. Jones. Rapid object detection using a boosted cascade of simple features. InComputer Vision and Pattern Recognition, 2001. CVPR 2001. Proceedings of the 2001 IEEE Computer Society Conference on, volume 1, pages I–511–I–518 vol.1, 2001.