Preprint typeset using LATEX style AASTeX6 v. 1.0
NON-BLACKBODY DISKS CAN HELP EXPLAIN INFERRED AGN ACCRETION DISK SIZES
Patrick B. Hall, Ghassan T. Sarrouh
Department of Physics and Astronomy, York University, Toronto, ON M3J 1P3, Canada
Keith Horne
SUPA Physics and Astronomy, University of St. Andrews, North Haugh, St. Andrews KY16 9SS, Scotland, UK
ABSTRACT
If the atmospheric densityρatmin the accretion disk of an active galactic nucleus (AGN) is sufficiently low, scattering in the atmosphere can produce a non-blackbody emergent spectrum. For the same bolometric luminosity, at ultraviolet and optical wavelengths such disks have lower fluxes and appar-ently larger sizes as compared to disks that emit as blackbodies. We show that models with ρatm a sufficiently low fixed fraction ofthe interior densityρcan match the AGN STORM observations of NGC 5548, but produce disk spectral energy distributions (SEDs) that peak at shorter wavelengths than observedin luminous AGN in general. Thus, scattering atmospheres can contribute to the explanation for large inferred AGN accretion disk sizes, but are unlikely to be the only contributor. In an appendix we present unified equations for the interior ρ and T in gas pressure dominated regions of a thin accretion disk.
Keywords:accretion, accretion disks — galaxies: active — galaxies: individual (NGC 5548) — quasars: general
1. INTRODUCTION
The AGN STORM project has measured the wavelength-dependent time delays with which the accretion disk of NGC 5548 reverberates in response to emission from very close to the black hole (Edelson et al. 2015). The delays scale approximately as tdelay(λ) ∝ λ (Fausnaugh et al. 2016, hereafter F16). This result has been interpreted as evidence for a disk that emits as a blackbody with a surface temperature profile TS(r)∝r−1 (Starkey et al. 2017), since tdelay ∝ r/c and the peak wavelength of a blackbody spectrum follows λ ∝ T−1. In contrast, a blackbody disk that releases locally the energy generated by viscous dissipation has a slower decrease of TS toward larger radii,TS(r)∝r−3/4 (Shakura & Sunyaev 1973, SS73;Novikov & Thorne 1973, NT73). A blackbody disk thus hastdelay(λ)∝λ4/3; compared to NGC 5548, its time delays would drop more quickly toward shorter wavelengths.
Furthermore, the lags in NGC 5548 imply a disk ≃3 times larger than expected for a standard thin disk with
L/LEdd ∼ 0.1 (F16). AGN accretion disks with radii 2× or more larger than expected were first inferred from microlensing observations of quasars (e.g., Eigenbrod et al. 2008; Morgan et al. 2010; Blackburne et al. 2011, 2015). Larger than expected sizes have also been deduced from photometric variability of quasars in Pan-STARRS (Jiang et al. 2016b) and DES (Mudd et al. 2017). Proposed explanations for this discrepancy (see §4 of Hall et al. 2014) include an inhomogeneous disk with a range of temperatures at each radius (Dexter & Agol 2011; see also Cai et al. 2017), a long timescale for the disk to respond to changing illumination (Gardner & Done 2017), and an increase in the mean measured lag due to reverberation from diffuse gas at large scales (Cackett et al. 2017).
Here we explore another mechanism that can help explain the above observations: a disk that deviates from a blackbody such that as the radius decreasesλpeak shifts to an increasingly shorter wavelength than for a blackbody of the same total flux. Electron scattering in the disk atmosphere of photons generated by free-free emission within the disk can produce an emergent spectrum with just such a shift (§2). As originally discussed in NT73 §5.10 and SS73 §3a, free-free emission produces shorter-wavelength photons deeper in the disk. If scattering is non-negligible in the disk atmosphere, such photons are less likely to escape; the emergent spectrum becomes non-blackbody(e.g.,
scattering becomes sufficiently dominant (e.g., at low atmospheric densities), the peak of the spectrum shifts to shorter wavelengths and disks appear larger at a given wavelength than in the blackbody case (e.g., Rauch & Blandford 1991). A small spectral shift in this direction (of insufficient magnitude to match observations) can occur in the emission from disk regions where electron scattering dominates (§5.10 of NT73 and §3a of SS73). A further shift in this direction (still of insufficient magnitude to match observations) has been seen in previous work on disks with significant magnetic pressure support and thus low-density atmospheres (e.g., Blaes et al. 2006). This proposed explanation for large inferred accretion disk sizes is related to that of Abolmasov (2017), but distinct in that the electron scattering occurs in an accreting inflow in that work and in the disk atmosphere in this model. We explore in§3 what model parameters can produce a shift of the magnitude required to match the observations of NGC 5548 and discuss our results in§4.
2. TWO NON-BLACKBODY SPECTRAL MODELS
To examine how the spectrum from a disk with a scattering atmosphere varies with radius when gas pressure dominates, we consider two atmospheric density distributions: constant and exponential. In both cases we assume the atmospheres to be isothermal with height.
2.1. Constant-density Atmosphere
For the form of the emergent specific fluxFν(r), we adopt the modified blackbody spectrum appropriate for isotropic scattering in a homogeneous medium (Rybicki & Lightman 1986; Equation 7 of Kawaguchi et al. 2004):
Fν(r) = 2πBν(TS(r)) 1 +p
1 +κes/κν,abs(r) (1)
where we useTSto denote a characteristic disk surface temperature and whereκesandκν,absare the electron-scattering opacity and the frequency-dependent absorption opacity, respectively. The factor of π comes from integrating the (assumed isotropic) emergent specific intensity over all solid angles.
The value ofTS(r)is found by requiring local energy release. At each radius, the flux emitted over all wavelengths must equal the rate at which energy is generated per unit surface area: R
Fν(r)dν =D(r) where D(r) is given by Eq. A1. For κν,abs ≫ κes, which occurs at sufficiently high densities or sufficiently low temperatures,Fν =πBν(TS) andTS(r) = (D(r)/σsb)1/4. Forκν,abs→0, which occurs at sufficiently low densities or sufficiently high temperatures,Fν →2πBν(TS)p
κν,abs/κes, which can deviate strongly from a blackbody spectrum.
2.2. Exponential Atmosphere
Zel’dovich & Shakura(1969, ZS69) derive the expression for the specific flux emerging from a semi-infinite isothermal scattering atmosphere with an exponential density distributionρ(z) =ρ1e−(z−z1)/h1 whereh1is the atmospheric scale height andz1is the height, above the disk plane, of theedgeof the atmosphere. We takeh1=r3kBTS/GM µphwhere
h= (kBT r3/GM µp)1/2 is the disk scale height (see the text following Eq. 2.28 in SS73). Thus, we have
h1=
kBT2
Sr3 GM µpT
1/2 =hTS
T . (2)
We define
kν,1≡3κesκν,abs1h21/ρ1 (3)
which is independent of density becauseκν,abs1, the absorption opacity at the edge of the atmosphere, is proportional to the local densityρ1(see§2.3). We can then write the emergent specific flux from this exponential atmosphere as
Eν(r) = πBν(TS(r)) 1 + 3κesh1ℵ1/2k1ν,/13
(4)
(Eq. A1.9 of ZS69, divided by 2 so thatEν →πBν when electron scattering is unimportant; seeRybicki & Lightman 1986). In that equation, we define
ℵ1≡
K1/3(23k 1/2
ν,1ρ 3/2 1 )
kν,1/16ρ11/2K2/3(23k 1/2
ν,1ρ 3/2 1 )
>0 (5)
In the limitkν,1/12ρ 3/2
1 → ∞,ℵ1 →0 andEν →πBν. In the limitρ1= 0, ℵ1≃70/51 to<1% accuracy and we can use the definition ofkν,1 to write the limiting form ofEν as
Eν ≃πBν 102k
1/3
ν,1 210κesh1
≃πBν 17k
1/3
ν,1 35κesh1
≃
512κ
esκν,abs1h21 35ρ1κ3esh31
1/3
πBν≃
51κν,abs 1 35ρ1κ2esh1
1/3
πBν(TS(r)) (6)
which as expected is a factor of≃21/3 lower than given at the end of Appendix 1 of ZS69.
2.3. Parameter Dependences
The non-blackbody frequency dependence of the spectrum emerging from the above atmospheres arises from the frequency dependence of the absorption opacity. We assume κν,abs is given by the sum of free-free and bound-free absorption opacities and we approximate them as having the same frequency dependence (Meier 2012, §9.3.6.2). Definingx≡hν/kTS, the specific absorption opacity can then be written
κν,abs=κbf+ff=κ′∗fρT
−7/2
S x
−3(1−e−x) (7)
with
κ′
∗f= (3.68×1022 cm2 g−1 (g cm−3)−1 K7/2)[X+Y + 1180Zf(T)](1 +X) (8)
where the H, He, and metal mass fractions areX = 0.71, Y = 0.27, and Z = 0.02 for solar metallicity (Meier 2012,
§9.3), and f(T) is the fraction of metals that are not ionized (1 for neutral gas and 0 for fully ionized gas). The free-free opacity is dominated by electrons from H and He, while the bound-free opacity is dominated by electrons bound to metals. We takef(T) = 0.5, which yieldsκ′
∗f= 8.04×1023cm2g−1 with the above mass fractions.
We also adopt κes = 0.2(1 +X) cm2 g−1 (Meier 2012, §9.3.6.1); more metal-rich gas with a lower X has fewer electrons per gram and therefore a lower electron scattering opacity.
We can now write out the full parameter dependencies of the specific fluxFν(r) emergent from a constant-density atmosphere, again usingx≡hν/kTS for convenience:
Fν(r) = (4k
3
B/c2h2)[x3/(ex−1)]TS3
1 + q
1 + 0.2x3T7/2
S /κ′∗fρ(1−e−x)[X+Y + 1180Zf(T)]
(9)
where the (1 +X) dependencies in κes andκ′∗f have canceled out in the denominator.
The parameter dependencies of the specific flux Eν(r) emergent from an exponential atmosphere can be written explicitly only in the low-density limit. That limit may not always apply, so we do not give the explicit form here.
In calculatingρandT as part of determiningEν(r) orFν(r), we adopt a mean mass per particle of
µp= mp
2X+ 0.75Y +Z[0.56−0.5f(T)] (10)
(Meier 2012, §9.3.1.1) where mp is the proton mass. That expression is appropriate for gas which is completely ionized in H and He but in which metals range from neutral to fully ionized. For the parameters given above,
µp= 0.614mp.
2.4. CalculatingTS, the emergent spectrum,and mean measured radii
The emergent Fν from a disk atmosphere depends on the opacity and thus the density in the atmosphere, which will be lower than the average interior density. We adopt an atmospheric densityρatm(r) which is a constant fraction of the interior density ρ(r). To find Fν(r) or Eν(r) thus requires knowing the gas density ρ(r), which for gas pressure dominated regions of an AGN accretion disk requires knowing the disk interior temperature
T(r). In such regions we use the analytic expressions for T(r) and ρ(r) derived in the Appendix. For radiation pressure dominated disk regions, we calculate ρ(r) and T(r)using Eq. 2.11 and 2.12 of SS73, respectively.1 The transition between these two regions is the radius at which they yield equal values of ρ(r). We adopt radiation-pressure dominated values of ρ(r) and T(r) interior to that radius, and gas-pressure dominated values exterior to that radius.
Once a value for the atmospheric densityρatm(r)as a fraction of ρ(r) is adopted, the characteristic disk surface temperatureTS(r) is determined iteratively by requiringR
Fν(ρatm(r), TS(r))dν =D(r) for a constant-density
atmosphere, or R
Eν(ρatm(r), TS(r))dν =D(r) for an exponential-density atmosphere. Once TS(r) is known, the emergent spectrum as a function of ν is calculated as the area-weighted integral of Fν or Eν over the disk. We present results for a range of atmospheric densities for both non-blackbody spectral models considered.
For comparison with microlensing and reverberation mapping observations, we assume a face-on disk and calculate the flux-weighted and response-function-weighted (Cackett et al. 2007) mean radii, respectively:
rf(λ) = Rr=∞
r=rinr Xλ(r)r dr Rr=∞
r=rinXλ(r)r dr
and rr(λ) = Rr=∞
r=rinr ψλ(r)r dr Rr=∞
r=rinψλ(r)r dr
(11)
where Xλ(r) = Bλ(r) for a standard disk, Fλ(r) for a constant-density scattering atmosphere (§2.1), and Eλ(r) for an exponential scattering atmosphere (§2.2), and ψλ(r) is the response function (for a derivation, see Horne et al. in preparation). We assume instantaneous thermalization and re-emission of incident illumination. We refer to these wavelength-dependent radii collectively as r(λ) and express them in light-days for comparison with time lag observations; the mean time lag is insensitive to disk inclination (Fig. 1 ofStarkey et al. 2017).
3. COMPARISON TO NGC 5548 OBSERVATIONS
To compare with the observations of NGC 5548, we adopt a cosmology with ΩM = 0.28, ΩΛ= 0.72, andH0 = 70 km s−1 Mpc−1 (Komatsu et al. 2011), which yields a luminosity distance of 74.5 Mpc at its redshift of z= 0.017175 (De Rosa et al. 2015). We model a disk with viscosity parameter α= 0.1 around a non-rotating black hole of mass
M = (6.66±2.17)×107M
⊙ (Pei et al. 2017). The Schwarzschild radius isRSch= 1.97×1013 cm = 657 light-seconds and the Eddington limit isLEdd= 4πGM µec/σT = 9.79×1045erg s−1, whereµe= 2mp/(1 +X) is the mean mass per electron. The corresponding Eddington mass accretion limit is ˙MEdd =LEdd/(0.1η0.1c2) = 9.39η−0.11×1025 g s−1; for our non-rotating black hole withrin= 3RSch, we adopt the appropriate nonrelativistic value ofη0.1= 5/6 (Frank et al. 2002). NGC 5548 has bolometric luminosity≃1044.83 erg s−1 (Woo & Urry 2002) and so we adoptL/L
Edd= 0.069. We calculate Xλ(r) for 3 < r/RSch < 4000 for a range of atmospheric densities from log(ρatm/ρ) = 0 to −5 for both scattering atmosphere models, and then calculate r(λ) for each. The transition between radiation- and gas-pressure dominated regions occurs at r ≃223RSch, as compared to r ≃237RSch predicted by SS73 Eq. 2.17 or NT73 Eq. 5.9.9 for the NGC 5548 parameters adopted in this section. The difference arises because the values of T(r) and ρ(r) in gas-pressure dominated regions differ slightly from what is assumed in the approximations used in deriving those equations (see the end of the Appendix).
In Figure1, for comparison with Figure 5 of F16, we plot the wavelength-dependent relative disk reverberation time lag, estimated from the response-function-weighted mean radiir(λ)−r(1367 ˚A) (solid lines) for blackbody disks (black) and scattering-atmosphere disks with constant density (red) and exponential density (cyan), all withL= 0.069LEdd. At ρatm/ρ= 0, the relative time lags lie above the blackbody disk value at 1000 ˚A .λ. 6000 ˚A, and below it at other wavelengths. Asρatm/ρdecreases, the relative time lags decrease further at λ. 1000 ˚
A and increase at longer wavelengths until they are above the blackbody disk values at all wavelengths plotted (last three panels). As expected from §2, at sufficiently low ρatm the time lags at each radius approach limiting values for an exponential-density atmosphere and continue to increase for a constant-density atmosphere.
The dotted lines in Figure1 show results for flux-weighted mean radii, to illustrate the relative disk sizes expected in microlensing observations. Such radii are smaller than response-function-weighted radii because the latter give high weight to radii which have not reached the Rayleigh-Jeans limit at a given λ.
Scattering atmospheres with sufficiently low relative densities can explain the observed wavelength-dependent rever-beration signal in NGC 5548. For response-function-weighted radii withlog(ρatm/ρ)=−4, for an exponential-density atmosphere we find rr(λ) ∝ λ1.14±0.02, and for a constant-density atmosphere we find rr(λ) ∝
λ1.00±0.02 at 1000< λ <4000˚A and rr(λ)∝λ0.82±0.02 at λ >4000˚A.
In Figure 2, we plot the flux density fν vs. ν from an annulus at 60 RSch, to illustrate how the emergent spec-trum changes with ρatm/ρ for both scattering atmosphere models. The middle right panel includes color-corrected blackbody curves with peak wavelengths matching both models. Because both models have more flux at short and long wavelengths than the matching color-corrected blackbody curves, modeling disk emission with the latter (e.g., Davis et al. 2006;Done et al. 2012) will not fully reproduce emission from these scattering atmosphere models.
from a sum of blackbodies, as seen in Figure 5.10.1 of NT73 and Figure 3 of SS73. However, this deviation is due almost entirely to emission from radii r <20RSch. The differences are small at larger radii; as an example, the SED from r >60RSch is shown in panel 1.
For objects where such SEDs conflict with observations, winds from the disk may reduce ˙M at small radii and thus the luminosity from the inner disk, preventing the SED from peaking at too short a wavelength (Slone & Netzer 2012; Laor & Davis 2014; see alsoProga 2005). Alternatively, at small radii the disk may transition to a thick torus whose emission peaks in the far or extreme ultraviolet (e.g., §2 of Gardner & Done 2017). As a purely illustrative limiting case of the above, in the right panel of Figure 3 and the lower left panel of Figure4we show SEDs for models with log(ρatm/ρ) =−4 but from disk radii r >60RSch only (r >11 light-hours). These SEDs show the relative fluxes of the inner and outer disks at those wavelengths. As shown in Figure
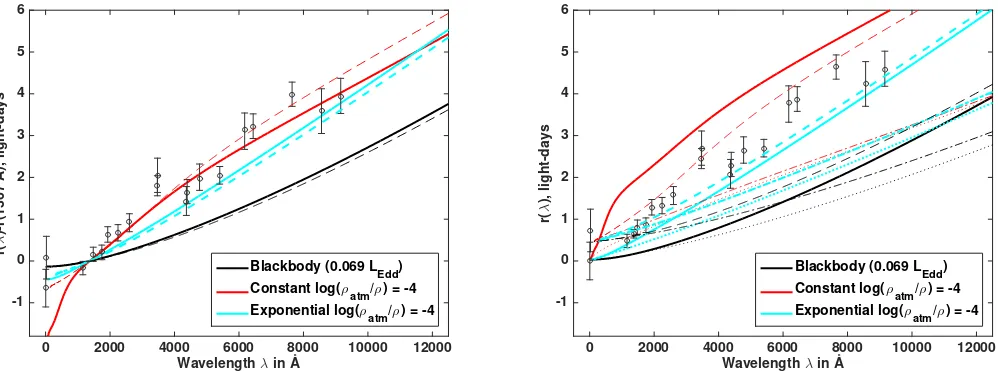
7 (left panel), our model’s predicted mean relative disk reverberation time lags at λ >1367AA (solid lines) are not greatly changed if the emission from r < 60RSch is excluded (dashed lines). Absolute time lag predictions, in contrast, are strongly dependent on the UV emission properties of the inner disk. Figure 7 (right panel) shows that our model’s predicted mean absolute disk reverberation time
lags with emission from r <60RSch excluded (dashed lines) are closer to the AGNSTORM observations of NGC 5548 than our model’s predictions including the full disk (solid lines). Thus, models which suppress optical/UV emission disk from radiir <60RSch to better fit the constraints of observed AGN SEDs may be able to simultaneously match inferred relative and absolute disk sizes.
4. DISCUSSION
If the atmospheric density in an AGN accretion disk is sufficiently low, scattering in the atmosphere can produce a non-blackbody emergent spectrum. Disks with these scattering atmospheres have lower brightness temperatures and higher colour temperatures at ultraviolet and optical wavelengths than the blackbody temperature of a disk of the same bolometric luminosity; thus, they can in principle reconcile disk theory sizes and flux sizes with microlensing sizes (see, e.g.,§1 ofHall et al. 2014).
The AGN STORM observations of NGC 5548 are in many — but not all — aspects consistent with a disk with a constant-density scattering atmosphere with density ρatm = 10−4ρ. In particular, although the observed optical-UV-X-ray SED of NGC 5548 is not well matched by that model (Figure 4), the observed optical-UV flux from NGC 5548 is lower than in all models at our adopted Eddington ratio of
L= 0.069LEdd (Figure3). That Eddington ratio is based on the bolometric luminosity fromWoo & Urry (2002), which was found by summing multiwavelength flux values for NGC 5548 from the literature. Contamination of flux measurements by the host galaxy, particularly at infrared wavelengths, could mean that the true Eddington ratio is lower than we have assumed, which would help explain the lower optical-UV flux level (e.g., Gardner & Done (2017) adopt L= 0.040LEdd).
As a consistency check, we note that the physical density corresponding toρatm= 10−4ρ in our NGC 5548 disk models is 10−10-10−14 g cm−3 at 4-4000 R
Sch from the black hole, with a minimum at 8.5
RSch. The vertical length scale corresponding to τes = 1 at such densities is hes=1010-1014 cm. The atmospheric scale height/radius ratio hes/r peaks at 0.18 at 8.5 RSch and has a value hes/r < 10−2 at 40< r/RSch <4000. A self-consistent atmosphere model must have hes/r ≪1, so our constant-density model results at r < 40RSch should be treated with caution. For an exponential atmosphere with
ρatm= 10−4ρ and scale height h1 (Eq.2), we find at all radii thath1/r.6×10−5, so h1< hes. Thus, the semi-infinite exponential atmosphere model we use (§2.2) is a reasonable approximation. Compared to an infinite exponential atmosphere, it neglects a region of optical depth only τ=κesρatmh1<1.
We can compare ourlog(ρatm/ρ)=−4model predictions to the results of microlensing observations. For flux-weighted radii withlog(ρatm/ρ)=−4, for an exponential-density atmosphere we findrf(λ)∝λ1.09±0.02, and for a constant-density atmosphere we findrr(λ)∝λ0.84±0.02. In the Einstein CrossEigenbrod et al. (2008) found flux-weighted radii rf ∝ λ1.2±0.3. In the quasar HE 1104−1805 Blackburne et al. (2015) found rf ∝ λ1.0(+0.3,−0.56) and a size larger than expected by a factor of 4 at 1900 ˚A, as compared to our prediction of a factor ∼3 (Figure 5). In a sample of 11 quasars, Blackburne et al. (2011) found
rf ∝ λ0.17±0.15 and a size larger than expected by a factor of 10+7
−5 at 1736 ˚A, as compared to our prediction of a factor ∼3. The results from first two studies above are reasonably consistent with both the theoretical prediction of rf ∝ λ4/3 and with our model results; see Hall et al. (2014) for further discussion of the Blackburne et al. (2015) results.
mechanism must support the low-density atmosphere above the disk; magnetic pressure support is an obvious pos-sibility. Blaes et al.(2006) have shown that accounting for magnetic pressure yields a more extended accretion disk atmosphere which shifts the emergent SED in a similar manner to our Figure4; see alsoBegelman & Pringle(2007), Davis et al.(2009), andTao & Blaes(2013). Such studies found photospheric densities ofρatm ≃10−3ρ(Figure 6 of Blaes et al. 2006) andρatm ≃2×10⁻³ρ(Figure 3 of Davis et al. 2009) in disks around stellar-mass black holes. It remains to be seen if disks around supermassive black holes can reach the lower atmospheric densities required for scattering atmospheres to explain large apparent AGN disk sizes.
The models discussed here predict that scattering atmospheres of different densities will yield different apparent disk sizes andtdelay(λ)∝λx slopesx. In addition, at low atmospheric densities these models predict sizes relative to blackbody disks which have maxima atλ.1000 ˚A and decrease towards approximately unity at longer wavelengths (Figure 5). Overall, disk sizes are predicted to be more anomalous in the ultraviolet than in the optical, and response-function-weighted radii to be more discrepant from their corresponding blackbody values than flux-weighted radii. However, we have not accounted for specific features in the bound-free opacity such as the temperature-dependent iron opacity bump (seeJiang et al. 2016aand references therein) or the Balmer and Paschen edges. In particular, if the disk atmospheres contain sufficient HI, disk sizes and time lags at the wavelengths of HI
edges may differ noticeably from our predictions. It remains to be seen whether or not such an effect can explain the discrepantU-band lags noted in F16.
If scattering atmospheres are important in AGN disks, dependences of the scattering atmosphere properties on AGN parameters such as M and ˙M may help explain why SDSS quasars do not show the expected trends of continuum color or emission line properties with such parameters (Bonning et al. 2007,2013).
The models discussed here do not by themselves match all AGN observations. They produce SEDs that peak at shorter wavelengths than observed in many AGN.While the models can show a non-zero lag between X-ray and ultraviolet emission (e.g., Figure1forlog(ρatm/ρ) =−4), as seen in NGC 2617 (Shappee et al. 2014) and NGC 4151 (Edelson et al. 2017), the slow increase in the lag from ultraviolet to optical wavelengths in those objects is not reproduced. A disk that transitions at small radii to a torus emitting at extreme ultraviolet wavelengths (e.g.,Gardner & Done 2017;Edelson et al. 2017) may alleviate these problems.
We thank the referee and B. Czerny, C. Done, C. Knigge, J. Matthews, H. Netzer, and D. Starkey for discussions. PH and GS acknowledge the support of the Natural Sciences and Engineering Research Council of Canada (NSERC), funding reference number 2017-05983. KH acknowledges support from STFC grant ST/M001296/1.
Software:
MATLABAPPENDIX
A. DENSITY AND TEMPERATURE IN GAS PRESSURE DOMINATED REGIONS OF AN ACCRETION DISK
We desire equations forρandT in regions of an accretion disk whereP =Pgasandκ=κes+κbf+ff. For comparison with SS73, we use cgs units and neglect general relativistic corrections.
We will requireD(r), the rate at which mechanical energy is transformed into heat energy per unit surface area over both sides of the disk. FollowingFrank et al.(2002), we write
D(r) =3GM M˙ 8πr3
1−
r
rin r
= 3GM M˙
8πr3 f(r). (A1)
whereM is the black hole mass, ˙M is the mass accretion rate, andf(r) involves the innermost disk radiusrin. To findρ, we begin with the radiative energy transport equation σsbT4 =κΣF (NT73 Eq. 5.8.1c) where T is the interior disk temperature,κ=κes+κbf+ff is the opacity, Σ is the mass surface density, and F(r) is the total surface flux emitted at r. We take κbf+ff =κ∗′fρT−7/2 so that κ∗′f has units of cm2 g−1 (g cm−3)−1 K7/2. We assume that energy released is radiated locally, so thatF(r) =D(r). Substituting in forκ, Σ = 2ρh, and F(r) =D(r),
σsbT4= (κes+κ′∗fρT−7/2)×2ρh×(3GM M f˙ (r)/8πr3). (A2)
The above is a quadratic equation for ρ. We substitute for the disk half-thickness h = (P r3/ρGM)1/2 (NT73 Eq. 5.8.1a) rewritten using P =ρkBT /µp as h= (kBT r3/GM µp)1/2, where µp is the mean mass per particle in grams. The quadratic equation and its solution are:
aqρ2+bqρ+cq= 0 with aq =κ′
Wavelength λ in Å
0 2000 4000 6000 8000 10000 12000
r(
λ
)-r(1367 Å), light-days
-1 0 1 2 3 4 5 6
Blackbody (0.069 L
Edd)
Constant log(ρatm/ρ) = -0
Exponential log(ρatm/ρ) = -0
Wavelength λ in Å
0 2000 4000 6000 8000 10000 12000
r(
λ
)-r(1367 Å), light-days
-1 0 1 2 3 4 5 6
Blackbody (0.069 L
Edd)
Constant log(ρatm/ρ) = -1
Exponential log(ρatm/ρ) = -1
Wavelength λ in Å
0 2000 4000 6000 8000 10000 12000
r(
λ
)-r(1367 Å), light-days
-1 0 1 2 3 4 5 6
Blackbody (0.069 LEdd) Constant log(ρatm/ρ) = -2
Exponential log(ρatm/ρ) = -2
Wavelength λ in Å
0 2000 4000 6000 8000 10000 12000
r(
λ
)-r(1367 Å), light-days
-1 0 1 2 3 4 5 6
Blackbody (0.069 LEdd) Constant log(ρatm/ρ) = -3
Exponential log(ρatm/ρ) = -3
Wavelength λ in Å
0 2000 4000 6000 8000 10000 12000
r(
λ
)-r(1367 Å), light-days
-1 0 1 2 3 4 5 6
Blackbody (0.069 L
Edd)
Constant log(ρatm/ρ) = -4
Exponential log(ρatm/ρ) = -4
Wavelength λ in Å
0 2000 4000 6000 8000 10000 12000
r(
λ
)-r(1367 Å), light-days
-1 0 1 2 3 4 5 6
Blackbody (0.069 L
Edd)
Constant log(ρatm/ρ) = -5
[image:7.612.71.570.79.660.2]Exponential log(ρatm/ρ) = -5
Figure 1. The wavelength-dependent relative disk reverberation time lag estimated from the response-function-weighted mean radiusr(λ)−r(1367 ˚A) (solid lines), overplotted on the wavelength-dependent time lag data for NGC 5548 (points and error
bars, from F16; note that theU-band points just shortward of 4000 ˚A are known to be discrepant). Dotted lines show results for flux-weighted mean radii, to illustrate the relative disk sizes expected in microlensing observations. We plot curves for blackbody disks (black) and scattering-atmosphere disks with constant density (red) and exponential density (cyan), all with
L = 0.069LEdd. The density of the scattering atmosphere relative to the average interior density is log(ρatm/ρ) = 0 and−1
(top),−2 and−3 (middle), and−4 and−5 (bottom). Atρatm/ρ= 0, the relative time lags lie above the blackbody
Frequency ν in Hz ×1015
1 2 3 4 5 6 7 8 9 10
fν (arbitrary scaling) 0 0.1 0.2 0.3 0.4 0.5 0.6 0.7 0.8 0.9 1
Blackbody (0.069 LEdd), TS=1.67e+04 K Const. log(ρatm/ρ) = -0, TS=2.00e+04 K
Exp. log(ρatm/ρ) = -0, TS=2.37e+04 K
Frequency ν in Hz ×1015
1 2 3 4 5 6 7 8 9 10
fν (arbitrary scaling) 0 0.1 0.2 0.3 0.4 0.5 0.6 0.7 0.8 0.9 1
Blackbody (0.069 LEdd), TS=1.67e+04 K Const. log(ρatm/ρ) = -1, TS=2.69e+04 K
Exp. log(ρatm/ρ) = -1, TS=3.27e+04 K
Frequency ν in Hz ×1015
1 2 3 4 5 6 7 8 9 10
fν (arbitrary scaling) 0 0.1 0.2 0.3 0.4 0.5 0.6 0.7 0.8 0.9 1
Blackbody (0.069 L
Edd), TS=1.67e+04 K
Const. log(ρatm/ρ) = -2, TS=4.17e+04 K
Exp. log(ρatm/ρ) = -2, TS=4.17e+04 K
Frequency ν in Hz ×1015
1 2 3 4 5 6 7 8 9 10
fν (arbitrary scaling) 0 0.1 0.2 0.3 0.4 0.5 0.6 0.7 0.8 0.9 1
Blackbody (0.069 L
Edd), TS=1.67e+04 K
Const. log(ρatm/ρ) = -3, TS=6.87e+04 K
Exp. log(ρatm/ρ) = -3, TS=4.40e+04 K
Frequency ν in Hz ×1015
1 2 3 4 5 6 7 8 9 10
fν (arbitrary scaling) 0 0.1 0.2 0.3 0.4 0.5 0.6 0.7 0.8 0.9 1
Blackbody (0.069 LEdd), TS=1.67e+04 K Const. log(ρatm/ρ) = -4, TS=1.14e+05 K
Exp. log(ρatm/ρ) = -4, TS=4.43e+04 K
Frequency ν in Hz ×1015
1 2 3 4 5 6 7 8 9 10
fν (arbitrary scaling) 0 0.1 0.2 0.3 0.4 0.5 0.6 0.7 0.8 0.9 1
Blackbody (0.069 LEdd), TS=1.67e+04 K Const. log(ρatm/ρ) = -5, TS=1.91e+05 K
[image:8.612.64.576.78.660.2]Exp. log(ρatm/ρ) = -5, TS=4.43e+04 K
Figure 2. Flux densityfνfrom an annulus at60RSchin a disk withL= 0.069LEddaround NGC 5548. Panel layout and color
key are as in Figure1. The middle right panel includes color-corrected blackbody curves with the same peak wavelengths as the constant-density and exponential models (dashed red-black with TS = 3.07e+04 K and dashed cyan-black with
Wavelength λ in Å
103 104
fν
(
λ
) (mJy)
100 101
Blackbody (0.069 L
Edd)
Constant log(ρatm/ρ) = -4
Exponential log(ρatm/ρ) = -4
Wavelength λ in Å
103 104
fν
(
λ
) (mJy)
100 101
Blackbody (0.069 L
Edd)
Constant log(ρatm/ρ) = -4
[image:9.612.68.567.70.261.2]Exponential log(ρatm/ρ) = -4
Figure 3. In comparison to the average observedfν values from Figure 11 ofStarkey et al.(2017), we plot the predicted flux density from face-on accretion disks withL= 0.069LEdd and log(ρatm/ρ) =−4 in NGC 5548, with the same color key as Figure
1. The left panel showsfνfrom the entire disk; the right showsfν fromr >60RSch(r >11 light-hours) only.
ρ= κesT 7/2
2κ′ ∗f
"
−1 +
s
1 + 16πκ
′
∗fσsb(µp/kB)1/2 3κ2
es(GM/r3)1/2M f˙ (r) #
(A4)
To findT, we use two expressions for the vertically integrated shear stress, W = 2hαP = 2hαρkBT /µp (NT73 Eqs. 5.7.5d and 5.8.1b) andW = [f(r) ˙M(GM/r3)1/2]/2π(NT73 Eq. 5.6.14a), to find a second equation relatingρandT:
ρ= f(r) ˙M(GM/r 3)
4πα(kBT /µp)3/2. (A5)
Equating Eqs.A4andA5and solving forT, we find:
T =
κ′
∗ff(r) ˙M(GM/r3) 2πκesα(kB/µp)3/2
−1 +
s
1 + 16πκ
′
∗fσsb(µp/kB)1/2 3κ2
es(GM/r3)1/2M f˙ (r) !−1
1/5
(A6)
We have verified that these expressions have the correct numerical coefficients and dependencies onr,M, ˙M, and
αin the limits κ′
∗f ≪κes and κ′∗f ≫κes. The limiting solutions are approached slowly; e.g., the disk T is higher at large radii (SS73 region c) than predicted by the limiting solution becauseT has a steeper radial dependence in region b than in region c, resulting in the limitingT in region c being approached from above.
In disk regions whereP =Prad+Pgas and κ=κes, we searched for analytic solutions forρandT but found only implicit equations.
REFERENCES
Abolmasov, P. 2017, A&A, 600, A79
Begelman, M. C., & Pringle, J. E. 2007, MNRAS, 375, 1070 Blackburne, J. A., Pooley, D., Rappaport, S. & Schechter, P. L.
2011, ApJ, 798, 95
Blackburne, J. A., Kochanek, C. S., Chen, B., Dai, X., & Chartas, G. 2015, ApJ, 798, 95
Blaes, O. M., Davis, S. W., Hirose, S., Krolik, J. H., & Stone, J. M. 2006, ApJ, 645, 1402
Bonning, E. W., Cheng, L., Shields, G. A., Salviander, S., & Gebhardt, K. 2007, ApJ, 659, 211
Bonning, E. W., Shields, G. A., Stevens, A. C., & Salviander, S. 2013, ApJ, 770, 30
Cackett, E. M., Horne, K., & Winkler, H. 2007, MNRAS, 380, 669
Cackett, E. M., Chiang, C.-Y., McHardy, I., et al. 2017, ArXiv e-prints, arXiv:1712.04025
Cai, Z. Y., Wang, J.-X., Zhu, F.-F., et al. 2017, ArXiv e-prints, arXiv:1711.06266
Czerny, B., & Elvis, J. E. 1987, ApJ, 321, 305
Davis, S. W., Blaes, O. M., Hirose, S., & Krolik, J. H. 2009, ApJ, 703, 569
Davis, S. W., Done, C., & Blaes, O. M. 2006, ApJ, 647, 525 De Rosa, G., Peterson, B. M., Ely, J., et al. 2015, ApJ, 806, 128 Dexter, J., & Agol, E. 2011, ApJL, 727, L24
Done, C., Davis, S. W., Jin, C., Blaes, O., & Ward, M. 2012, MNRAS, 420, 1848
Wavelength λ in Å
102 103 104
λ
fλ
in erg s
-1 cm
-2
10-11 10-10
Blackbody (0.069 LEdd) Constant log(ρatm/ρ) = -0
Exponential log(ρatm/ρ) = -0
Wavelength λ in Å
102 103 104
λ
fλ
in erg s
-1 cm
-2
10-11 10-10
Blackbody (0.069 LEdd) Constant log(ρatm/ρ) = -1
Exponential log(ρatm/ρ) = -1
Wavelength λ in Å
102 103 104
λ
fλ
in erg s
-1 cm
-2
10-11 10-10
Blackbody (0.069 L
Edd)
Constant log(ρatm/ρ) = -2 Exponential log(ρatm/ρ) = -2
Wavelength λ in Å
102 103 104
λ
fλ
in erg s
-1 cm
-2
10-11 10-10
Blackbody (0.069 L
Edd)
Constant log(ρatm/ρ) = -3 Exponential log(ρatm/ρ) = -3
Wavelength λ in Å
102 103 104
λ
fλ
in erg s
-1 cm
-2
10-11 10-10
Blackbody (0.069 LEdd) Constant log(ρatm/ρ) = -4
Exponential log(ρatm/ρ) = -4
Wavelength λ in Å
102 103 104
λ
fλ
in erg s
-1 cm
-2
10-11 10-10
Blackbody (0.069 LEdd) Constant log(ρatm/ρ) = -5
[image:10.612.54.566.89.671.2]Exponential log(ρatm/ρ) = -5
Figure 4. The predicted observed spectral energy distributions (SEDs) from face-on accretion disks with L = 0.069LEdd in
NGC 5548. Panel layout and color key are as in Figure1. The thin curves in theupper left and lower left panelsshowfν
Wavelength λ in Å
0 1000 2000 3000 4000 5000 6000 7000 8000
r(
λ
) / r(
λ
),Blackbody
0 1 2 3 4 5 6 7 8
Blackbody (0.069 LEdd) Constant
[image:11.612.77.378.75.321.2]Exponential
Figure 5. Mean radiir(λ) divided by the correspondingr(λ) for a blackbody disk, for scattering-atmosphere disks with constant density (red) and exponential density (cyan), all withL= 0.069LEdd. The curves shown are for log(ρatm/ρ) = 0(solid),
−1 (dash-dotted), −2 (dashed), and −4 (dotted). Heavy lines denote response-function-weighted radii and light lines
denote flux-weighted radii.
Wavelength λ in Å
0 2000 4000 6000 8000 10000 12000
r(
λ
)-r(1367 Å), light-days
-1 0 1 2 3 4 5 6
Blackbody (0.069 LEdd) Constant log(ρatm/ρ) = -0 Exponential log(ρatm/ρ) = -0
Figure 6. In the same fashion as Figure 1 (see that caption for details), we plot the absolute
wavelength-dependent relative disk reverberation time lag estimated from the response-function-weighted mean radius
[image:11.612.73.376.399.642.2]Wavelength λ in Å
0 2000 4000 6000 8000 10000 12000
r(
λ
)-r(1367 Å), light-days
-1 0 1 2 3 4 5
Blackbody (0.069 L
Edd)
Constant log(ρatm/ρ) = -4
Exponential log(ρatm/ρ) = -4
Wavelength λ in Å
0 2000 4000 6000 8000 10000 12000
r(
λ
), light-days
-1 0 1 2 3 4 5
Blackbody (0.069 L
Edd)
Constant log(ρatm/ρ) = -4
[image:12.612.71.570.72.258.2]Exponential log(ρatm/ρ) = -4
Figure 7. Left: in the same fashion as Figure 1 (see that caption for details), we plot the wavelength-dependent relative disk reverberation time lag estimated from the response-function-weighted mean radiusr(λ)−r(1367 ˚A)
(solid lines) for blackbody disks (black) and scattering-atmosphere disks with constant density (red) and expo-nential density (cyan), all withlog(ρatm/ρ) =−4. Dashed lines show the results considering disk radiir >60RSch
only. Right: response-function-weighted mean radiir(λ) (absolute disk reverberation time lags) for blackbody disks (black) and scattering-atmosphere disks with constant density (red) and exponential density (cyan), all with log(ρatm/ρ) =−4. Dashed lines show the results considering disk radii r >60RSch only. Dotted and
dot-dashed lines show flux-weighted radii for the full disk and for disk radii r >60RSch only, respectively. Points
from F16 are plotted assuming zero time delay for the Swift hard X-ray band.
Eigenbrod, A., Courbin, F., Meylan, G., et al., 2008, A&A, 490, 933
Fausnaugh, M. M., Denney, K. D., Barth, A. J., et al. 2016, ApJ, 821, 56
Frank, J., King, A., & Raine, D. J. 2002, Accretion Power in Astrophysics: Third Edition, 86
Gardner, E., & Done, C. 2017, MNRAS, 470, 3591
Hall, P. B., Noordeh, E. S., Chajet, L. S., Weiss, E., & Nixon, C. J. 2014, MNRAS, 442, 1090
Jiang, Y.-F., Davis, S. W., & Stone, J. M. 2016a, ApJ, 827, 10 Jiang, Y.-F., Green, P. J., Greene, J. E., et al. 2016b, ArXiv
e-prints, arXiv:1612.08747
Kawaguchi, T., Pierens, A., & Hur´e, J.-M. 2004, A&A, 415, 47 Komatsu, E., Smith, K. M., Dunkley, J., et al. 2011, ApJS, 192,
18
Laor, A., & Davis, S. W. 2014, MNRAS, 438, 3024
Mehdipour, M., Kaastra, J. S., Kriss, G. A., Cappi, M. et al. 2015, A&A, 575, A22
Meier, D. L. 2012, Black Hole Astrophysics: The Engine Paradigm (Springer-Verlag)
Morgan, C. W., Kochanek, C. S., Morgan, N. D., & Falco, E. E. 2010, ApJ, 712, 1129
Mudd, D., Martini, P., Zu, Y., Kochanek, C., et al. 2017, ArXiv e-prints, arXiv:1711.11588
Novikov, I. D., & Thorne, K. S. 1973, in Black Holes (Les Astres Occlus), ed. C. Dewitt & B. S. Dewitt, 343–450
Pei, L., Fausnaugh, M. M., Barth, A. J., et al. 2017, ApJ, 837, 131
Proga, D. 2005, ApJL, 630, L9
Rauch, K. P., & Blandford, R. D. 1991, ApJL, 381, L39 Rybicki, G. B., & Lightman, A. P. 1986, Radiative Processes in
Astrophysics (Wiley VCH), 320
Shakura, N. I., & Sunyaev, R. A. 1973, A&A, 24, 337
Shappee, B. J., Prieto, J. L., Grupe, D., et al. 2014, ApJ, 788, 48 Slone, O., & Netzer, H. 2012, MNRAS, 426, 656
Starkey, D., Horne, K., Fausnaugh, M., et al. 2017, ApJ, 835, 65 Tao, T., & Blaes, O. 2013, ApJ, 770, 55
Woo, J.-H., & Urry, C. M. 2002, ApJ, 579, 530