EVALUATION OF SOFT PALATE MORPHOLOGY AND NEED’S RATIO IN PATIENTS WITH
SKELETAL CLASS I AND CLASS II WITH DIFFERENT GROWTH PATTERNS
1, *
Dr. Eenal Bhambri,
2Dr.Sachin Ahuja
1Reader, Department of Orthodontics 2Professor and Head, Department of Orthodontics
3Professor, Department of Orthodontics 4Senior Lecturer, Department of Orthodontics 5Senior Lecturer, Department of Oral Pathology
ARTICLE INFO ABSTRACT
Aim and objective: skeletal class I and class II
was conducted on 240 subjects (aged 15
for orthodontic treatment. The subjects were divided into skeletal class I and class I further subdivided into hypodivergent
morphology was examined and subjects were divided into 6 types. Need’s ratio was calculated by division of pharyngeal depth by soft palate
analysis to evaluate the variation in need’s ratio in patients with skeletal class I and class II with various growth patterns.
skeletal class I were most frequently found to have leaf shaped and skeletal class II subjects had rat tail shape soft palate as the most common
lowest in hyperdivergent growth pattern in both skel
significant differences in need’s ratio of hypodivergent and hyperdivergent growers of both sagittal malocclusions.
hyperdiverge
morphological variants of soft palate help the clinician in etiological study of OSAS other conditions.
Copyright©2018, Eenal Bhambri et al.This is an open access distribution, and reproduction in any medium, provided
INTRODUCTION
Soft palate morphology, dimensions and its dynamic relations with the pharyngeal airway space have an important role in swallowing, respiration, and phonation, which in turn are highly relevant to orthodontic diagnosis and treatment
planning (Akcam et al., 2002). The velopharyngeal closure
mechanism functions to control nasal airflow
this mechanism may cause phonation problems w
manifest as resonance or hypernasality in speech. Soft palate dysfunctions are frequently seen in cleft lip and palate patients enlarged adenoids, obstructive sleep apnea syndrome (OSAS) snoring, poorly retained maxillary denture and skeletal
craniofacial malocclusion(Moore et al., 2008;
2001) and these dysfunctions can be classified as
morphologically incompetent (absolute) where the soft palate length (SPL) is not adequate for velopharyngeal closure and functional incompetence (relative) where the soft palate
*Corresponding author: Dr. Eenal Bhambri,
Reader, Department of Orthodontics, Surendera Dental College and Research Institute, Sri Ganganagar, India.
ISSN: 0975-833X
Article History:
Received 19th August, 2018
Received in revised form 01st September, 2018 Accepted 29th October, 2018
Published online 30th November, 2018
Citation: Dr. Eenal Bhambri, Dr. Sachin Ahuja, Dr. Seema Gupta,
need’s ratio in patients with skeletal class i and class ii with different growth patterns
Key words:
Malocclusion, Morphology, Radiography, Soft palate.
RESEARCH ARTICLE
EVALUATION OF SOFT PALATE MORPHOLOGY AND NEED’S RATIO IN PATIENTS WITH
SKELETAL CLASS I AND CLASS II WITH DIFFERENT GROWTH PATTERNS
Dr.Sachin Ahuja,
3Dr.Seema Gupta,
4Dr.Varun Ahuja and
Department of Orthodontics, Surendera Dental College and Research Institute Department of Orthodontics, Surendera Dental College and Research Institute Department of Orthodontics, Surendera Dental College and Research Institute
Department of Orthodontics, Surendera Dental College and Research Institute Department of Oral Pathology, Surendera Dental College and Research Institute
ABSTRACT
Aim and objective: The study was aimed to evaluate the soft palate morphology and need’s ratio in skeletal class I and class II subjects with various growth patterns. Materials and methods:
was conducted on 240 subjects (aged 15-25 years) who presented to the department of orthodontics for orthodontic treatment. The subjects were divided into skeletal class I and class I
r subdivided into hypodivergent, norm divergent and hyperdivergent growers. The soft palate morphology was examined and subjects were divided into 6 types. Need’s ratio was calculated by division of pharyngeal depth by soft palate length. The results were then subjected to statistical analysis to evaluate the variation in need’s ratio in patients with skeletal class I and class II with various growth patterns. Results: The most common type of soft palate was leaf shaped. Patients wi skeletal class I were most frequently found to have leaf shaped and skeletal class II subjects had rat tail shape soft palate as the most common, irrespective of growth pattern.
lowest in hyperdivergent growth pattern in both skeletal class I and class II subjects
significant differences in need’s ratio of hypodivergent and hyperdivergent growers of both sagittal malocclusions. Conclusion: The need’s ratio showed a statistically significant difference among hyperdivergent and hypodivergent growth patterns of class I and class II subjects.
morphological variants of soft palate help the clinician in etiological study of OSAS other conditions.
access article distributed under the Creative Commons Attribution License the original work is properly cited.
dimensions and its dynamic relations with the pharyngeal airway space have an important role in which in turn are highly relevant to orthodontic diagnosis and treatment The velopharyngeal closure mechanism functions to control nasal airflow, and disorders in this mechanism may cause phonation problems which can manifest as resonance or hypernasality in speech. Soft palate dysfunctions are frequently seen in cleft lip and palate patients, obstructive sleep apnea syndrome (OSAS), poorly retained maxillary denture and skeletal
2008; Lindman et al.,
and these dysfunctions can be classified as morphologically incompetent (absolute) where the soft palate length (SPL) is not adequate for velopharyngeal closure and functional incompetence (relative) where the soft palate
Reader, Department of Orthodontics, Surendera Dental College and Research
dimensions are normal but dysfunction occurs as a result of insufficient muscular activity,
palatine (Lindman et al., 2001).
well as the increasing number of orthognathic procedures performed for orthodontic patients
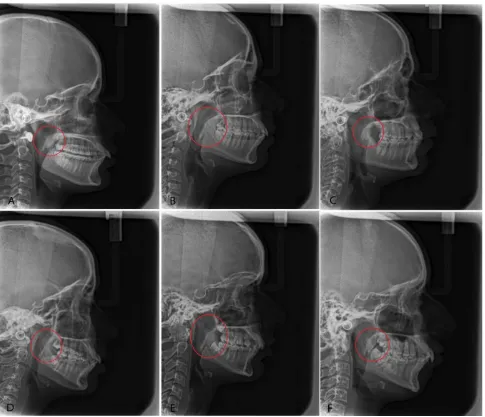
growth and functions is important. Numerous studies have been done in the past towards the dimensional analysis of soft palate, but little attention has been paid to the varied soft palate morphology and configuration. By observing the image of soft palate on lateral cephalograms,
soft palate into six morphological types (Type 1: Leaf shaped/lanceolate shaped in which the middle portion of the soft palate was elevated to both the naso and oro sides; Type 2: Rat tail shaped in which the soft palate showed inflated anterior portion and free margin with an
Type 3: Butt-like shaped which showed a shorter and fatter velum appearance with no distinct difference of width of the anterior portion to the free margin; Type 4: Straight line shaped; Type 5: S-shaped/distorted soft palate; and Typ Crooked shaped) (Fig. 1). Pepin
“hooked or S-shaped” appearance of the soft palate in awake
International Journal of Current Research
Vol. 10, Issue, 11, pp.75547-75552, November, 2018
DOI: https://doi.org/10.24941/ijcr.32845.11.2018
Dr. Eenal Bhambri, Dr. Sachin Ahuja, Dr. Seema Gupta, Dr. Varun Ahuja and Dr. Gautam Bhambri, 2018.“Evaluation of soft palate morphology and need’s ratio in patients with skeletal class i and class ii with different growth patterns”, International Journal of Current Research
EVALUATION OF SOFT PALATE MORPHOLOGY AND NEED’S RATIO IN PATIENTS WITH
SKELETAL CLASS I AND CLASS II WITH DIFFERENT GROWTH PATTERNS
Dr.Varun Ahuja and
5Dr.Gautam Bhambri
Surendera Dental College and Research Institute, Sri Ganganagar, India Research Institute, Sri Ganganagar, India Research Institute, Sri Ganganagar, India
Research Institute, Sri Ganganagar, India Research Institute, Sri Ganganagar, India
The study was aimed to evaluate the soft palate morphology and need’s ratio in Materials and methods: The study 25 years) who presented to the department of orthodontics for orthodontic treatment. The subjects were divided into skeletal class I and class II which were norm divergent and hyperdivergent growers. The soft palate morphology was examined and subjects were divided into 6 types. Need’s ratio was calculated by length. The results were then subjected to statistical analysis to evaluate the variation in need’s ratio in patients with skeletal class I and class II with : The most common type of soft palate was leaf shaped. Patients with skeletal class I were most frequently found to have leaf shaped and skeletal class II subjects had rat irrespective of growth pattern. Need’s ratios were the etal class I and class II subjects. There were significant differences in need’s ratio of hypodivergent and hyperdivergent growers of both sagittal
The need’s ratio showed a statistically significant difference among nt and hypodivergent growth patterns of class I and class II subjects. The knowledge of morphological variants of soft palate help the clinician in etiological study of OSAS, snoring and
License, which permits unrestricted use,
dimensions are normal but dysfunction occurs as a result of , particularly of the levator veli
).Because of speech problems as
well as the increasing number of orthognathic procedures performed for orthodontic patients, an evaluation of soft palate growth and functions is important. Numerous studies have owards the dimensional analysis of soft but little attention has been paid to the varied soft palate morphology and configuration. By observing the image of soft
, You et al. (2008) classified the
morphological types (Type 1: Leaf shaped/lanceolate shaped in which the middle portion of the soft palate was elevated to both the naso and oro sides; Type 2: Rat tail shaped in which the soft palate showed inflated anterior portion and free margin with an obvious coarctation; like shaped which showed a shorter and fatter velum appearance with no distinct difference of width of the anterior portion to the free margin; Type 4: Straight line shaped/distorted soft palate; and Type 6:
Pepin et al. (1999) observed that the
shaped” appearance of the soft palate in awake
INTERNATIONAL JOURNAL OF CURRENT RESEARCH
Evaluation of soft palate morphology and
patients indicated a high risk of OSAS. Velopharyngeal function can be assessed by perceptual and instrumental methods which require a speech therapist and extensive
equipment (Ma et al., 2013). Previous reports have shown that
the velopharyngeal function can also be assessed by the relationship between velar length (VL) and pharyngeal depth (PD) and this ratio of PD/VL is termed as Need’s ratio. Subtelny (1957) first reported that the Need’s ratio ranged from 0.6 to 0.7 in normal subjects, and if it was more than 0.7, the condition demonstrated a risk of velopharyngeal incompetency (VPI). Numerous researchers reported the interaction between pharyngeal dimensions and various sagittal and vertical facial growth patterns at varying degrees (Kirjavainen and Kirjavainen, 2007; Kapoor et al., 2014; Reddy et al., 2011; Sprenger et al., 2017; Akcam, 2017). Skeletal features such as retrusion of maxilla and mandible, vertical maxillary excess in hyper divergent patients may lead
to narrower anteroposterior dimensions of the airway (Joseph
et al., 1998). Others reported association of vertical growth patterns with obstruction in pharyngeal airway concomitant
with mouth breathing (Cuccia et al., 2008).However, several
authors found that there is natural predisposition of narrower
airway passages (Linder-Aronson and Leighton, 1983; Ceylan
and Oktay, 1995). Some authors have also reported association
between vertical growth pattern and obstruction of the upper
pharyngeal airway (Ucar and Uysal, 2011). Also upper
pharyngeal space may be affected by conditions such as functional anterior shifting, head posture, sagittal skeletal
relation and maxillary protraction. So, the need’s ratio may be
influenced by facial skeletal pattern in which the relationship
between the position of the maxilla and mandible in the anteroposterior and vertical direction has great influence on
upper airway dimensions. Correlation of shapes of soft palate
in different Angle’s malocclusion was studied by Deepak Samdani (2015), who showed that Angle’s class I malocclusion was most frequently found to have rat tail type soft palate (58.3%), Angle’s class II had leaf shaped soft palate (36.71%), and Angle’s class III had crooked shaped soft palate (35.71%).However, the skeletal malocclusion was not considered despite that the shape of soft palate depends upon the jaw and posterior teeth positioning. In addition, need’s ratio was also not studied though this ratio plays an important
role in velopharyngeal closure. Bhambri et al. (2018)
investigated the association of soft palate morphology and need’s ratios in various sagittal skeletal malocclusions but the
growth patterns were not addressed. So, the objective of this
[image:2.595.58.543.57.474.2]study was to evaluate the soft palate morphology and need’s ratio in skeletal Class I and II subjects with different growth patterns.
MATERIALS AND METHODS
The sample size calculation was made considering the test power of 95% confidence coefficient. According to the formula for sample size and based on a previous study, 40 cephalograms in each group were sufficient for performing this
study. The study was carried out on lateral cephalometric
records from patients visiting the department of Orthodontics and Dentofacial Orthopaedics for orthodontic treatment. A total of 240 subjects in the age range of 15-25 years, requiring lateral cephalogram for orthodontic treatment were selected for the study. As per Department protocol, informed written consent was obtained from each subject and ethical clearance was obtained from the Hospital’s Institutional Ethics Committee (SDCRI/IEC/2015/015 dated 04.12.15). All the subjects included had no history of prior orthodontic treatment, natural dentition and no craniofacial anomalies, syndromes, clefting or signs of dysfunction of the masticatory system. Standard lateral cephalometric radiographs with the teeth in habitual occlusion and with the head oriented horizontally with the FH plane were taken with the same digital radiographic machine (Kodak 8000C, Carestream Health Inc., Rochester, NY). The cephalometric tracings, landmark identifications and measurements were performed by a single, blinded, duly calibrated examiner and the subjects were divided into two groups on the basis of ANB angle and WITS appraisal-skeletal class I(N=120)and skeletal class II(N=120). The subjects were further subdivided according to vertical pattern into
normodivergent (n=40), hyperdivergent (n=40) and
hypodivergent(n=40) FMA and Y axis were used to divide the
sample into various facial patterns. The FMA measurement
corresponded to the angle between the mandibular plane (GoMe) and the Frankfort plane (PoOr), and its reference value was 25°. Values above 30° were considered a vertical growth trend (hyperdivergent); below 20°, a horizontal trend (hypodivergent), and the Y-axis, also called the angle of facial growth was formed by the sella-gnathion line and the Frankfort horizontal plane intersection. The mean value was 59°. An increase in this value indicated a vertical growth trend, and a
reduction, a horizontal growth trend. Shape of the soft palate as
given by You et al. (2008) was determined for each patient.
The velar length (VL) was evaluated by measuring the linear distance from the posterior nasal spine to the tip of the uvula of the resting soft palate. The Pharyngeal depth (PD) was noted as a linear distance from the posterior surface of the nasal spine marker to the posterior pharyngeal wall along the palatal plane. The measurements were carried out for each digital radiograph and the Need’s ratio was calculated by the division of PD by VL. Twenty lateral cephalograms, randomly selected were traced again after an interval of one month by the same examiner to assess the intra-examiner reliability. Differences between the means of the first and second tracings for each variables were tested by means of paired t-test to evaluate the error of the method and all were well within the acceptable range.
Statistics
All the collected data was analyzed using the IBM SPSS Statistics 23.0 Data Editor software (Version 23.0. Armonk, NY: IBM Corp.). A cross-tab was composed by dividing the subjects based on (1) the type of skeletal malocclusion (2) growth pattern and (3) the shape of soft palate. Chi square test and one way ANOVA were used to evaluate the relationship among the variables in the cross-tabs. Post hoc test was used to find the inter group comparisons.
RESULTS
[image:3.595.116.480.556.637.2]The sample comprised of 240 lateral cephalograms. They were divided into skeletal class I and skeletal class II which were further divided into three categories: normodivergent, hypodivergent and hyperdivergent. By observing the shapes of soft palate on digital lateral cephalograms in our study, it was revealed that overall leaf shape morphology was the most common(55.8%).32.9% subjects had type 2 soft palate, 0.8% had type 3 soft palate, 7.5% subjects had type 4, 1.3% had type 5 and 1.7 % subjects had type 6 soft palate. Types 3, 5 and 6 were not seen in skeletal class II subjects (Table 1). Comparison between the type of malocclusion and the frequency of shapes of soft palate revealed that leaf shape morphology(60%) was the most common in skeletal class I
Table 1. Types of soft palate in different skeletal malocclusions
Types of soft palate Skeletal class I Skeletal class II Total Frequency Hypo Normo Hyper Hypo Normo Hyper
Type 1 Type 2 Type 3 Type 4 Type 5 Type 6
25 9 0 3 0 2
20 12 0 6 0 2
25 2 2 5 3 0
22 25 0 1 0 0
12 24 0 0 0 0
17 20 0 3 0 0
121 92
2 18
3 4
[image:3.595.120.477.665.707.2]55.8% 32.9% 0.8% 7.5% 1.3% 1.7%
Table 2. Variation in Need’s ratio with different growth patterns
Type of growth Skeletal class I Skeletal class II p-value
Hypodivergent Normodivergent
Hyperdivergent
0.76 0.73 0.69
0.72 0.69 0.65
0.001*
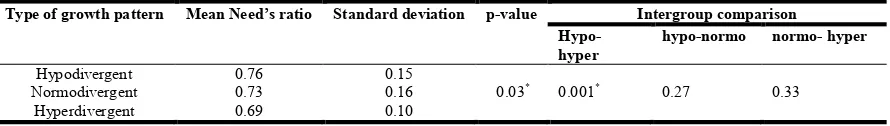
Table 3. Variation in Need’s ratio in skeletal class I with different growth patterns
Type of growth pattern Mean Need’s ratio Standard deviation p-value Intergroup comparison
Hypo-hyper
hypo-normo normo- hyper
Hypodivergent Normodivergent
Hyperdivergent
0.76 0.73 0.69
0.15 0.16 0.10
[image:3.595.77.522.736.799.2]and rat tail(55.8%) was the most frequent in skeletal class II malocclusion, irrespective of growth pattern (Table 1). Mean need’s ratios were significantly correlated among various sagittal and vertical malocclusions(p ≤0.05). (Table 2)They were the lowest in hyperdivergent growth pattern in both skeletal class I and class II subjects (Table 3, 4). For normodivergent, hypodivergent and hyperdivergent growth patterns, there were non significant differences in skeletal class I and class II subjects.(Table 5, 6, 7).
DISCUSSION
Normal respiration is dependent upon sufficient anatomic dimensions of the airway (Ceylan and Oktay, 1995). Numerous studies have been done which correlate upper airway space with different growth patterns, however, the variety of velar morphology which is the most logical cause of different dimensions on the soft palate and upper pharyngeal space has been frequently overlooked. Soft palate function and development can be monitored and recorded using a nasopharyngeal fiberoscope and magnetic resonance imaging
methods (Ma et al., 2013). However, cephalometric analysis is
also commonly accepted technique for evaluation of soft palate in both normal individuals and in those with cleft palate and OSAS because of its easy availability, cost effectiveness and relatively good assessment of soft tissue and its surrounding
structures with reduced radiation exposure. Malkoc et al.
(2005) concluded that cephalometric films are significantly reliable and reproducible in determining airway dimensions. When CT and cephalometric films were compared in subjects
with skeletal malocclusion, Aboudara et al. (2009) found a
significant positive relationship between nasopharyngeal airway size on cephalogram and its true volumetric size as determined from CBCT.A recent longitudinal study also used lateral cephalograms for associating changes in the morphology of the nasopharyngeal space in different facial patterns, which made this method of evaluation reliable. A digital radiographic technique was used in the study as it enables the technician to take the image from the posterior to the anterior in the sagittal plane.
Further, professional software was used to enhance and elicit the velar morphology by adjusting the contrast. The age range of the subjects chosen for the study was 15-25 years to ensure
that the pharyngeal structures had reached adult size (Jena et
al., 2010). In addition, head posture has been suggested to
influence the dimensions of the pharyngeal airway passage (Allhaija and Al-khateeb, 2005). Thus in order to eliminate those effects, patients were kept in standing position with the head erect and with the FH plane parallel to the floor during cephalogram exposure. Samples were classified as skeletal class I and skeletal class II according to ANB angle and WITS
analysis. Qamaruddin et al. (2018) reported that ANB and
WITS are reliable for determining the anteroposterior relationship of the jaws. The results of the current study demonstrated that overall Type 1 soft palate morphology was the most common which is in accordance with You et
al(2008), Kumar and Gopal (2011), Deepa et al. (2013) and
Verma et al. (2014)and Bhambri et al. (2018). Skeletal class I
subjects had type 1 soft palate as the most common whereas type 2 morphology was more prevalent in skeletal class II subjects in various growth patterns. Type 3, 5 and 6 was not observed in skeletal class II subjects. This is in accordance with Subramaniam (2015) who also found leaf shape to be the most frequent in Class I and rat tail type in class II. In the present study, there was no significant difference in the need’s
ratio in patients with class I and class II. Ackam(2017) also
found non significant difference in SPL/NAS ratio among class I and Class II subjects. Also, though the dimensions of the nasopharynx were slightly larger among class I subjects than class II, the depth of the pharyngeal airway was not significantly different in patients with class I and II and increase in the ANB did not affect the characteristics of upper airway (Ackam, 2017). This could be the case because the dimensions of the bony nasopharynx are a relatively independent variable in relation to other dimensions of the
facial complex (Jena et al., 2010). This was in agreement with
Abu Alhaija et al. (2005), Zhong et al. (2010), Jena et al.
(2010),Reddy et al.(2011), Nanda et al. (2012), Soheilifar et
al. (2014), Kapoor et al. (2014) and Chaturvedi et al. (2014).
[image:4.595.66.528.84.136.2]Ceylan and Oktay(1995) reported that a number of postural Table 4. Variation in Need’s ratio in skeletal class II with different growth patterns
Type of growth pattern Mean Need’s ratio Standard deviation p-value Intergroup comparison
Hypo-hyper hypo-normo normo- hyper
Hypodivergent Normodivergent Hyperdivergent
0.72 0.69 0.65
0.14 0.15 0.11
0.018* 0.005* 0.27 0.09
Table 5. Variation in Need’s ratio in sample with Hypodivergent growth pattern with different skeletal malocclusion
Type of malocclusion Mean Needs ratio Standard deviation p-value
Skeletal class I Skeletal class II
0.76 0.72
0.15 0.14
0.10
Table 6. Variation in Need’s ratio in sample with Normodivergent growth pattern with different skeletal malocclusion
Type of malocclusion Mean Need’s ratio Standard deviation p-value
Skeletal class I Skeletal class II
0.73 0.69
0.16 0.15
0.15
Table 7. Variation in Need’s ratio in sample with Hyperdivergent growth pattern with different skeletal malocclusion
Type of malocclusion Mean Need’s ratio Standard deviation p-value
Skeletal class I Skeletal class II
0.69 0.65
0.10 0.11
changes might occur in the structures of head and neck in response to the changes in sagittal jaw relationships that result in constant depth of upper airway In contrast, Kirjavainen et al.
(2007) showed that class II was related to a narrower oral space than class I and this could be probably due to difference in case selection. They classified according to dental malocclusion. EI hakan et al. (2011) found significantly smaller nasopharyngeal volume in class II than class I, however, linear measurements were not considered in the study. Kim et al.(2010) reported that the mean total airway volume in patients with retrognathia was significantly smaller than in patients with normal anteroposterior skeletal relationship, with no difference in the volume of subregions.
Akcam(2017) found significant differences in nasopharyngeal passage in skeletal class II than class I. However, class II malocclusion due to true mandibular retrognathism were selected.
Soft palate length was also not significantly different between class I and class II in the present study. This is in accordance with the results by Ceylan and Oktay (1995), Alhaija et al.
(2005), Kim (2010), Nanda et al. (2012), Soheilifar et al.
(2014). Muto et al. (2008) and Jena et al. (2010) found significant differences in soft palate length in patients with mandibular retrognathism and prognathism when compared to normal mandible. This could be due to the difference in criterion for segregation of subjects. They used SNB angle for subject selection and ANB angle was used for subject segregation in this study. Associations of class II malocclusions and vertical growth pattern with obstruction of the upper and lower pharyngeal airways and mouth breathing on the basis of predisposing anatomical factor have been suggested. Raffat and Hamid(2009) concluded that subjects with upper airway obstruction displayed excessive vertical Dentofacial development, leading to a long face appearance. Kapoor et al. (2014) compared upper and lower pharyngeal airways in skeletal class I and II malocclusions with different growth patterns and inferred that patients with class I and Class II and vertical growth patterns have significantly narrower upper pharyngeal airways than those with class I and class II and normal or hypodivergent growth patterns. Freitas et al.
(2006) also concluded that upper pharyngeal width in subjects with class I and Class II and vertical growers were significantly narrower than in normal growth pattern groups. Celikoglu et al. (2014) concluded that when nasopharyngeal space is reduced, there is a tendency towards neuromuscular adaptation, leading to vertical growth of face that is associated with hyperdivergent growth pattern. In the present study, hyperdivergent facial pattern subjects belonging either to skeletal class I or class II showed a statistically significant difference in upper pharyngeal width as compared to normodivergent and hypodivergent growth patterns. This is in accordance with Akcam et al(2002), Ucar et al. (2011), Kapoor (2014), Idia Nibokun Ize-Iyamu(2016). Shastri et al. (2015) found decreased nasopharyngeal dimensions from normal to high angle patients. Zhong et al. (2010) concluded that vertical facial pattern was responsible for the deficiency in depth of the superior part of the upper airway because of the craniomaxillary complex. Sprenger et al. (2017) did not find a difference in superior pharyngeal space in various growth patterns. This could be attributed to different population and different norms for them. The need’s ratio intergroup comparisons in various sagittal patterns showed no significant differences, revealing no association of need’s ratio with type of malocclusion. This is in accordance with Ceylan et al.
(1995), Kapoor et al. (2014). However, some studies have found relationships between upper airway and type of malocclusion, showing narrower nasopharynges in subjects with Class II malocclusion (Mergen and Jacobs, 1970; Paul
and Nanda, 1973). Our findings regarding the relationship
between need’s ratio and anteroposterior skeletal pattern are inconsistent with those that reported a relationship between pharyngeal structures and ANB. However, the variables used to measure upper airway in the previous studies differed from those used in this study, which makes the comparison more difficult. The present study suggested that vertical growth pattern might predispose a person to upper airway narrowing, which in turn might predispose the person to obstruction in a population without permanent snoring. A longitudinal study of craniofacial morphology as a potential pathogenic factor is warranted in the future. The results of this study demonstrated different quantities and directions of soft palate and velopharyngeal growth in different skeletal types. The hyperdivergent growth pattern showed the greatest change, though the need’s ratio did not show a significant difference in class I and Class II subjects. Therefore, the soft palate dimensions and its functional relations with the surrounding tissues should be examined in detail in the treatment planning of various skeletal problems in order to avoid post treatment speech problems, particularly for orthopaedic treatment involving the maxilla.
Conclusion
In conclusion, it can be said that a number of postural changes can occur and these can involve the structures of head and neck regions in response to the changes in sagittal jaw relationships. So, the need’s ratio, which plays an indispensable role in velopharyngeal function, did not show a statistically significant difference among the sagittal malocclusion groups, though the need’s ratio showed a statistically significant difference among hyperdivergent and hypodivergent growth patterns of class I and class II subjects. Considering nasopharyngeal airway dimensions, clinicians should follow the stability of the ratio between the soft palate and pharynx to prevent speech disorders and obstructive sleep apnea in later life, thereby avoiding treatment planning that may disturb the balance between the soft palate and pharyngeal space.
REFERENCES
Aboudara C, Nielsen I, Huang JC, Maki K, Miller AJ, Hatcher D 2009.Comparison of airway space with conventional lateral headfilms and 3-dimensional reconstruction from cone beam
computed tomography. Am J Orthod Dentofacial Orthop.,
135:468-79.
Akcam MO, Toygar TU, Wada T 2002. Longitudinal investigation of soft palate and nasopharyngeal airway
relations in different rotation types. Angle Orthod., 72: 521-6.
Akcam OU 2017.Pharyngeal airway dimensions in skeletal class II:A cephalometric growth study. Imaging Sci Dent., 47:1-9.
Allhaija ESA, Al-khateeb SN 2005. Uvuloglossopharyngeal
dimensions in different anteroposterior skeletal patterns. Angle
Orthod., 75:1012-18.
Bhambri E, Ahuja V, Ahuja S, Bhambri G, Choudhary A, Sukhija S 2018. The association between soft palate shape and need’s ratio in various sagittal skeletal malocclusions:a digital lateral
cephalometric study. Int J Orthod Rehabil., 9:8-13.
adolescent patients affected by bilateral cleft lip and palate
using cone beam computed tomography. Angle Orthod.,
84:995-1001.
Ceylan I, Oktay H 1995.A study on the pharyngeal size in different skeletal patterns. Am J Orthod Dentofacial Orthop.,
108(1):69-75.
Chaturvedi S, Agarwal A, Chaturvedi Y, Goyal A, Agarwal A 2014. Comparative study of the nasopharyngeal airway dimensions in class II individuals using cone beam computed
tomography. J Ind Orthod Soc., 48(4):256-61.
Cuccia AM, Lotti M, Caradonna D 2008. Oral breathing and head posture. Angle Orthod., 78(1):77-82.
De Freitas MR, Alcazar NM, Janson G, deFreitas KM, Henriques JF 2006.Upper and lower pharyngeal airways in subjects with class I and class II malocclusions and different growth
patterns. Am J Orthod Dentofacial Orthop., 130(6):742-5.
Deepa V, David CM, Ramnarayan BK 2013. Morphological varieties of soft palate in normal individuals, cleft palate patients and obstructive sleep apnea patients with reference to Indian Population: A preliminary digital cephalometric study.
W J Dent., 4(4):241-49.
EI H, Palomo JM 2011. Airway volume for different Dentofacial skeletal patterns. Am J Orthod Dentofacial Orthop 139:e511-e521.
Ize-Iyamu IN 2016. Pharyngeal dimensions in skeletal class I, II
and III orthodontic patients in a Nigerian population. West Afr
J Radiol., 23:8-94.
Jena AK, Singh SP, Utreja AK 2010. Sagittal mandibular development effects on the dimensions of the awake
pharyngeal airway passage. Angle Orthod., 80:1061-67.
Joseph AA, Elbaum J, Cisneros GJ, Eisig SB 1998.A cephalometric comparative study of the soft tissue airway dimensions in persons with hyperdivergent and normodivergent facial patterns. J oral maxillofac Surg.,
56(2):135-9.
Kapoor S, Pallav P, Moiranngthem R, Varshney SR, Jain AK 2014. Upper and lower pharyngeal airways in skeletal class I and class II malocclusions with different craniofacial patterns.
Ann Dent Spec., 2(3):85-90.
Kim YJ, Hong JS, Hwang YI, Park YH 2010.Three dimensional analysis of pharyngeal airway inn preadolescent children with
differrent anteroposterior skeletal patterns. Am J Orthod
Dentofacial Orthop., 117:714-20.
Kirjavainen M, Kirjavainen T 2007.Upper airway dimensions in class II malocclusion. Angle Orthod., 77(6):1046-53.
Kumar DK, Gopal KS 2011. Morphological variants of soft palate
in normal individuals: a digital lateral cephalometric study. J
Clin Diag Res., 5:1310-3.
Linder-Aronson S, Leighton BC 1983.A longitudinal study of the development of the posterior nasopharyngeal wall between 3 and 16 years of age. Eur J Orthod., 5(1):47-58.
Lindman R, Paulin G, Stal PS 2001. Morphological characterization of the levator veli palatini muscle in children born with cleft palates. Cleft Palate Craniofacial J., 38:438-48.
Ma L, Shi B, Li Y, Zheng Q 2013. Velopharyngeal function assessment in patients with cleft palate:perceptual speech assessment versus nasopharyngoscopy. J Craniofac Surg.,
24(4):1229-31.
Malkoc S, Usumez S, Nur M, Donaghy CE 2005. Reproducibility of airway dimensions and tongue and hyoid positions on
lateral cephalograms. Am J Orthod Dentofacial orthop.,
128:513-6.
Mergen DC, Jacobs MR 1970. The size of nasopharynx associated
with normal occlusion and class II malocclusion. Angle
Orthod., 40(4):342—6.
Moore KL, Agur AM. 2002. Essential clinical anatomy. 2nd ed.Philadelphia: Lippincott Williams & Wilkins.
Muto T, Yamazaki A, Takeda S 2008.A cephalometric evaluation of the pharyngeal airway space in patients with mandibular
retrognathia and prognathia and normal subjects. Int.J.Oral
Maxillofac.Surg., 37:228-31.
Nanda M, Singla A, Negi A, Jaj HS, Mahajan V 2012. The association between maxillomandibular sagittal relationship
and pharyngeal airway passage dimensions. J Ind Orthod Soc.,
46(1):48-52.
Paul JL, Nanda RS 1973. Effect of mouth breathing on dental
occlusion. Angle Orthod., 43(2):201-6.
Pepin JL, Veale D, Ferretti GR, Mayer P, Levy PA 1999. Obstructive sleep apnea syndrome: hooked appearance of the soft palate in awake patients - cephalometric and CT findings.
Radiology, 210: 163-70.
Qamaruddin I, Alam M, Shahid F, Tanveer S, Umer M, Amin E 2018.Comparison of popular sagittal cephalomettric analyses
for validity and reliability. Saudi Dent J., 30:43-6.
Raffat A, UL Hamid W 2009. Cephalometric assessment of
patients with adenoidal faces. J Pak Med Assoc.,
59(11):747-52.
Reddy R, Chunduri R, Thomas M, Ganapathy K, Shrikant Shendre, M.H Chandrashekhar 2011.Upper and lower pharyngeal airways in subjects with skeletal class-I, class II & class III malocclusions and different growth patterns-a cephalometric study. Int J Contemp Dent., 2(5):12-18.
Samdani D, Saigal A, Garg E 2015. Correlation of morphological variants of soft palate and types of malocclusion: A digital
lateral cephalometric study. J Indian Acad Oral Med Radiol.,
27:366-71.
Shastri D, Tandon P, Nagar A, Singh A 2015. Pharyngeal airway parameters in subjects with class I malocclusion with different
growth patterns. J Orthod Res., 3(1):11-16.
Soheilifar S, Soheilifar S, Soheilifar S 2014.Upper airway dimensions in patients with class II and class I skeletal pattern.
Avicennna J Dent Res., 6(2):e23300.
Sprenger R, Martins LAC, Santos JCBD, Menezes CCD, Venezian GC, Degan VV 2017.A retrospective cephalometric study on upper airway spaces in different facial types.
Progress Orthod., 18(25)
Subramaniam N. 2015. Correlation of morphological variants of soft palate and types of occlusion in patients seeking
Orthodontic assessment. Int J Sci Res., 6(5):1923-6.
Subtelny JD. 1957. A Cephalometric study of the growth of the
soft palate. Plast Reconstr Surg., 19: 49-62.
Ucar FI, Uysal T 2011. Orofacial airway dimensions in subjects with class I malocclusion and different growth patterns. Angle Orthod., 81(3):460-8.
Verma P, Verma KG, Kumaraswami KL, Basawaraju S, Sachdeva SK, Juneja S 2014. Correlation of morphological variants of the soft palate and Need’s ratio in normal individuals. A
digital lateral cephalometric study. Imaging Sci Dent.,
44(3):193-98.
You M, Li X, Wang H, Zhang J, Wu H, Liu Y, et al 2008. Morphological variety of the soft palate in normal individuals:
a digital cephalometric study. Dentomaxillofac Radiol.,
37:344-9.
Zhong Z, Tang Z, Gao X, Zeng XL 2010.A comparison study of upper airway among different skeletal craniofacial patterns in
non snoring Chinese children. Angle Orthod., 80(2):267-74.