INTERNAL STRATEGIC ALIGNMENT
WITHIN THE SETTING OF ASSET
MANAGEMENT
Ir. Stefan Bastiaan de Vries
Master Thesis
Internal strategic alignment within
the setting of asset management
Master Thesis
Master Business Administration
Faculty of Behavioral, Management and Social sciences University of Twente
Ir. Stefan (S.B.) de Vries
18/08/2017
Supervising committee:
DR. R.P.A. (Raymond) Loohuis, MBA (University of Twente) Dr. Sc. Techn. A. (Andreas) Hartmann (University of Twente) Ing. D.E. (Dick) van Pijkeren (former employee Arcadis Nederland B.V.)
Preface
This Thesis concludes the Master Business Administration at the University of Twente. The Thesis was conducted at Arcadis Nederland (Advisory groups Water Management & Landscape North-East and South-West Netherlands), in collaboration with the regional water authorities Vechtstromen and Zuiderzeeland. Researching the topic of strategic alignment within the setting of asset management has been very educational. After years of following courses at the university, it has been a valuable opportunity to apply my knowledge and skills during an in-depth research. Moreover, by studying the regional water authorities Vechtstromen and Zuiderzeeland, I have gathered a better understanding about how the Dutch regional water management is organized. Finally, during my time at Arcadis, I got a good impression what working at a design, engineering and management consulting company encompasses. The experiences and knowledge I gained during this Thesis will be useful for my working career.
I would like to thank all members and former members of my graduation committee for their commitment and valuable feedback during the processes. Thank you Dick van Pijkeren, Ilse Verbeek, Esther Both-Pols and Paul Copier for your time, patience, enthusiasm, knowledge and sympathy. Thank you Raymond Loohuis and Andreas Hartman, for the valuable meetings and advice, as well as the time you invested in me. Next, I am greatly thankful to Arcadis for providing me all the resources, knowledge and expertise to conduct the graduation project. I would also like to express my sincere gratitude towards the regional water authorities Vechtstromen and Zuiderzeeland for the time and resources they invested in the research.
I would like to thank my parents for providing me the possibility to study, the encouragements and the unconditional support. Lastly, I would like to thank Lotte for her love, inspiration, support and motivational talks during my graduation assignment.
Abstract
The management (e.g. building, maintaining and utilizing) of physical assets can be conceptualized as a strategy process. This process is affected by contextual variables such as human resources and cultural values. Internal strategic alignment is essential for this as its helps to effectively and efficiently utilize the assets and create maximum value. Internal alignment is the consistency within the strategy process (top-down and bottom-up) between the objectives, strategies, performance measures, plans and operational actions that are spread across an organization and the consistency with contextual variables that should support this strategy process. The concept of asset management (AM) can help organizations to develop internal alignment in the management of assets. In other words, organizations that have not yet fully reached internal alignment could be triggered to improve themselves and adopt the principles of AM within their operations. However, also the deployment of AM itself can be considered as a (change) strategy process that is affected by several contextual variables. Again, also here, internal alignment is a vital element. These two types of alignment form the basis of this study. This study aims to gather more insights: about the necessary conditions for the internal alignments in the management of assets and in the deployment of AM; about how these conditions manifest themselves in real-life; and about how these conditions can be developed if they are not yet present. Until now, literature has paid scant attention to these topics.
This study combined literature findings from the fields of strategic management and asset management. By doing this, this study identified 9 conditions (divided into 24 sub-conditions) that have to be met by an organization in order to reach internal alignment in the management of assets. For the alignment in deployment of AM, this study identified 9 necessary conditions (divided into 18 sub-conditions).
To investigate how each of these conditions manifest themselves within real-life, this research conducted two case studies. The two cases were the regional water authorities Vechtstromen and Zuiderzeeland. Both authorities are responsible for managing the water system and the wastewater treatment chain in their area of responsibility. For this study, data was gathered with 32 semi-structured interviews and this was supplemented by a desk study of various policy documents and strategic plans.
For both cases, this study concluded that internal alignment within the management of physical assets is not reached because not all necessary conditions are fully present yet. A lot of similarities were found between the two cases. These similarities were attributed to the fact that two organizations operate in similar institutional contexts. Furthermore, for both cases, this study found a lot of similarities between internal alignments for the water system and the wastewater treatment chain. However, the study also revealed the management of wastewater treatment chain is often somewhat more advanced because characteristics of the physical assets are more favorable.
In total, this study identified 13 major constraining factors that obstruct the organizations from meeting all the necessary conditions. Some of these factors are quite visible and specific (e.g. the absence of a clear strategic frame of reference), while others are more difficult to identify as they are embedded within the organizational cultures (e.g. a tendency to focus on the ‘do’ phase of the plan-do-check-act cycle). This study proposed 4 main pillars of solutions that that can directly help the organizations to tackle the constraining factors that are currently most serious. These solutions are for a large part based on the concept of AM. Nonetheless, already before this study was conducted, the two authorities initiated a change process and started to deploy some principles of AM within their existing operations. This research also studied these existing change processes. Likewise, also for the alignment within the AM deployments, this study concluded that not all necessary conditions are fully present yet. Again, a lot of similarities were found between the two cases and differences were detected between their two asset systems. For this type of alignment, this study revealed 9 major constraints. The two organizations are for example obstructed because: there is no full and shared understanding about AM; some members of the organizations are somewhat reserved about AM; there is no clear guiding coalition; and the relations between the AM deployment and other organizational developments are not well managed. Based on these findings, this study proposed 6 pillars of solutions that be conducted by the two organizations to improve the alignments within their AM deployments.
Contents
1 INTRODUCTION
9
1.1 Background 9
1.2 Research objective and research questions 9
1.3 Method 10
1.4 Contribution 11
1.5 Report outline 11
2 LITERATURE REVIEW
12
2.1 Conceptual framework 12
2.2 Asset management and its deployment 13
2.3 Internal strategic alignment 22
2.4 Conclusion 28
3 RESEARCH METHODOLOGY
31
3.1 Introduction 31
3.2 Cases 31
3.3 Collection of data 31
3.4 Interpretation and reporting 32
4 INTERNAL ALIGNMENT IN THE MANAGEMENT OF PHYSICAL
ASSETS
33
4.1 The Dutch regional water authorities 33
4.2 Vechtstromen and Zuiderzeeland 34
4.3 The existing internal strategic alignments 38
4.4 Improving the existing internal strategic alignment 55
4.5 Conclusion 62
5 INTERNAL ALIGNMENT IN THE DEPLOYMENT OF ASSET
MANAGEMENT
63
5.1 The existing internal strategic alignments 63
5.2 Improving the existing internal strategic alignments 71
5.3 Conclusion 76
6 CONCLUSION
77
7 DISCUSSION
78
8 LIMITATIONS AND RECOMMENDATIONS
79
REFERENCES
80
APPENDIX A: CHAPTER 2
85
1 INTRODUCTION
1.1 Background
To effectively and efficiently manage their assets, an increasing number of organizations nowadays apply the principles of asset management (AM). There is also a growing body of practice and research-related literature that studies AM and that develops models and tools for AM (Schraven, Hartmann, & Dewulf, 2011; Wijnia, 2016). AM can be defined as the
“systematic and coordinated activities and practices through which an organization optimally and sustainably manages its assets and asset systems, their associated expenditures, performances and risks over their life cycles for the purpose of achieving its organizational
strategic plan” (IAM, 2008a, p. 6). AM involves interdisciplinary and life-cycle approaches that require the collaboration between organizational units and the integration of short-term and long-term decisions (Amadi-Echendu et al., 2010). Although AM can be applied to various types of assets, this study specifically focuses on physical assets.
When properly applied, AM helps to acquire insights about the expenditures, performances and risks of the assets over their life cycles. These insights can be used by organizations to anticipate on future asset life cycle phases and find an optimum allocation of their limited resources (ISO, 2014; Moon et al., 2009). In this way, AM can result in improved financial performances (more value from the same budget), improved asset performances that meet the stakeholder expectations, informed management decisions, demonstrated social responsibilities and compliance and improved organizational sustainability (managing short and long-term effects) (IAM, 2008a; ISO, 2014; Moon et al., 2009; Schraven et al., 2011). These benefits can help organizations to cope with challenges such as budget cuts, more and higher stakeholder requirements, the public demand for higher transparency, managing aging assets and increasing utilizations of the asset systems (Schraven & Hartmann, 2010; van der Velde et al., 2013; Wijnia & Herder, 2010).
Internal strategic alignment in the management of assets is the backbone of a successful organization. AM is a concept that can help organizations to obtain this alignment (e.g. Austroads, 2013; IAM, 2008a; ISO, 2014; Moon et al., 2009; NEN, 2016). In this study, internal alignment1 is defined as the consistency within the strategy process between the objectives, strategies, performance measures, plans and operational actions that are spread across an organization and the consistency with contextual variables such as human resources and the organizational culture. So, an organization that has not yet reached an internal alignment in the management assets can be triggered to deploy2 AM in its operations. However, also the AM deployment itself is a strategy process that is affected by contextual variables. More importantly, also here, internal alignment is an essential element. Existing literature does not make this above distinction between the two alignments. Nonetheless, in case of both types of alignment and also for the combination of the two, existing AM literature has paid scant attention to the conditions that have to be met by organizations in order to reach alignment and also scant attention has been paid to how these conditions manifest themselves in real-life organizations (Schraven et al., 2011; Wijnia & Herder, 2010). There are multiple studies in the field of strategic management that studied alignment in detail (Acur et al., 2012; Andrews et al., 2012; Avison et al., 2004; Beehr et al., 2009; Beer et al., 2005; Bergeron et al. 2004), but they did not focus on the setting of AM.
1.2 Research objective and research questions
Because strategic alignment is largely overlooked in the field of AM, the present study seeks to shed some more light on this. This Thesis aims to gather more insights about the necessary conditions for the internal strategic alignments in the management of physical assets and in deployment of AM. Moreover, it aims to study how these conditions manifest
1The research scope does not include external strategic alignment (the fit with the external environment). Future
references such as “alignment” therefore always refer to the internal alignment
themselves in real-life organizations and how these conditions can be developed if they are not present yet. The research question is: How do the necessary conditions for internal strategic alignment in the management of physical assets and in the deployment of asset management manifest themselves in organizations and how can organizations develop these conditions if they are not present yet?
To answer the main research question, 6 sub-questions are formulated:
1. What is asset management and what does the deployment of asset management look like?
2. What are the necessary conditions for the internal strategic alignments in the management of physical assets and in deployment of asset management?
3. How do the necessary conditions for the internal strategic alignment in the management of physical assets manifest themselves in organizations?
4. How could an organization develop the necessary conditions for the internal strategic alignment in the management of physical assets if they are not present? 5. How do the necessary conditions for the internal strategic alignment in the
deployment of asset management manifest themselves in organizations?
6. How could an organization develop the necessary conditions for the internal strategic alignment in the deployment of asset management if they are not present?
1.3 Method
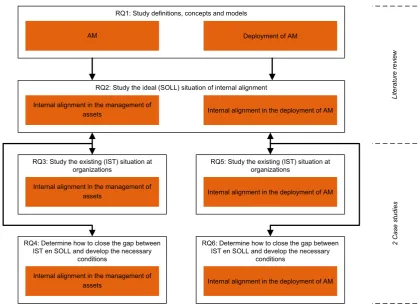
The relations between the sub-questions are visualized in Figure 1. As shown, this research constantly makes a distinction between 2 aspects: the management of assets (for which one could adopt the principles of AM) and the deployment of AM.
RQ1: Study definitions, concepts and models
RQ2: Study the ideal (SOLL) situation of internal alignment
Internal alignment in the management of assets
RQ3: Study the existing (IST) situation at organizations
Internal alignment in the management of
assets Internal alignment in the deployment of AM
Internal alignment in the deployment of AM RQ5: Study the existing (IST) situation at
organizations
Internal alignment in the management of assets
RQ4: Determine how to close the gap between IST en SOLL and develop the necessary
conditions
Internal alignment in the deployment of AM RQ6: Determine how to close the gap between
IST en SOLL and develop the necessary conditions
AM Deployment of AM
Li
te
ra
tu
re
r
ev
ie
w
2
C
as
e
st
ud
ie
[image:10.595.71.491.377.684.2]s
Figure 1 Visualization of the research (sub-)questions and their relations
deployment. In other words, this second sub-question describes the desired/ideal (SOLL) states of the two types of internal alignment.
For sub-questions 3 till 6, this research will use these literature findings to study how the internal alignments are actually configured at real-life organizations (the IST situation) and how organizations could improve this (close the gap between IST and SOLL). This study will discuss to what extent organizations are meeting the necessary conditions for two types of internal alignment and how these organizations can develop the necessary conditions if they are not fully present yet. Whereas sub-questions 3 and 4 do this for ‘the management of assets’, sub-questions 5 and 6 focus on the ‘deployment of AM’.
To perform these above actions for sub-questions 3 till 6, this research conducts two cases studies and gathers data using semi-structured interviews and a desk study. The two cases are the Dutch regional water authorities Vechtstromen and Zuiderzeeland. This study focusses on the physical assets within their water systems and wastewater treatment chains. The research methodology and the two cases will be further described in Chapter 3. It is important to note that the case study findings are based on observations from the summer and autumn of 2016. However, after cross-referencing this Thesis with the two authorities, it was concluded that the findings of this research are still valid.
1.4 Contribution
The findings of this study will contribute to the existing AM literature. It provides deeper insights about the necessary conditions for the two types of internal strategic alignment, how these conditions manifest themselves in real-life and how these conditions could be developed if they are not present yet. Although literature often acknowledges that alignment is an essential part of the AM philosophy, researchers have not paid much attention to this topic. The theoretical basis and the case-specific findings could be applied by researchers to study other organizations. Moreover, it could also be used by researchers to develop a more generalizable theoretical framework for strategic alignment in the setting of AM. Furthermore, the research findings can be used by the two selected authorities to identify the limitations in their alignments and develop a detailed action plan. Finally, also other public and private organizations can benefit from this study as the findings can to some extent be useful in other contexts.
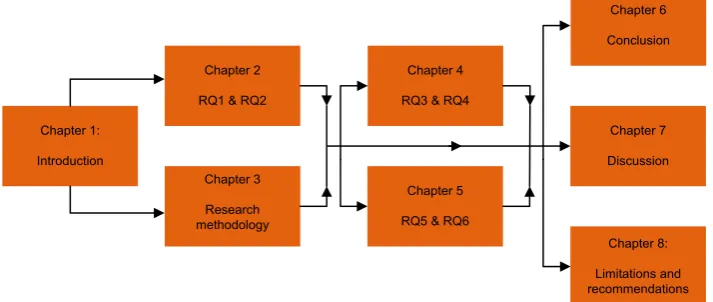
1.5 Report outline
The visualization of the report outline is shown in Figure 2. Chapter 2 will contain the literature review and answer sub-questions 1 and 2. Chapter 3 will discuss the research methodology. Combined, Chapter 2 and 3 will form the input for Chapters 4 and 5. This research will compare the theoretical findings from Chapter 2 with the existing situations at organizations in order to discover gaps (RQ3 and RQ5) and provide solutions for this (RQ4 and RQ6). This was also shown in Figure 1. Chapter 4 will provide answers to sub-questions 3 and 4 (the management of assets). Chapter 5 will discuss sub-sub-questions 5 and 6 (the AM deployment). Chapters 6 and 7 will discuss respectively the conclusion and discussion. The research limitations and recommendations will be mentioned in Chapter 8.
Chapter 1:
Introduction
Chapter 2
RQ1 & RQ2
Chapter 4
RQ3 & RQ4
Chapter 5
RQ5 & RQ6 Chapter 3
Research methodology
Chapter 6
Conclusion
Chapter 7
Discussion
Chapter 8:
[image:11.595.157.514.630.781.2]Limitations and recommendations
2 LITERATURE REVIEW
2.1 Conceptual framework
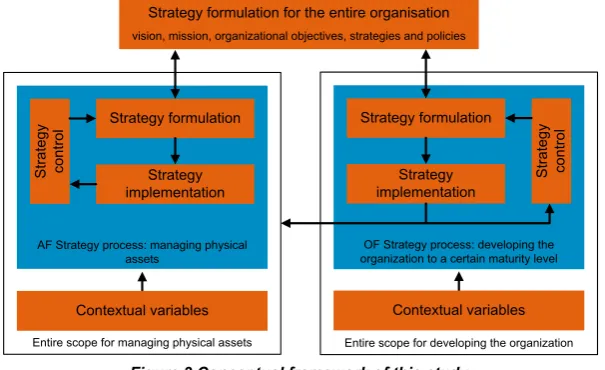
Chapter 1 already briefly discussed the two focus points: the management of assets and the deployment of assets. To further elaborate on this, a conceptual framework is made. This is shown in Figure 3. The framework includes two strategy processes (the white boxes). This Thesis simplifies the strategy processes and assumes that they contain 3 discrete phases: strategy formulation, implementation and control. During the first phase, the strategy and the accompanying long-term objectives are formulated by analyzing the internal and external contexts (Grünig & Kühn, 2005; Moon, 2013). With strategy implementation, the developed strategy is realized throughout the organization by translating the long-term strategic plans into clear short-term objectives and actions (Li et al., 2010; Roelfsema, 2014). During the strategic control, ones evaluates the previous steps and checks whether the assumptions made correspond with reality (Grünig & Kühn, 2005).
Strategy formulation
Strategy implementation
S
tr
at
eg
y
co
nt
ro
l
Strategy formulation for the entire organisation vision, mission, organizational objectives, strategies and policies
AF Strategy process: managing physical assets
Strategy formulation
Strategy implementation
S
tr
at
eg
y
co
nt
ro
l
OF Strategy process: developing the organization to a certain maturity level
[image:12.595.110.413.271.456.2]Entire scope for managing physical assets Entire scope for developing the organization Contextual variables Contextual variables
Figure 3 Conceptual framework of this study.
First of all, the conceptual framework recognizes the AF (asset focused) strategy process (left white box). This describes how physical assets are managed and how this creates value for the organization and its stakeholders. The AF strategy is particularly the concern of those employees (e.g. project managers, operators and engineers) that work with or have a specific interest in the assets. Usually, managing assets is only one of the many activities that an organization executes. Therefore, the AF strategy process is located below the higher-level organizational plans. As shown in Figure 3, the AF strategy process is also affected by contextual variables. These are aspects such as the organizational culture and the employees’ competences that hinder the AF strategy process.
The conceptual framework also includes the OF (organization focused) strategy process. Whereas the AF strategy process focuses on the management of physical assets; the OF strategy process focusses on developing the organization to a desired level of maturity that is necessary to properly manage the assets. As shown in Figure 3, the OF strategy process aims to improve the AF strategy process (e.g. improve the AF strategy formulation) and/or its contextual variables (e.g. the employees’ competencies). So, the OF strategy process is triggered when an organization wants to improve its AF strategy process and/or the related contextual variables. The coordination of the OF strategy is especially the job of those people involved in the organizational development (e.g. HRM, managers etc.). As shown in the figure, also the OF strategy process is part of the overarching organizational plan and is itself affected by contextual variables (e.g. leadership to promote organizational change).
2.1.1 The role of the conceptual framework in this Thesis
alignment in the management of assets by applying the concept of AM. Section 2.2.1 therefore first briefly describes what AM is and how this relates to the AF strategy process and its contextual variables (sub-question 1).
So, an organization that has yet no internal alignment within its management of assets may be triggered to deploy AM. The alignment in this (change) process of the AM deployment forms the second focus point of the research. When looking to the arrows in Figure 3, one can see that the AM deployment is a part of the OF strategy process. It focusses on improving the AF strategy process and its contextual variables. For this study, it is assumed that the scope of the OF strategy is limited to the AM. Other organizational developments (e.g. deployment of process management) are seen as contextual variables that can affect the success of the AM deployment. Section 2.2.2 will describe the strategy process and contextual variables of AM deployment (sub-question 1). The necessary conditions for alignment in the AM deployment are discussed in Section 2.3 (sub-question 2).
The observant reader may have noticed that existing AM literature usually does not make a strong distinction between the two approaches. The approaches are often discussed simultaneously or, in many other cases, the focus is only on the management of assets. This Thesis however deviates from this. In this Thesis, AM is seen as a way of organizing the management of assets. Developing the organization by deploying AM is left out of this and is perceived as a separate strategy process. The two approaches have different focus points (the assets vs. the organization itself). Moreover, the next Sections and Chapters will demonstrate that there are differences in the internal alignments for the two approaches.
2.2 Asset management and its deployment
This Section will discuss the existing literature about the concept AM and the AM deployment (sub-question 1). The structure of the Section is based on the conceptual framework (Figure 4). Sections 2.2.1 and 2.2.2 will discuss the strategy formulation and implementation for respectively AM and the AM deployment. Because of the many commonalities, strategy control is discussed only once and is included in Section 2.2.3. Section 2.2.4 presents the contextual variables of both strategy processes.
Strategy formulation Section 2.2.1 Strategy implementation Section 2.2.1 S tr at eg y co nt ro l S ec ti o n 2 .2 .3 Contextual variables Section 2.2.4 Strategy formulation Section 2.2.2 Strategy implementation
Section 2.2.2 Str
at eg y co nt ro l S ec ti o n 2 .2 .3 Contextual variables Section 2.2.4
Asset management Deployment of asset management
Figure 4 Using the conceptual framework to visualize how Sections 2.2.1 till 2.2.4 are structured.
It is important to stress out that the AM standards PAS55 (IAM, 2008a) and ISO55000 (ISO, 2014) form an important body of knowledge for the next Sections. The standards form a common understanding within the field of AM (Hodkiewicz, 2015; Moon et al., 2009) and there is an emerging consensus about key factors that are discussed (Hodkiewicz, 2015). However, this Thesis acknowledges that the scientific foundations are limited as the positive
impact of apply the standards’ requirements has yet not been extensively tested.
2.2.1 Asset management
2.2.1.1 Types of assets
Production facilities are confined physical locations in which active assets (e.g. machines) convert certain resources/raw materials into products. In many cases, these facilities are even operated for 24 hours a day and 7 days a week. Therefore, to ensure the continuity and to maximize performances, a lot of attention is paid to operating the assets (e.g. finding the right production speed) and the day-to-day maintenance for the wear and tear of the equipment. As such, professionalism and business temperance (rational thinking, process optimization etc.) are often well established for production facilities (Wijnia et al., 2014a). Infrastructure assets (e.g. pipe lines, waterways and railways) are quite different. In general, these are passive assets (Wijnia & de Croon, 2015). They provide a route or control a flow of goods and services by their existence, not by their operation (Baldwin & Dixon, 2008). Compared to the production facilities, infrastructure managers pay relatively less attention to perfecting the operations. As infrastructure assets are generally costly and have long timespan, the focus is often more on investment and design decisions (Wijnia et al., 2014a). Other typical asset characteristics are: few substitutes in the short run, non-tradable, evolutionary systems, networked, dispersed and operated in the public domain, the owner is not the user and the user can be highly anonymous (Wijnia et al., 2014a). Finally, the asset performances are often difficult to measure because of the complex functions these assets have within the society (Baldwin & Dixon, 2008; Schraven et al., 2011).
2.2.1.2 Characteristics of asset management
This Thesis defines AM as: “The coordinated activity of an organization to realize value from
assets” (ISO, 2014, p. 14). AM is about effectively and efficiently managing assets by explicitly creating a balance between the expenditures, performances and risks that occur over the asset life cycles with the aim to create maximum value (IAM, 2008a; Moon et al.,
2009; Popović et al., 2010; Schraven et al., 2011; van der Velde et al., 2013). This process never stops as there should be a process of continuous learning and improving in the form of a plan-do-check-act (PDCA) cycle (IAM, 2008a; ISO, 2014; Moon et al., 2009). Value itself can be tangible, intangible, financial and/or non-financial and is determined by the organization and its stakeholders, in accordance with the organizational objectives.
AM should not be confused with maintenance management. AM is a holistic approach that considers all phases of the asset life cycle and also incorporates elements such as strategy, capital planning, safety, environment and human factors (Amadi-Echendu et al., 2010). AM follows an interdisciplinary approach in which collaboration and sharing of insights and expertise between diverse organizational disciplines (with different focusses and priorities) is essential (Amadi-Echendu et al., 2010; Wijnia & Croon, 2015).
With AM, value creation is the core principle. The desired value determines how many and which resources are needed and what, when, and how assets are managed (Hartsema, 2015; ISO, 2014). This may be mind-set shift for some organizations. The decision-making process is for example no longer primary driven by old habits, rules of thumb, the amount of resources available and the assets themselves. With AM, the decision-process is policy driven, goal oriented and performance based (Moon et al., 2009). It is based on well-defined objectives and metrics and relevant, qualitative and objective information that is correlated to these measures. This provides the rationale when evaluating asset performances, determining resource requirements, identifying trade-offs between investment options and choosing the best allocation of resources (Hartsema, 2015; Moon et al., 2009).
Section 2.2.1.4 will further detail out how the strategy process should like according to AM. Before doing this however, Section 2.2.1.3 first briefly introduces the concept of risk management and the usage of the business value matrix.
2.2.1.3 Risk management and the business value matrix
(judging exposure against the risk appetite) and (if necessary) risk treatment (ISO, 2009). The business value matrix can help during the risk management process of AM and can be a cornerstone within of internal alignment (e.g. link business values with risks).
Business value matrix
[image:15.595.176.496.271.470.2]A value system for risks can be adequately represented by a business value matrix (Cox, 2008; Wijnia, 2016). An example of such a matrix shown in Figure 5. The business value matrix is a single risk matrix that expresses the risk tolerance on multiple business values. The business value matrix schematizes the spectrum of risks in several cells and assigns risk levels to them to indicate whether it contains tolerable or non-tolerable risks. The cells are formed by (often logarithmic) scales on the vertical (impact, for each business value) and horizontal (likelihood) axes. An impact scheme is defined for each value using some quantitative and/or performance indicators and the different impact schemes are aligned with each other (Cox, 2008; Wijnia, 2016). In case of Figure 5, a financial impact of 1-10 million euros is for example perceived as comparable to a single fatality or disability.
Figure 5 Translated excerpt of the 2009 business value matrix of Enexis (2011) for the values finance, reliability and safety made by Wijnia (2016). The colors and letters indicate the risk levels.
Within the risk management process, the matrix and the risk appetite are defined during phase 1. After having identified and analyzed the risks (phases 2 and 3), the matrix can be used to evaluate all risks and determine whether they are tolerable or not (phase 4). For each risk event, the impacts on different business values are looked up in the matrix. Because the impact schemes of different business values are aligned, the matrix allows to translate the impacts on different business value into a single unit. As such, one can add them up and determine the total impact of a single risk event. By again plotting this total impact and its probability in the matrix, one can look up the risk level and use the matrix to determine whether the risk is tolerable. Usually, the impact schemes are aligned with a financial scale and it is therefore possible to translate all non-financial impacts into financial impacts. By adding these up, one can determine the monetary equivalent of the total impact for a single risk (e.g. the total monetary impact of an explosion in a factory that leads to injuries, repair costs, environmental impacts and reputational damage).
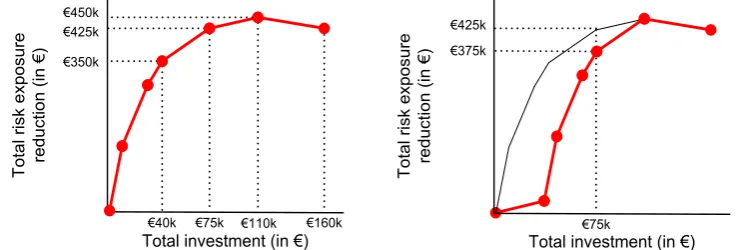
Example: Let’s assume an organization that faces 6 non-tolerable risks and has identified the best intervention for each them. By ranking the interventions based on their benefit-cost ratio, the organization can create the left graph of Figure 6. Here, the total risk exposure reduction is plotted as a function of the total investment. The graph consists out of multiple sections that each represent an intervention. The higher the benefit-cost ratio, the higher the rank and the steeper the line. As shown, the interventions can require different investments (horizontal distance) and can result in different risk reductions (vertical distance).
In case of unlimited resources, the organization could invest in all interventions. However, the graph indicates that one can better not invest in the lowest ranked intervention (most right), as it is counter-productive and adds extra risk exposure. In this way, one can save €50k. Moreover, the second last intervention may not be selected because of its low benefit-cost ratio. As shown, this second last intervention benefit-costs €35k, but only lowers the total monetarized risk with €25k. So, if the organization has €75k, it can best conduct the 4 highest ranked interventions that reduce the total risk with €425k. If for example only €40k is available, the organization should execute 3 of them and reduce the total risk with €350k. However, an organization may have reasons deviate from this prioritization. For example: because of political interests, because of practical considerations or because there is a demand to reduce a specific risk. Assume that the organization still has only €75k available, but the decision makers now want to exclude one intervention from the optimization process: the intervention that used to be ranked as second lowest. So, this intervention is executed anyway. After this manual adaptation of the ranks, one can again use the matrix to determine the optimum portfolio. As shown in the right graph, one can again conduct 4 interventions with the available €75k, but the risk reduction is now only €375k.
T o ta l r is k e xp o su re re d u ct io n ( in € ) €160k
Total investment (€110kin €)
€75k €40k T o ta l r is k e xp o su re re d u ct io n ( in € )
Total investment (€75k in €)
€450k
€425k
€350k
€425k
[image:16.595.73.449.384.509.2]€375k
Figure 6 Graphs with the total risk reduction as function of the investments in risk treatment interventions. Each line section represents a single independent intervention. The left graph presents a situation without
interventions that are being fixed. The right graph shows this original situation (black line) and what happens if 1 of the interventions is fixed.
So, the matrix can help to explicitly describe the current risk position and the risk appetite, to prioritize interventions and to show the impact of strategic decisions (e.g. increasing risks due to budget cuts)(Cox, 2008; Wijnia, 2016). The matrix helps to only invest resources in risks that are related to the organizational strategy, to reduce risks to the acceptable level and to allow risks to increase to the accepted level when there is an over performance (Wijnia, 2016). However, because the matrix has an order magnitude accuracy, it should not be applied too rigidly (Cox, 2008; Markowski & Mannan, 2008; Wijnia, 2016).
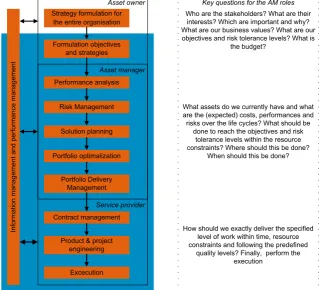
2.2.1.4 The strategy process of asset management
formulation is mainly the responsibility of the asset owner. The asset manager and service provider are involved in the strategy implementation. In the AM process model, strategy
control is framed as “information management and performance management” and requires
the involvement of all AM roles. The text below will further describe the AM process.
Formulation objectives and strategies Performance analysis Risk Management Solution planning Portfolio optimalization Portfolio Delivery Management Contract management
Product & project engineering Excecution In fo rm a tio n m a n a g e m e n t a n d p e rf o rm a n ce m a n a g e m e n t
Who are the stakeholders? What are their interests? Which are important and why? What are our business values? What are our objectives and risk tolerance levels? What is
the budget? Key questions for the AM roles
What assets do we currently have and what are the (expected) costs, performances and risks over the life cycles? What should be
done to reach the objectives and risk tolerance levels within the resource constraints? Where should this be done?
When should this be done?
How should we exactly deliver the specified level of work within time, resource constraints and following the predefined
quality levels? Finally, perform the execution
Strategy formulation for the entire organisation
Asset owner
Asset manager
[image:17.595.174.501.150.440.2]Service provider
Figure 7 AM process model. The light blue area corresponds to the AF strategy process of the conceptual framework. The three boxes with dotted lines show the AM roles.
Strategy formulation: asset owner activities
The asset owner bears the ultimate accountability for the organization’s actions and
decisions. The asset owner identifies and manages the stakeholder requirements and sets the business values, objectives and risk tolerance levels (Moon et al., 2009).
(1) Organizational strategy and objectives
First, the high-level organization’s vision, mission, strategy, objectives, policies are
determined. These high-level strategic goals are stated as the fulfillment of certain improvement needs or achievement of expectations (e.g. safety, universal access and low social costs). As also shown with the conceptual framework, the formulation of these high-level plans is ignored in this Thesis. The plans are overarching and do not only apply to AM. (2) Formulation of objectives and strategies for the management of assets
Time-bound) indicators and thresholds (Schraven et al., 2011). Moreover, the asset owner may not have the right knowledge, experience and data (Brown, 2010). Finally, the task can be complicated by fragmentation across and within asset groups (Moon et al., 2009). Different types of assets and interventions often lead to different standards, philosophies and metrics which makes them difficult to compare. Moreover, also the variety of stakeholders often causes fragmentation in methods, standards, databases etc. (Moon et al., 2009).
To define the objectives and strategies, the asset owner could use the business value matrix. As explained, the matrix helps to makes the organization’s value system rational,
attainable and understandable. It demonstrates which values are important, how they should be compared with each other, how they should be measured and which risks are and are not acceptable. The matrix helps to provide some substantiation and structure in the asset owner’s decisions and provides a frame of reference for the rest of the organization (Wijnia, 2016). In this, it is important that the business value matrix of the asset owner links with lower level matrices. The asset owner’s matrix probably only focuses on those risk events that are of importance him/her: low probability and high impact risks. Small impact high likelihood risk events are somewhat outside the scope of the asset owner. These issues are tackled by the day-to-day actions of the service provider. This service provider has a certain autonomy and uses a lower level matrix.
Strategy implementation: asset manager activities
Based on 5 activities, the asset manager determines what, where and when interventions have to be executed in order to achieve the objectives of the asset owner (van der Velde et al., 2013). After this is documented in plans (called AM plans) and approved by the asset owner, the asset manager can instruct the service provider and agree upon a service level. (3) Performance analysis
During this third activity, the asset manager analyzes the current and future asset performances to better understand the need for interventions (Neumann & Markow, 2004). (4) Risk management
The risk management process was already introduced in Section 2.2.1.3. This fourth activity is used to identify, analyze and evaluate risks.
(5) Solution planning
During this activity, the asset manager generates alternative solutions that mitigate the non-tolerable risks and help to achieve the organizational objectives.
(6) Portfolio optimization
Briefly stated, optimization is about finding the best set of interventions that leads to the desired objectives and value creation (Hartsema, 2015). Section 2.2.1.3 already discussed how the business value matrix could be a useful tool for portfolio optimization.
(7) Portfolio delivery management
Finally, the asset manager translates the AM plans into work packages that are contracted out to internal and external service providers and monitored over time (Wolbers, 2012).
Strategy implementation: service provider activities
The service provider determines how interventions should be executed and finally also executes them. This is done by keeping the costs to a minimum for the specified level of work and quality as agreed upon with the asset manager (Hartsema, 2015).
(8) Contract management
The service provider applies contract management to monitor the processes and results in order to make sure that he/she can deliver what was agreed upon.
(9) Product and project engineering
(10) Execution
The final phase is the execution of the interventions. Depending on the type of contract, this phase may include a single service provider that executes multiple interventions (e.g. inspection, maintenance and construction of assets) over a long-time span.
Strategy control: information and performance management
Information and performance management form an integral part of all phases and AM roles of the AM process model. This will be discussed in Section 2.2.3.
2.2.2 The deployment of asset management
Secondly, this Thesis focusses on the deployment of AM. Within such a deployment, organizations may choose to strictly follow the AM standards or to apply AM more loosely. Nevertheless, several authors agree that a cold certification should not be the goal (de Croon, 2012; Ruiter, 2015). According to them, certification should only be a stick behind the door and a milestone within the process of continuous improvements. Regardless of the accreditation, the benefits of AM can only be fully realized if the organization embraces AM (Azagra et al., 2016). Moreover, it is still uncertain whether certified organizations outperform non-certified organizations and the benefits of certification outweigh the costs (Boiral, 2003; Chow-Chua et al., 2003; Escanciano et al., 2001; Terziovski et al., 2003).
Applying the operating AM model and its roles, tools, technologies are certainly important steps within the AM deployment. Nevertheless, as emphasized by multiple authors, the real differentiators for a successful AM deployment are actually the engagement of the workforce, their knowledge and competencies, the clarity of leadership and the collaboration (Austroads, 2013; Azagra et al., 2016; IAM, 2014a; ISO, 2014; Moon et al., 2009; Woodhouse, 2007). Changing the human factors will even present greater challenges than changes in technical capabilities and IT systems. Therefore, the AM deployment is not an overnight transformation; but is a growth process that requires commitment over a sustained period (FHWA, 2007). This change process needs to be planned, have a clear vision down the road and manageable components in place that can be implemented a tracked on an regular basis (Azagra et al., 2016). Planning the change process makes it more likely that the goals and deadlines are successfully achieved (Brynjolfsson et al., 1997; Raineri, 2011).
2.2.2.1 The strategy process of the deployment of asset management
As shown, also the AM deployment can be conceptualized as a strategy process with three discrete phases. However, just like AM itself, the AM deployment can also be framed in alternative ways. Because the AM deployment is change process, it can also be captured with one of the frameworks from the field of change management (e.g. Fernandez & Rainey, 2006; Hayes, 2014; Kotter, 2007). An often cited study is for example Kotter (2007). He distinguishes eight steps to capture a successful change process: (1) establish a sense of urgency, (2) create a guiding coalition, (3) create a vision, (4) communicate the vision to convince others, (5) empower others to act, (6) generate short-term wins, (7) consolidate gains and produce more change and finally (8) anchor new approaches in the culture. These frameworks from the field of change management have also been used by authors such as FHWA (2007), de Croon (2014), Hartsema (2015) and Azagra et al. (2016) to develop a framework specifically tailored to the AM deployment. Among them, there is consensus about the first step in the AM deployment: determining the usefulness and necessity of AM. As AM can be perceived differently across functional groups, it is crucial to be coherent about what AM means to the organization and the benefits are (e.g. savings, risk reductions and efficiency gain). The organization can communicate this to the stakeholders and ensure that each understands and supports the proposed AM deployment. As a second step, de Croon (2014) and Hartsema (2015) propose to use one of the many available AM maturity models (e.g. IAM, 2014b; Mahmood et al., 2015; Volker et al., 2011) to analyze the current situation. An assessment helps to provide a normative description of good practices, identify the organization’s strength and weaknesses, raise awareness, prioritize actions and it helps to build consensus regarding the organization’s AM maturity
is needed for a good AM. Another drawback with maturity assessment models is that they
examine the way in which the organization’s AM activities, procedures and systems are organized; and not how AM contributes to organizational performance (Attwater et al., 2014). The need to assess the performance of good AM will be addressed in Section 2.2.3. Subsequently, authors state that the change needs to be planned and designed (de Croon, 2014; FHWA, 2007; Hartsema, 2015). After generating the buy-in from key stakeholders, the organization can demonstrate its commitment by defining and formalizing the AM policy and business value matrix (Hartsema, 2015; IAM, 2014a). The AM policy states the high level principles and intentions by which the organization aims to apply AM and manages it assets (IAM, 2014a). As the AM policy is usually formally signed off by those working at the
top of the organization, it demonstrates the organization’s commitment to AM and can be an important catalyst (Austroads, 2013; IAM, 2008a; ISO, 2014; Ruiter, 2015; van Grunsven, 2012). Moreover, the change can be further planned by designing the AM operating model and defining the process outputs, tasks, responsibilities and information requirements. Finally, this step could be used to conduct some pilots to test everything and demonstrate the benefits of AM (de Croon, 2014; FHWA, 2007; Hartsema, 2015).
After the change is designed, the actual AM deployment can start with the full scale roll out of the operating AM model and employees that learn to work with it. Apart from the organizational, process, information system and architecture implementation; this phase is also characterized by the buildup of capabilities and changes in the organizational culture. When AM is embedded, the phase of continual improvements can start in which the change process can followed over and over (Azagra et al., 2016; de Croon, 2014; Hartsema, 2015).
2.2.3 Strategy control: information and performance management
Both AM and AM deployment consist a strategy process with a strategy control phase. Information and performance management are key aspects in this. They help to communicate, justify, promote, evaluate, control and learn from decisions, motivate people, celebrate achievements and eventually improve performances of the assets and the deployment of AM (Azagra et al., 2016; Behn, 2003). Information management is about using technology and techniques to collect, verify and consolidate data and to transform it into relevant information in the right format, at the right time and sent to the right person (Anand et al., 1998; Fairer-Wessels, 2014; IAM, 2008a; ISO, 2014; Rowley, 1998).
Performance management is used to measure and close the gap between the planned and realized objectives (IAM, 2008a; ISO, 2014). Performance management is relevant within this study because alignment between strategic decisions and operational actions can only exist if the performance measures dynamically linked (derived from) organizational objectives (Neely et al., 1994). After all, “What you measure is what you get” (Kaplan & Norton, 2005a, p. 172). Only with a balanced and limited set of measures, managers and employees can get a full overview of the performances, set meaningful targets and get the right signals for aligning and focusing their efforts (Kaplan & Norton, 2005a; Neely et al., 1994). The balanced set of measures could contain a mix of for example financial, non-financial, objective, subjective, quantitative and qualitative, short term and long term, lagging and leading measures (IAM, 2008b; Schraven & Hartmann, 2010). Otto & Ariaratnam (1999) define 4 other types: input, process, output and outcome measures. As their names say, input and process measures capture respectively the resources allocation and the performance of the actual daily operations (e.g. number of incidents). Output measures describe the result that is achieved directly after an action is executed (e.g. resources spent and number of constructed fish passages). The outcome measures capture the actual effects of actions. They are measured after tasks have been performed and the output has settled in (e.g. the fish population growth due to the fish passage)(Otto & Ariaratnam, 1999). For the performance measurements, there are differences between AM and the AM deployment. The previous Sections about AM have already briefly described how aaset inspections and measurements of the asset performances should form the rationale for the management of assets. According to Attwater et al. (2014), measuring these asset performances and conditions is, although challenging, a relatively well-understood domain. At the other side, there are the performance measurements of the management of assets
the conceptual framework, one can see that these measurements of the AF strategy process form the input and trigger of the OF strategy process. So, the measurement results of the management of assets can form a reason to start deploying AM. Attwater et al. (2014) concluded that academic research and industrial practices have paid little attention to measuring the performance of the management of assets. According to them, also the AM maturity models that are often used within the industry cannot fill in this research gap. The key drawback of these models is that they evaluate AM capabilities based o best practices, but they do not measure the performances (Attwater et al., 2014).
2.2.4 Contextual variables
As shown in the conceptual framework, the strategy processes of the management of assets and the AM deployment are affected by contextual variables. These variables (human resources, organizational culture and other aspects) are discussed in this Section.
2.2.4.1 Human resources
First of all, multiple authors have recognized the importance of leadership within the concept of AM (FHWA, 2007; Hodkiewicz, 2015; IAM, 2014a; ISO, 2014; Volker et al., 2011; Woodhouse, 2007). To conduct AM, top managers and other relevant leaders should lend their authority to create and promote the objectives and strategies and align the organization to prevent conflicts in perspectives and priorities (Hodkiewicz, 2015; IAM, 2014b). Within the AM deployment, leadership is more about maintaining the momentum within the change process. Here, top management has to use its leadership to promote their vision on AM, generate the buy-in from key stakeholders, define responsibilities and provide the resources that are necessary for the change process (Austroads, 2013; IAM, 2014a).
Secondly, there is consensus that the benefits of AM can only be fully realized if the employees are aware and competent (e.g. Austroads, 2013; ISO, 2014; Moon et al., 2009; Woodhouse, 2007). In case of awareness, the people involved have knowledge about the strategy, objectives, the current internal context and their within this greater picture (IAM, 2008a; Moon et al., 2009). For the AM deployment, one could also refer to the sense of urgency and the true ownership of AM. Although the importance of competence management for AM is acknowledged by many authors (e.g. Austroads, 2013; IAM, 2008a, 2014a; ISO, 2014; Wijnia & Herder, 2010), there is no agreement on the required set of competences. However, as AM is an interdisciplinary approach, it is certain that an organization needs a large range of skills (from management/business to technical skills).
2.2.4.2 Organizational culture
Although many acknowledge that the organizational culture has a profound effect on the management of assets (Austroads, 2013; Azagra et al., 2016; IAM, 2008a), very little is known about this relationship and what kind of culture is required to execute AM (van Grunsven, 2012). Van Grunsven (2012) is one of the first that tried to solve this research gap. However, he discovered that there is no one size fits all culture for AM as the
preferable organization’s cultural values are related to the organizational objectives (van Grunsven, 2012). Nevertheless, based on the findings of Grunsven (2012) and previous Sections, it is possible to already provide a first indication about a favorable cultural profile for AM. In general, AM requires a culture that contains/values:
• Objective- and value-driven mentality.
• Collaboration and shared priorities between various organizational units.
• Instead of solely focusing on expenditures (the easiest parameter), organizations should also pro-actively control performances and risks. Measurements and inspections should therefore be seen as value adding activities, not as obligations. • To a certain extent structure and bureaucracy. Standardization, predictability and a
systematic and rational planning process are important core values within AM. • Life cycle approach in which people are aware of short-term and long-term effects. • System thinking. Value is created in a system context, not by isolated discrete
assets. One should take this into account during analyses and optimizations. • Continual improvements. AM should be supported by a culture in which the PDCA
It is the task of top management to proactively shape the organizational cultures that is both conducive to AM thinking and tailored to the specific AM objectives (IAM, 2014a). However, this a significant obstacle. It requires changes in the unconscious underlying assumptions of people that are very hard to change (FHWA, 2007; Schein, 2010; van Grunsven, 2012).
2.2.4.3 Other organizational aspects
Another aspect that is marked as relevant for AM and the AM deployment is the organizational structure (Amadi-Echendu et al., 2010; Austroads, 2013; FHWA, 2007; IAM, 2008a, 2014a; ISO, 2014). A structure that creates compartmentalized functions, responsibilities, priorities and performance measures can constrain the organization in a number of key characteristics of AM (e.g. life-cycle approach, optimization of activities, interdisciplinary, objective-driven). Moreover, the organizational structure can affect the success of the AM deployment. Challenges can arise in the deployment when AM is positioned wrongly within the organization chart (Amadi-Echendu et al., 2010; IAM, 2014a). When the people responsible for the AM deployment lack the authority to act strategically and when there is also no explicit accountability in senior management; it becomes difficult to drive AM across departments, into front line services and the supply chain. In such a scenario, the AM deployment may deliver incremental benefits but stays within a limited part of the organization (IAM, 2014a).
Finally, there is the interaction between the AM and other management systems and approaches (e.g. quality, environment, HR, health and safety and general risk management). To avoid conflicts and improve the synergy between them, multiple authors point to the importance of improving the integration across different disciplines (Austroads, 2013; IAM, 2008a; ISO, 2014; Wijnia & Croon, 2015). According to ISO (2014), the interaction with other management systems should already be recognized when AM is deployed. By aligning the AM deployment with existing management systems and other developments, there will be a higher willingness to adopt AM and lower efforts and expenses for creating and maintaining the operating model.
2.3 Internal strategic alignment
Section 2.2 introduced AM and the deployment process of AM. This provided some indications about favorable configurations of the strategy processes and the contextual variables. However, the Section did not explicitly mention the necessary conditions for the two types of internal alignment. As stated before, this is because AM research and standards do agree upon the importance of internal alignment, but have paid scant attention to an in-depth study (e.g. Austroads, 2013; FHWA, 2007; IAM, 2008a; ISO, 2014; Moon et al., 2009; Schraven et al., 2011; Wijnia & Herder, 2010; Wolbers, 2012; Woodhouse, 2007). Section 2.3 will fill in this research gap by importing knowledge from strategic management literature. By doing this, Section 2.3.1 will provide a definition for strategic alignment that is suited for the focus of this study. Section 2.3.2 will identify the necessary conditions.
2.3.1 Defining internal strategic alignment
2.3.1.1 Introduction
Strategic alignment is rooted in the contingency theory and consistent with the open system perspective (Acur et al., 2012). The primary proposition is that the organization’s performance is the result of fit between two or more factors, such as the organization’s
performance, the environment, culture structure, systems, technology and other resources (Bergeron et al., 2004). Often, literature distinguishes two types of strategic alignment: internal and external alignment (Beer et al., 2005; Ouakouak & Ouedraogo, 2013). External alignment refers to the fit between the organization’s strategy and the external environment which contains multiple threats and opportunities. As stated in the footnote of p.9, this research is mainly interested in the internal strategic alignment.
According to Ouakouak & Ouedraogo (2013), internal alignment refers to the alignment
between the organization’s strategy and internal factors such as the organizational
structure, management system, organizational culture, human resources and leadership style. Earlier in this Thesis, these factors were referred to as contextual variables of a
organization in the execution of the strategy (Beer et al., 2005). Andrews et al. (2012) defined the internal alignment slightly different and looks to the vertical alignment. According to them, internal alignment refers to the degree to which strategies, plans, performance indicators and actions are consistent across different organizational levels.
Nevertheless, various authors acknowledged that that alignment is evolutionary and describes a process of continuous adaption (Bradley et al., 2013; Henderson & Venkatraman, 1993). Strategic alignment is a goal that can never be completely reached (Roelfsema, 2014). Dynamics within the internal and external environment require changes in the strategy and may have to be followed by changes in the vertical alignment and some contextual variables. Internal alignment is therefore related to external alignment.
2.3.1.2 Strategy process
Roelfsema (2014) linked internal alignment with the strategy processes. According to her, alignment means that the phases of strategy formulation and implementation are conducted successfully and form an intertwined and continuous process. With this last part, it is meant that the two phases are dynamically linked and there is no strict discrete division/transition moment between the two. The strategy formulation is successfully conducted when there is a clear and, indisputable and realistic objective and strategy that can guide the organization. This means that employees understand what needs to be achieved, how this can be achieved and why this is needed (Bradley et al., 2013). Successful implementation is about coherently translating the strategy into short-term goals, plans and actions (Beer et al., 2005; Roelfsema, 2014). An organization fails in this when it conducts actions that deviate from the pre-defined strategies and that do not contribute to the organization’s objectives.
2.3.1.3 Outcomes of internal strategic alignment
There are several authors that described favorable outcomes of internal alignment (e.g. Acur et al., 2012; Andrews et al., 2012; Avison, Jones, Powell, & Wilson, 2004; Beehr, Glazer, Fischer, Linton, & Hansen, 2009; Beer et al., 2005; Bergeron et al., 2004; Henderson & Venkatraman, 1993). Their arguments often rely upon the statement that alignment involves the true ownership of organizational plans and a shared understanding and behavior throughout the organizational hierarchy (Boswell & Boudreau, 2001).
Andrews et al. (2012) combined this with the principal-agent theory. According to them, the problems of goal conflicts and information asymmetry are mitigated by strategic alignment. The employees involved hold similar values and implement the strategic decisions as given rather than transform it into something else. With this improved cooperation, the organization can lower the transaction costs and has less reason to rely heavily on the chain of command and the monitoring of subordinates. Moreover, top management can delegate more key decision making tasks to lower organizational levels (Andrews et al., 2012). Beehr et al. (2009) mentioned three other beneficial outcomes: greater job satisfaction, organizational commitment and lower turnover. According to Avison et al. (2004), alignment also results in improved return on investments as it increases the likelihood of successfully developing and maintaining systems and assets that are critical to the organization.
Avison et al. (2004) concluded that the improved understanding of employees about the internal context helps the organization to quickly react on dynamics within the external environment. However, Andrews et al. (2012) and Avison et al. (2004) also warn that too much alignment and shared values can result in group thinking and the inability to critically reflect on the organizational strategy and to generate new ideas. Instead of promoting flexibility, alignment could than result in a rather static organization.
2.3.1.4 Internal strategic alignment within this Thesis
management of assets and the AM deployment. Internal strategic alignment is (1) the consistency in the strategy process between the objectives, strategies, performance measures, plans and operational actions that are spread across the organization and (2) the consistency with contextual variables that affect the strategy process (human resources, organizational culture and other organizational aspects). This consistency within the strategy process should be reflected in both the top-down (the objectives and strategies form the rationale for operational actions) and bottom-up direction (the outcomes of operational actions provide the factual basis for adjustments in objectives and strategies).
2.3.2 Necessary conditions for internal strategic alignment
2.3.2.1 Analytical framework
This study takes advantage of the existing findings from the field of strategic management to identify the necessary conditions for internal strategic alignment. As stated, this Thesis focus on the alignment in both the management of assets and the AM deployment. Especially the study of Roelfsema (2014) demonstrates to be useful for this Thesis. In line with many other studies (e.g. Bradley et al., 2013; Economist Intelligence Unit, 2004; Hrebiniak, 2006; Kaplan & Norton, 2005b; PwC, 2014), Roelfsema (2014) concluded that striving for strategic alignment can be a difficult task. Based on this problem recognition, Roelfsema (2014) studied the variables that constrain and enable alignment. Roelfsema (2014) start by analyzing and ranking the findings from literature. The list of constraining factors was based on the studies of Steiner (1979), Alexander (1985), Beer & Eisenstat (2000), Hrebiniak (2006), Corboy & Corrbui (2007), Thompson & Martin (2010), Elquist LoRé (2012) and Ali & Hadi (2012). For the enablers, she studied Dobni (2003), Luftman (2003), Higgins (2005), Neilson et al. (2008), Li et al. (2010) and Vagadia (2013). Based on this literature review, Roelfsema (2014) concluded that enablers and inhibitors are often the two different sides of one and the same variable. Therefore, Roelfsema (2014) derived 4 new constructs (each containing variables) that influence strategic alignment (see appendix A). Roelfsema (2014) translated these constructs into a survey to test her model. According to the 175 surveys that were completed by various organizations, there are significant relationships between each of these 4 constructs and strategic alignment.
This Thesis will use the findings of Roelfsema (2014). However, her findings will not be simply adopted. Her categorization of variables into the four constructs raises some questions (the constructs overlap and some variables could be categorized differently) and was not tailored for the context of AM. Therefore, the findings of Roelfsema (2014) are combined with the findings of Section 2.2 to derive a new analytical framework. Instead of talking about enables and constraints, the new framework refers to necessary conditions. The new analytical framework consists two parts. The first part addresses the alignment within the management of physical assets (i.e. AM is a concept that can help to achieve this). In the second part, the focus is on the alignment in the AM deployment.
Within each part, alignment is the dependent condition and can be measured by the extent of successful strategy formulation and implementation. Similar indicators were used by Roelfsema (2014). The necessary conditions for strategic alignment are the independent variables. They have to be met in order to successfully complete the phases of strategy formulation and/or strategy implementation. Because the two strategic approaches have different focus points, there are some differences in their necessary conditions.
The necessary conditions for alignment in the management of assets are shown in Table 1 (p. 29). This is discussed in Section 2.3.2.2 (the conditions are underlined). The necessary conditions for the alignment in the AM deployment are shown in Table 2 (p. 30) and discussed in Section 2.3.2.3. For both Sections, a distinction is made between the necessary conditions in the strategy process and the contextual variables.