University of Warwick institutional repository: http://go.warwick.ac.uk/wrap
This paper is made available online in accordance with publisher policies. Please scroll down to view the document itself. Please refer to the repository record for this item and our policy information available from the repository home page for further information.
To see the final version of this paper please visit the publisher’s website. Access to the published version may require a subscription.
Author(s): Frances O’Brien
Article Title: SUPPORTING STRATEGY: A SURVEY OF UK OR/MS PRACTITIONERS
Year of publication: Submitted paper Link to published version:
Submitted to The Journal of the Operational Research Society http://www.palgrave-journals.com/jors/index.html
SUPPORTING STRATEGY: ASURVEY OF UKOR/MSPRACTITIONERS
Frances O‟Brien Warwick Business School
Submitted to: The Journal of the Operational Research Society December 2009
Please note this is a pre-print version of the paper.
Abstract
This paper reports the results of an on-line survey conducted with practitioner members of the UK Operational Research (OR) Society. The purpose of the survey was to explore the current practice of supporting strategy in terms of activities supported and tools used. The results of the survey are compared to those of previous surveys to explore developments in, inter-alia, the use of management/strategy tools and „soft‟ Operational Research / Management Science (OR/MS) tools. The survey results demonstrate that OR practitioners actively support strategy within their organisations. Whilst a wide variety of tools, drawn from the OR/MS and management / strategy fields are used to support strategy within organisations, the findings suggest that soft OR/MS tools are not regularly used. The findings also demonstrate that tools are combined to support strategy from both within and across the OR/MS and management / strategy fields. The paper ends by identifying a number of areas for further research.
Introduction
By way of introduction to the topic of how OR/MS can support strategy, the reader might expect that it would begin by introducing the two fields so as to set their expectations for the rest of the paper. However, such a task is not straightforward. We, in the OR/MS
community have a long history of debating the nature of OR/MS both as a discipline and as a practice (see for example: Eilon, 1980; Tobin, et al., 1980; Rosenhead and Mitchell, 1986; Fildes and Ranyard, 1997, Ormerod, 2002; Mingers, 2007); so too in the field of strategy, where a common definition of the term has been described as “illusive” (De Wit and Meyer, 2004), due to the different perspectives and classifications that exist in the literature (e.g. Whittington, 1993, Mintzberg, et al., 1998).
In this research, I adopt the definition that a strategic decision is one that exhibits a number of characteristics including:
“Breadth of scope and therefore implications right across and beyond the organisation.
Complexity and inter-relatedness of decision making context, demanding integrated treatment.
Enduring effects, possibly of an irreversible nature, with little or no scope for trial and error.
Significant time lag before impact, with widening uncertainty over the timescale involved.
Disagreement about the motivation for, and the direction and nature of, development.
Challenging the status quo, creating a politicised setting where change is contested.” (Dyson, et al., 2007, p3)
Further, this paper focuses on the strategy process, an organisational process concerned with the how, who and when of strategy (De Wit and Meyer, 2004). One particular tension in the strategy process literature concerns intended vs emergent strategy development. This tension is summarised by Johnson et al (2006): “Intended strategy is an expression of desired
the long-term direction of the organization, which develops over time, then it can be emergent rather than planned upfront.” My own experience suggests neither extreme in isolation is very helpful in describing or prescribing strategy development processes. I agree with Johnson et al (2006) who note that there “..is no one right way in which strategies are developed”, and with Grant (2006) who notes: “The strategic planning systems of most companies involve a combination of design and emergence.” Relevant to this debate is the empirical research of Hart and Banbury (1994) whose research suggests that organisations adopting multiple processes of strategy development outperform those adopting a more singular process.
So what is a strategy process? It is an organisational process consisting of a number of activities: deciding where you want to go, examining what may lie ahead, choosing between options, setting targets, planning how to move in the direction you want to and checking progress along the way (Thompson, et al., 2005). Whilst such activities are often interrelated and integrated, they do not explicitly include a forward thinking activity to reflect upon, test out and refine the ideas created. Hence in this work, I have adopted the strategic
development process of Dyson et al (2007) which extends the strategy process to explicitly incorporate reflective engagement and analytical reasoning supported by models to help assess and rehearse options. (Morecroft, 1984). Whilst it may seem that such a list of strategic activities appears analytic, it should be noted that, in line with the above definition of strategic decisions, social and political factors are often at play and are an integral
component of the activities. For example in deciding where you want to go as an
organisation, a number of different worldviews and priorities may have to be explored and negotiated before a consensus is reached and articulated as an organisational vision.
This paper furthers research in the OR and Strategy field by providing a snapshot of the current use of tools in supporting strategic development activities. The research described in this paper is a survey of practitioner members of the UK OR Society who completed an on-line survey into the strategic activities they engage in and their awareness of tools and the use of tools within their organisation. The research also explores the link between tools and activities, and how tools have been combined to support strategy. The research is relevant to both academics and practitioners. For academics, the paper updates previous research on the use of specific tools to support strategy and addresses some of the issues raised (e.g. Clark and Scott 1995, 1996, Pidd 1996). The paper is also useful for those who teach OR and Strategy as it identifies how OR/MS and other tools can be to support specific strategic activities; it also illustrates how OR/MS tools can be used in combination with strategy tools. It is these last two points that are also likely to be of interest to practitioners who currently have or intend to develop a supporting strategy capability, since the research signposts tools that other practitioners have used to support specific strategic activities.
The paper begins by exploring a number of literatures relevant to the research: previous work on OR and Strategy, the „Strategy as Practice‟ field; previous surveys describing the use of tools for supporting strategy and finally the multimethodology literature which considers how tools may be combined. The paper then outlines the objectives of the research presented here and takes the reader through the research design. The results of the empirical study are presented and followed by a discussion of the findings. The paper ends by identifying areas for further research.
OR, strategy and their practice
(Tsoukas and Papoulias, 1996), and modelling the impact of financial decisions for a government department (Calvert and Kaufman, 2008).
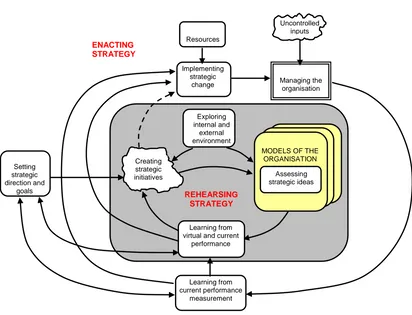
The third strategic field of endeavour for OR/MS is „strategic development support‟ which involves the use of frameworks, methods and models to support the strategic development of an organisation. It is this third strategic field of endeavour that this paper is concerned with. Figure 1 shows a framework for strategic development that has evolved from the earlier work of Dyson and Foster (1980, 1983) into the more recent versions (Dyson and O'Brien, 1998; O'Brien and Dyson, 2007). The framework identifies a number of essential elements or activities for effective strategic development:
Setting direction (vision / mission)
Setting strategic goals / objectives / targets / priorities
Assessing the external environment (eg social political, economic competitive issues)
Appraising the internal environment (eg resources, capabilities) Generating ideas for strategic initiatives / options
Evaluating strategic initiatives / options Selecting strategic initiatives / options
Measuring / evaluating organisational performance Implementing strategic decisions / strategic change
FIGURE 1 HERE
Whittington (2006) identifies three components of a conceptual framework for the „theory of strategy as practice‟: praxis, the activities involved in the development of strategy; practitioners, the actors who undertake the work of strategy; and practices or routines of the
practitioners. Whittington describes strategy practitioners as those who „do the work of making, shaping and executing strategy‟. He goes on to note that it is not only the senior executives who are strategy practitioners, but that ‟ many others perform strategy work, often as part of a wider role or a stage in their careers.‟ Part of the research agenda of the strategy as practice community is concerned with linking the „micro and macro practice‟ and includes amongst its potential research issues:
Who are the strategic actors, at what level of the firm, and in what stages of the strategy process are they engaged?...(Issue A) What are the tools, technologies, routines and procedures that practitioners draw upon in order to act strategically?...(Issue B)
(Taken from http://www.s-as-p.org/agenda.htm#origin on 5 Feb 2009)
The contribution of this paper to the strategy as practice research agenda will be demonstrated in the survey methodology section when the specific research questions addressed by this paper are defined.
for the Phase 1 or Situation Assessment tasks. Secondly the lack of use of „soft‟ approaches is noteworthy. In a viewpoint related to this paper, Pidd (1996) highlights a role for OR in making sense of strategic vision and queries lack of soft OR approaches mentioned in the responses to the survey. In their reply, the authors suggest that the approaches are still not widely known or used (Clark and Scott, 1996), a finding corroborated by Fildes and Ranyard‟s inclusion of „soft OR‟ methods as one of the „new tools‟ making a contribution to the OR group performance (Fildes and Ranyard, 1999).
In contrast to the research of Clark and Scott, Rigby and Bilodeau (2007) focus on the use of tools, rather than the activities they are used to support. The tools that are included in their regular surveys are very different to those of Clark and Scott: for example in their 2007 survey, strategic planning, customer relationship management (CRM), customer segmentation, benchmarking and mission/vision statements were amongst the most popular tools reported by executives. Some tools on this list may seem strange; strategic planning may be regarded as a whole process that employs a variety of individual tools, and mission and vision statements are the products of a visioning process.
Two more recent surveys bring together tools from both the MS/OR and management/strategy fields. The research by Stenfors et al (2007), asked Finnish executives to list all strategy tools used to support major decision-making in their companies. The most popular tool reported by executives was SWOT (Strengths, Weaknesses, Opportunities and Threats) analysis, followed by spreadsheet applications, balanced scorecard, risk analysis and analysis of financial statements/investments. Some tools more familiar to the OR community were also reported including statistical analysis, optimisation and simulation. Tapinos‟s survey of MBA alumni (Tapinos, 2005) also found that SWOT analysis was the most widely reported tool for strategy support, followed by benchmarking, cost benefit analysis, core capabilities and risk analysis. His survey had included some of the soft approaches (cognitive mapping, soft systems) but very few respondents had said they used them to support strategy within their organisations.
and soft OR/MS. Thus the regular surveys by Bain and Co (Rigby and Bilodeau, 2007) cover the uses of strategy tools by executives; the works of Stenfors et al (2007) and Tapinos (2005) cover the use of OR/MS and strategy tools by executives, though it is noticeable that these two surveys do not particularly cover soft OR/MS tools. The work of Clark and Scott (1995) covers the use of (mostly) OR/MS tools by OR practitioners. There is little knowledge about the awareness and use of strategy tools by OR practitioners. The research presented in this paper (identified as O‟Brien in figure 2) goes some way to addressing this gap in knowledge by providing a snapshot of the current awareness of tools by OR practitioners and insight into the use of tools in supporting strategic activities.
INSERT FIGURE 2 HERE
INSERT TABLE 1 HERE
A final literature relevant to the research presented here concerns how tools can be combined, or multimethodological approaches. Amongst the theoretical topics found in the literature is the issue of incommensurability which needs to be considered when tools based on different paradigms and underlying assumptions are combined (Mingers, 1997). However,
Ackermann et al (1997) suggest that few practitioners or academics become experienced in using both qualitative and quantitative approaches. Other authors explore the issue of how tools might be combined and propose a number of possible frameworks eg in series or in parallel (Pollack, 2009), or through addition, enrichment or integration (Bennett, 1985) It is the author‟s own experience in creating a participative visioning methodology (O'Brien and Meadows, 2007) that tools (in whole or in part) can be used or combined in a form other than their original one. Thus tools can be used or combined in modified and / or their original form, where modifications are tailored to the intervention in question (see for example Moullin‟s modification of the balanced scorecard for use in the public sector - Moullin, 2009).
were in single paradigmatic form eg simulation with forecasting or cognitive mapping with SSM. Of relevance to this research, there were some instances where tools from both hard and soft OR were combined with management / strategy tools (statistical analysis, SWOT analysis, SSM), though the authors note that the vast majority of combinations of three tools were within a single paradigm. Within the literature, examples of practice are documented where tools are combined for supporting strategy: Brady has written about his experiences combining Porter‟s five forces with SSM (Brady, 2008); others have written about the theory (Goodwin and Wright, 2001) and practice (Montibeller, et al., 2006) of combining scenario planning with MCDA; Bryant et al (2007) describe their experiences with student groups combining drama theory, system dynamics and scenario planning to explore the future of the UK fishing industry.
In summary, this section has reviewed a number of literatures relevant to the research presented in this paper. It identified three fields of endeavour for OR and strategy, noting that the stream called „strategic development support‟ is the focus of this research. It summarised two research issues from the strategy as practice community (strategic actors and tools used) that were used to shape the research questions identified in the following section. It then reviewed a number of surveys of tools used to support strategy, noting that the surveys had varying coverage of tools from three groups (OR/MS. Management and strategy, and soft OR/MS), that warrants updating. Finally it considered the literature concerning how tools were combined, noting that little is known about how tools are combined in supporting strategy in practice. This next section outlines the research questions adopted for the research presented here.
Research questions
The overarching research question addressed by the study reported in this paper can be summarised as: “What is the current practice of supporting strategy in terms of activities supported and tools used?”
For the purposes of the research, this question was further broken down into the following: 1. What is the involvement of practitioners in supporting strategy?
3. Are specific tools used to support particular activities? 4. How are tools combined / adjusted in supporting strategy?
How do the above research questions address the research agenda of the strategy as practice community? Before answering this question, the issue of the unit of analysis needs to be established. In choosing the unit of analysis to address issues A and B and the four research questions above, three choices are apparent: the practitioner, the tool and the strategic activity. Question 1 above addresses Issue A, where the unit of analysis is chosen as the practitioner who is assumed to be an OR practitioner by virtue of their membership of the Society, or their known involvement in OR activities. Specifically, the unit of analysis is the OR practitioner who sees him or her self as undertaking work related to strategy in some form or other. Some of this community may indeed be the decision makers whose ultimate responsibility it is to make strategy; others perform a supporting role, providing help to the decision maker (eg Ormerod, 1996) as is characteristic of the OR profession.
Questions 2 and 4 address issue B (what are the tools…that practitioners draw upon in order to act strategically?). Here, I have chosen the „tool‟ as the unit of analysis, since to focus on the individual may not generate the fullest picture of current tool use in supporting strategy. Some individual practitioners develop one „strand of practice‟ (Corbett, et al., 1995) specialising for example in particular tools or classes of problems. Thus where an individual is part of a group/team supporting strategy within their organisation, there is the potential that some tools may be missed, particularly if colleagues specialise in different strands of practice at the tool level. To overcome this, when it came to tool use, the survey asked respondents to report the tool use by themselves or their group / team; they were however asked to report their personal awareness of each tool, rather than that of their group / team.
Finally, question 3 addresses both issues A and B by linking tool use to activities. Here, the unit of analysis is the activity. Thus, the survey firstly asked respondents to identify the activities supported by themselves or their group/team. The survey then asked respondents to link a selection of tools (explained below) to specific strategic activities.
To address the research questions, a survey was designed covering four sections:
Section 1: The respondent‟s role in supporting strategy within their organisation; Section 2: Tools used individually and in combination to support strategic development;
Section 3: Tools used in relation to strategic activities,
Section 4: Background information on the respondent and their organisation
Section 1 asked respondents to identify their involvement in supporting strategy and which particular activities were supported by themselves or their team/group. Section 2 asked respondents to identify their own awareness of specific tools and the regularity with which they or their group / team used them. Section 2 also asked respondents to identify any tools that were either combined or modified by themselves or their group/team. Section 3 asked respondents to select three tools most regularly used to support strategy within their organisations and to indicate which activities the tools were used to support. Section 4 asked for some background information on the respondents and their organisation such as the size of their organisation and its industry sector.
The survey was developed and made available on-line at a password protected site. Practitioners were invited to participate in the survey by email. The survey consisted of a mixture of open questions allowing free-text responses and closed questions requiring responses to be selected from a 7 point semantic differential scale (Oppenheim, 2006), involving two opposite characteristics in between which respondents placed their responses.
The respondent‟s role in supporting strategy was captured by asking them to choose a description which they felt best captured their own involvement in supporting strategy within their organisation, ranging from „I am the strategic planning manager‟ to „I am aware of the strategy process‟. In addition, they were asked to identify which specific strategic activities their or their team/group‟s work supported. A list of possible activities was provided (Dyson and O'Brien, 1998; O'Brien and Dyson, 2007); an „other‟ category allowed respondents to add their own description of activities if necessary.
the use of soft tools, the work of Rosenhead and Mingers (2001) and Munro and Mingers (2002) was used to update the list of possible soft tools and to include tools which may be combined using a multimethodological approach. The resulting set, shown in Appendices 1 - 3 consisted of 52 tools divided into three groupings: OR/MS, management / strategy and soft OR/MS.
An important issue for this research was how to design the questions focussing on activities supported and tools used. Rigby and Bilodeau (2007) had focussed on tool use and awareness whereas Clark and Scott (1995), Stenfors et al (2007) and Tapinos (2005) focussed on strategic activities supported. This research has adopted elements of both approaches since the research questions concern both tool use/awareness and the strategic activities supported by tool use. To address the issue of tool awareness, the survey allowed respondents to indicate whether they had not heard of a particular tool. To address tool use, respondents were asked to indicate the regularity of use of specific tools by themselves or their group / team. To demonstrate which activities were supported by tool use, respondents were invited to select the three tools most frequently used by themselves or their group /team and to relate their use of each tool to the selection of strategic activities identified in the strategy process contained in Figure 1. A final section in the survey asked respondents to identify which tools were combined in supporting strategy by themselves or their group / team.
The survey sample and respondents
The survey was piloted with a small group of practitioners and some minor modifications were made to the explanations given for specific sections of the survey.
An adhoc sample (Munro and Mingers, 2002) was used which consisted primarily of UK OR
of UK OR practitioners‟ (Ormerod, 2004; Munro and Mingers, 2004), thus those who held full-time academic posts were excluded from the research. In total this generated some 883 email contacts each of whom were sent a personalised invitation to complete the on-line survey. 117 bounced emails and 45 declining responses were received, leaving some 760 potential responders. Of these, 143 completed responses were received, 8 of which were deemed unusable due to the number of blank responses, thus the sample to be analysed in this paper consisted of 135 respondents. Of these, 18 identified their organisation as being located in a non-UK country, with seven from Europe, four from the USA, three from Australia/New Zealand, two from Africa, one from the Middle East, one from central America; finally, the location of one respondent‟s organisation was not stated
Respondents represented a variety of sectors, as can be seen in Figure 3. The two largest groups of respondents came from the public sector (27%) and the Financial Services sector (12%).
INSERT FIGURE 3 HERE
Figures 4 and 5 show the size of organisations that respondents came from, in terms of number of employees and turnover respectively. Clearly most of the respondents to the survey came from larger organisations. In Figure 5, all but one of the blank responses had identified their sector as „government/other public‟.
INSERT FIGURE 4 HERE INSERT FIGURE 5 HERE
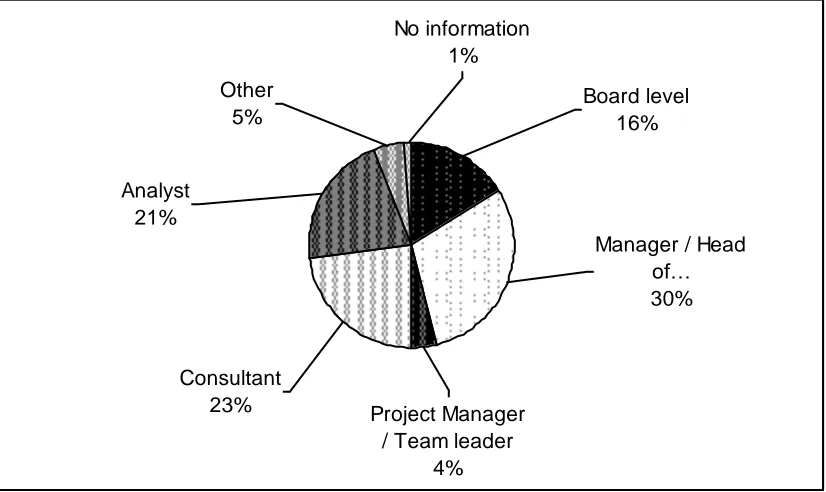
Respondents were asked to identify the position that they held within their organisation. Figure 6 shows that the sample was evenly split between senior management and consultant grades; 46% of the respondents described their position as board or management level within their organisations, and 44% described themselves as analysts or consultants.
INSERT FIGURE 6 HERE
The involvement of practitioners in supporting strategic activities
Respondents were asked to identify the nature of their own involvement in strategic development within their organisations; categories of involvement included: head of the strategic planning team, member of the strategic planning team, contributing to the strategic planning process, contributing to strategic projects and aware of the strategic planning process. Figure 7 shows that 24% of respondents claimed direct involvement in strategy development either being head of the strategic planning team or one of its members. Respondents were more likely to see themselves as contributing to the strategy process or strategic projects.
INSERT FIGURE 7 HERE
Table 2 shows the range of strategic activities supported by declared level of involvement. Respondents were asked to indicate the level of their (or their team/group‟s) involvement on a seven point semantic differential scale where 1 signified „We never undertake nor provide support for the activity‟ and 7 signified „We regularly undertake or provide support for the activity‟. The median scores demonstrate that the full range of strategic activities are
supported, from setting direction through to implementation. However, the type of activities supported can clearly be seen to vary with the level of involvement in supporting strategy; the greater the level of involvement, the more regular the support provided to different strategic activities.
INSERT TABLE 2 HERE
The awareness and use of tools in supporting strategy
there was an „other‟ category, where respondents could enter the names of tools not included in the list that were used to support strategy.
A number of questions can be explored with this data, some of which are assessed here: How does awareness of tools vary across tool groups?
Which tools are reported as being most / least regularly used in each of the three tool groups (OR/MS, management / strategy, soft OR/MS)?
Is there any difference in reported tool use between the public and private sectors? Does tool usage vary with declared involvement in the strategy process ie are strategic planning managers / members of the strategy team more likely to be associated with regular use of some tools compared to those who are not so closely involved in strategy?
Of the 23 OR/MS tools, there was generally good awareness with over 75% of the respondents having heard of 20 of the tools. For the three remaining tools (agent based models, real options analysis and yield management), the proportions of respondents who had never heard of the tools were 50.37%, 49.63% and 21.48% respectively. At the other extreme, we can deduce that the whole sample of 135 respondents had heard of five tools (cost benefit analysis, data mining, forecasting, project management and statistical analysis).
Of the three tool groups, the picture for soft OR/MS tools in the „never heard of‟ category is perhaps the most bleak. Heading the list were morphological analysis of which 71.11% of the respondents reported that they themselves had never heard, followed by SAST (66.67%), drama theory (51.85%), hypergaming (51.85%) and the strategic choice approach (39.25%). For the two main „soft‟ OR approaches (cognitive mapping and SSM) the picture was much better, with respondents reporting that they themselves had never heard of the tools in the proportions 8.15% and 12.59% respectively.
Across all three tool groups, the tools with the highest usage scores were financial analysis and project management each of which received median scores of 6 (out of 7) indicating that these are the tools most regularly used to support strategy by practitioners. The pattern of reported use varies considerably across the three tool groups, with the OR/MS tool group showing a higher usage profile than the management / strategy tool group, which in turn shows a higher usage profile compared to the soft OR/MS tool group.
Within the OR/MS tool group, four tools received a median usage score of 5 (cost benefit analysis, forecasting, risk analysis, statistical analysis). At the other extreme, seven tools received a usage score of 1, suggesting that for this sample of practitioners, such tools are considered never to be used in supporting strategy; the tools included agent based models, credit scoring models, DEA and yield management. Within the management / strategy tool group benchmarking and brainstorming were reported as the most regularly used tools, each receiving a median score of 5. Six tools, including SWOT analysis, received a median usage score of 4; two tools received a usage score of 1 (delphi technique and six sigma). Within the soft OR/MS tool group, influence diagrams and stakeholder analysis received the highest reported usage median score of 3, four received a median score of 2, including cognitive mapping and SSM. The remaining five tools each received a median usage score of 1 (drama theory, hypergaming, morphological analysis, Strategic Assumption Surfacing and Testing - SAST and the strategic choice approach).
INSERT TABLE 3 HERE
is split according to the three tool groups. The majority of tools within this table show a difference in usage score of only one between the two sectors. Of the 14 OR/MS tools in this table, seven are reported as being more regularly used to support strategy in the private sector compared to the public sector, noticeable is capital investment appraisal which received a median score of 5 from private sector respondents compared to a median score of 3 from public sector respondents. The seven OR/MS tools reported as being more regularly used in the public sector included statistical analysis, MCDA and simulation. In terms of proportions of the two segments who had never heard of a tool, the patterns are quite similar, with any variation typically being within +/- 10%; two exceptions are DEA where double the proportion of private sector respondents had not heard of the tool compared to the public sector, and MCDA where the multiply is threefold. In both these cases, it is interesting to note that the average reported use is higher in the public sector compared to the private sector.
For the management / strategy tools, six of the seven tools were reported as being more regularly used in the private sector, with CRM noticeably receiving a median score of 4.5 for the private sector compared to a median score of 2 for the public sector. The one tool in this group that was reported as being more used in the public sector was resource based planning. In terms of tool awareness in this group, one might expect that awareness levels followed usage patterns. This is true for CRM, portfolio matrices and value chain analysis which are each better known by private sector respondents. However in the case of resource based planning, the situation is reversed; the usage is higher amongst the public sector respondents who also have less awareness of the tool compared to the private sector respondents.
for the strategic choice approach which received a median score of 1 in both sectors the proportions were 44.87% and 31.37% respectively.
Finally we turn to the issue of whether tool usage patterns vary according to the declared level of involvement in strategy. The results suggest that increasing involvement in the strategy process often goes hand in hand with more regular use of a tool; a somewhat unsurprising finding, since such people are likely to have the greatest exposure and opportunity to use tools to support strategy. This result is noticeable particularly amongst some of the classic management / strategy tools such as portfolio matrices, Porter‟s five forces, and PEST analysis. In contrast, there are some OR/MS analytic tools (eg data mining, simulation and statistical analysis) where there appears to be an inverse relationship between level of involvement in strategy and tool usage.
How tools are used to support particular strategic activities
Respondents were asked to list the three tools most frequently used to support strategy, and, for each tool, to indicate which activity or activities the tool was used to support; the survey limited participants to three tools due to time and space constraints – to have invited such an analysis for all 52 tools would have made the survey too cumbersome. In total, 110 of the 135 respondents listed some 303 tools to support 1099 activities. The results can be analysed taking different combinations of three perspectives: activity, tool and practitioner.
INSERT TABLE 4 HERE
Focusing on how practitioners support the activities using tools, Table 4 shows the distribution of tool use across the 1099 reported strategic activities. The activity most supported by tools is that of „evaluating strategic options‟ (15.56% of total activity) followed by „measuring performance‟ and „assessing the external environment‟. The least „tool-supported‟ activity is setting strategic direction (7.64%) followed by „implementation‟ (8.55%) and „generating options‟ (8.83%).
frequently linked to specific activities with 23, 22, 21, 20 and 19 respondents respectively linking them to specific activities. Within the management / strategy tool group, brainstorming, SWOT analysis and the balanced scorecard were the tools most often linked to specific activities, with 15, 12 and 10 responses respectively. Within the soft OR tool group, stakeholder analysis, SSM and cognitive mapping / Decision Explorer were linked to specific activities by three respondents each. Table 5 demonstrates that the relationship between tool and activity is not a one-to-one mapping – different tools can be used to support a variety of activities. However, it could be argued that some tools were more often used to support specific activities, for example simulation was mostly used to evaluate and select options, and brainstorming was most often used to set direction and goals and to generate options.
INSERT TABLE 5 HERE
Table 5 also shows which tool was most often reported as being used to support specific activities; for each activity, the tool with the highest count has been highlighted. For example setting direction was most often reported as being supported by brainstorming and forecasting. Evaluating options was reported as being supported by a variety of tools including financial analysis, simulation, cost benefit analysis and statistical analysis.
What is not clear from Table 5 is HOW some of the tools reported were used to support the activities they are related to, for example how can statistical analysis support direction setting? This is an issue that requires further research.
INSERT FIGURE 8 HERE
How tools are combined/ adjusted in supporting strategy
One of the final questions of the survey was an open-ended question which asked respondents to give brief details of the tools most often adjusted, combined or created by themselves or their group/team.
56 respondents (41.5% of the total respondents) highlighted a total of 65 instances of tools being combined, adjusted or created to support strategy. It should be noted that some respondents indicated more than one grouping of tools that were used. 12 respondents reported the adjustment of individual tools, including two responses indicating that statistical analysis was adjusted. As this was an open-ended question, some respondents included some comments, though the vast majority simply listed tool names. For example one respondent, rather than naming any specific tools, commented that they adopted a „total mix and match approach depending on the project and circumstances and resources available.‟, whilst another commented that „….I have absorbed so many different techniques that I can not now remember their origins.‟ A further respondent noted that „software often forces you to use methods and combination of methods in ways that may be different.‟
The most commonly reported number of tools combined was 2 with 41 instances reported. The pairings of tools are shown in Table 6 – the order of the tools listed simply replicates the order that respondents entered the tool names in the survey, ie no methodological ordering is intended by the style of presentation. Scenario planning, simulation and SWOT Analysis were each listed as the first tool in 10 separate instances. The most popular combination of tools was scenario planning and simulation with 6 instances reported. SWOT and PEST analysis was the next most popular pairing with 4 instances reported. Table 6 demonstrates that tools are combined both within a tool group (eg simulation with statistical analysis, or SWOT analysis with Porter‟s five forces) and across tool groups (eg simulation with cognitive mapping or system dynamics with Porter‟s five forces); there is also evidence of multi-paradigmatic combinations (eg SWOT analysis with statistical analysis).
Eight respondents reported that 3 tools were combined in supporting strategy, two reported the use of four tools and one reported the use of five and six tools; the tools are listed in Table 7. If the ordering of the tools is ignored in Table 7, then system dynamics is the most frequently combined tool with five appearances, closely followed by simulation and scenario planning with four and three appearances respectively. Some combinations of three or more tools were from within the same tool group (eg Scenario planning, SWOT and PEST analysis or multi criteria decision analysis - MCDA, System dynamics and simulation), whilst other groupings came from across the tool groups (eg SSM, system dynamics, balanced scorecard, or MCDA, CRM and resource allocation).
A handful of respondents reported that more than one combination of tools was used; their responses showed some variety in terms of the three tool groups covered. For example, one individual reported that SWOT and PEST analysis were combined on the one hand and SSM and project management on the other. For another individual who reported the use of SWOT and PEST analysis, their second combination was business case analysis with forecasting. One respondent reported three groupings: brainstorming with cognitive mapping, project management with another unnamed tool and scenario planning with simulation. Another individual highlighted four combinations: Forecasting and project management, influence diagrams and forecasting, risk analysis and forecasting and SWOT analysis with brainstorming. It should be noted that the above multiple combinations cannot necessarily be associated with an individual‟s use since respondents could report the tools combined by themselves or their team/group.
INSERT TABLE 7 HERE
Discussion
It seems reasonable that those who chose to respond to the survey self-selected themselves given an interest or involvement in strategic development, for example very few respondents rated themselves as only „aware‟ of the strategy process – had they been actively involved in some way they would have classified themselves accordingly. Given that the nature of this research is exploratory, this is not perceived to be a problem. A further issue relates to perception-based-ratings; could it be that the respondents knew that the authors were looking for evidence of OR practitioners supporting strategy and thus helped provide such evidence by giving higher ratings of their involvement in the process and use of tools? If this were the case, one might ask why not all of the tools were rated highly, there is clear evidence that some tools scored low in terms of their use and others scored low in terms of awareness.
Returning then to the first research question, the findings of this survey demonstrate that OR practitioners are actively involved in supporting strategy within their organisations. Unlike previous surveys, this research differentiates involvement in supporting strategy from leading or membership of the strategic planning team, through to awareness of the strategy process. Returning to the strategy as practice research issues noted earlier, this research demonstrates that OR practitioners are valid strategic actors and therefore as a unit of analysis they are worthy of further more detailed research, both in terms of the nature of their involvement and their practices in supporting strategy within organisations.
The findings here suggest that all of the strategic activities are actively supported by OR practitioners and their groups / teams to a greater or lesser extent, with the most regularly supported activities being the evaluation of strategic options and the least regularly supported being implementing strategic decisions. The findings also highlight how engagement in particular activities varies according to differing levels of involvement in the strategy process, with those most closely involved in strategy (head or member of strategic planning team) being more regularly engaged in supporting activities compared to those least involved with the process (aware of strategy process). Pidd (1996) commenting on the survey of Clark and Scott (1995) suggested that OR had a role to play in developing strategic vision; this research suggest that some practitioners and their groups/teams regularly support the activities of setting direction and strategic goals, particularly.
management / strategy and soft OR/MS). This is a new finding as previous research (Clark and Scott, 1995; Stenfors, et al., 2007, Tapinos, 2005) did not address this issue. In particular, the level of awareness of management tools appears to be related to involvement in strategy; those with the most direct involvement (head or member of strategic planning function) having much greater awareness of such tools, compared to those who see themselves contributing to the process or specific projects. However, some of the classic tools in this field were noticeably unfamiliar, with high „never heard of‟ scores, particularly PEST analysis, Porter‟s five forces and portfolio matrices. Such a finding is perhaps to be expected that very few specialist masters courses in OR or related subjects cover standard management and strategy tools. Such tools would form part of the basic core of a management or MBA degree and would be considered as natural tools by some for supporting strategy. Therefore, I would expect that if the survey were repeated with a group of practitioners with a management background, the picture would be strikingly different. One tool which seems to buck this trend is scenario planning, a tool which regularly appears in the Rigby and Bilodeau survey (2007). Why is it that this tool has greater awareness (and use) compared to other management and strategy tools? One explanation could be that the term means different things to different people - for example, OR practitioners generally are more familiar with the term „scenario‟ as it is often used to describe alternative experiments in modelling exercises (see for example Tsagalidis and Georgiou, 2009 and Sheu, 2007). Additionally, there are a variety of scenario planning approaches within the strategy literature (see for example Ringland, 1998 who describes a number of different approaches).
choice approach – one explanation could be that the term has been taken to mean that the robustness of plans are checked rather than use of a particular tool (Namen, et al., 2009).
Turning to tool use, there is evidence of the use of a comprehensive list of tools from across all three tool groups, with some of the most regularly used tools being within the OR/MS and management / strategy groups. The list of tools used less regularly (or never) can be found in each of the three tool groups, though, if you consider the proportions of tools least used within each group, the largest proportion would be found in the soft OR/MS tool group where over 80% of the tools received a usage score of 1 or 2, compared to approximately 50% in the other two tool groups. What this indicates is that there is large collection of tools that are considered never or rarely to be used to support strategy. In comparison with the work of Stenfors et al (2007) and Tapinos et al (2005) the most popular tool reported by respondents to this survey was not SWOT analysis but rather financial analysis and project management. The reason for the latter may be related to the inclusion of strategy implementation as an explicit stage in the strategy process that can be supported by the use of tools, but could also be indicative of the background of respondents ie OR practitioners rather than executives. It is perhaps unsurprising that analytic OR/MS tools (cost benefit analysis, financial analysis, project management, risk analysis and statistical analysis) are amongst those reported to be used most regularly given that the respondents are OR practitioners possibly working within an OR group / team supporting strategy.
Within the OR/MS tool group, nine tools received a score of four or better, indicating that they are used to support strategy. However 7 tools (around 30% of this tool group) received a score of 1 indicating that they are never used to support strategy; in fact over 50% of this tool group received a score of 1 or 2. Two of the tools reported as never used to support strategy (agent based models and real options analysis) were the tools that respondents were least aware of in this tool group – perhaps this is to be expected given that both are relatively new developments. If awareness levels are compared to usage scores, then it is noticeable that there are tools of which most respondents are aware which do fall into the category „never used to support strategy‟ eg credit scoring models, DEA, game theory, heuristics and inventory models.
(2007), Stenfors et al (2007) and Tapinos (2005), this finding is not surprising since their surveys covered a number of tools from this group. However when compared to the survey of Clark and Scott we see that OR practitioners have exposure to a wider range of tools with a number of tools scoring highly in terms of awareness, though it is noticeable that Porter‟s five forces which was included in Clark and Scott‟s survey received the worst awareness score of this tool group. One issue that requires further research is the extent to which OR practitioners themselves are using tools from this group and how they have learnt about such tools. It also raises the question of whether such tools should be included in MSc programmes given that there is evidence that OR practitioners are involved in supporting strategy within their organisations.
The apparent lack of reported use of the soft OR/MS tool group to support strategy is a surprising finding of this research, particularly given that a large proportion of the respondents were aware of two of the tools, cognitive mapping and SSM. The strategic choice approach noticeably lags behind these two in terms of awareness but not in terms of reported use. These findings raise the question, if awareness of some soft OR tools is reasonably high amongst OR practitioners, then why not their reported use? To investigate this further, I looked more closely at those who had reported a usage score of 4 or more for cognitive mapping, to see if for example there were any similarities or differences across the private and public sectors. For cognitive mapping, 20 individuals gave the tool a usage score of 4 or more, of these two were of unknown origin, 12 were from the private sector and six from the public sector. For SSM, 16 respondents reported a usage score of 4 or more with seven from the private sector and nine from the public sector. Seven individuals gave both SSM and cognitive mapping usage scores of 4 or more – three were from the private sector and four from the public sector. Given the small numbers involved here, these results are inconclusive, however it does suggest that there are a group of practitioners who regularly make use of these tools, but that there use is not widespread.
research had particularly highlighted the use of statistical (especially multivariate) analysis, yet the research here found that practitioners were highly aware of it and that it was used to support strategy. Some of the uses though are not clear and require further research, for example, how does statistical analysis help set direction?
The final research question addressed how tools were combined or adjusted in supporting strategy. None of the respondents indicated that they adjusted individual tools. The research did find that practitioners often combined two or more approaches in supporting strategy drawing on tools from both the OR/MS and management / strategy fields. However, the research simply identified which tools were combined, without linking them to any activities thus further research would be need to understand when, how and why particular tools are combined in support of specific activities. Comparing the results of this survey to that survey of Munro and Mingers (2002), it is noticeable that the list of tools combined shares some common tools from across the three tool groups eg simulation, forecasting, statistical analysis, SWOT analysis, PEST analysis, scenarios, cognitive mapping, influence diagrams. However in each of the surveys, the list of tools combined contains more tools from what could be called, the „expected‟ tool group ie here more management / strategy tools were listed compared to Munro and Mingers (2002) findings where more of the soft OR/MS tools were combined with other tools– this is to be expected given the nature of the participants in each of the surveys. Both surveys did find evidence of tools being combined across tool groups and across paradigms. For strategy support this finding warrants further research since some of the combinations of tools are not transparent for example how can statistical analysis be combined with SWOT analysis, a tool which is more typically combined with tools such as brainstorming or PEST analysis? What is also not clear from the survey and thus warrants further research is whether in combining tools, they are combined in whole or in part and in doing so whether any are modified in any way.
One final point for reflection concerns the „unit of analysis‟ approach adopted within this research. The approach adopted here has provided insight at three different levels:
However this approach is not without its limitations, particularly when these three levels are combined. For example, insight is provided into the awareness of different tools by OR practitioners. The paper does not claim to provide insight into the OR practitioner‟s use of tools or support for particular activities at the individual level. At the individual level there is much scope for further research, both in terms of the OR practitioner and the other actors involved in the development of strategy and eg those from other professional backgrounds, executives and middle managers. There is also scope for exploring how the OR practitioner uses their toolset in relation to other players, for example in a facilitative or analytical context.
Conclusions
The research presented here demonstrates that OR practitioners are legitimate strategic actors within organisations who actively support strategy and have responsibility for and engagement in the process of organisational strategic development. The paper provides empirical evidence that OR practitioners can be found with differing levels of involvement in supporting strategy, from direct responsibility as head of the strategic planning team through to awareness of the process. There is also clear evidence that all activities within the strategy process are supported by practitioners from setting direction through to implementation.
vision, through to strategy implementation. Tools are used both individually, and also in combination with other tools, from both within the same and across different tool groups.
Finally, the exploratory research reported here has raised a number of questions which are worthy of further exploration, including:
How are tools used to support specific activities?
How and why are tools combined for supporting strategy?
Why are of some of the better known soft OR/MS tools not in widespread use for supporting strategy?
Figure 1: The strategic development process
REHEARSING STRATEGY Creating
strategic initiatives
MODELS OF THE ORGANISATION
Managing the organisation Uncontrolled
inputs
Implementing strategic
change Resources
Learning from current performance
measurement Setting
strategic direction and
goals
ENACTING STRATEGY
Exploring internal and
external environment
s
Assessing strategic ideas
Learning from virtual and current
Figure 2: Illustrating the focus of previous survey research on the use of tools to support strategy
OR/MS Practitioners
Executives OR/MS Tools
Strategy Tools
Rigby & Bilodeau
Clark & Scott Stenfors et al
Tapinos et al
Figure 3 The percentage of respondents in each of a number of industry sectors
0 5 10 15 20 25 30 35
Gov ernm
ent / publ
ic
Fina ncia
l Ser vice
s
Prof essi
onal Ser
vice s
Hea lth &
Pha rmac
eutic
als IT
Def ence
Tran spor
t
Ener gy &
Util ities
Oth er
Figure 4 Number of employees in respondent organisations
0.00% 10.00% 20.00% 30.00% 40.00% 50.00% 60.00%
Less than 50 50-250 250-1000 1000-3000 More than 3000
Figure 5 Turnover of respondent organisations
0.00% 10.00% 20.00% 30.00% 40.00% 50.00%
Blank Less than 500k 500k-5M 5M-100M 100M-500M More than 500M
Figure 6 Respondent’s position within their organisation
No information 1%
Other 5%
Analyst 21%
Consultant
23% Project Manager
/ Team leader 4%
Manager / Head of… 30% Board level
Figure 7 Respondent’s involvement in organisational strategic development Contribute to
strategy process
34%
Member of strategic planning team
17% Head of
strategic planning team
7% Aware of
strategy process
13%
Contribute to strategic
Tools Clark and Scott (1995)
Tapinos (2005)
Rigby and Bilodeau
(2007)
Stenfors et al (2007)
OR/MS Tools X
Corporate modelling X
Cost benefit analysis X
Forecasting X X
Heuristics X
Optimisation / LP X X
Project management tools X
Quality methods X
Risk analysis X X
Simulation X X
Spreadsheet applications X X
Statistical analysis X X
Management /strategy tool
Benchmarking X X
Brainstorming X X
Core competencies X X
Customer relationship management X
Balanced scorecard X X X
Delphi X
Enterprise resource planning X
Knowledge management X
Mission and vision statements X X
PEST analysis X
Porter‟s five forces X X
Resource based planning X
Scenario planning X X X
Six sigma X
SWOT analysis X X
Value chain analysis X X
Soft OR/MS Tools
Cognitive mapping X
[image:37.595.57.545.63.652.2]Soft systems X X
Activity Overall
Level of involvement in strategy Head of
strategic planning team
Memb er of strategic planning team
Contribute to strategy process
Contribute to strategic projects Aware of strategy process Setting direction
5 7 6 5 3 2
Setting strategic goals
5 6 6 5 3 3
Assessing the external environment
5 6 6 5 4 3.5
Appraising the internal environment
5 7 6 6 5 3.5
Generating options
5 7 6 5 4 3
Evaluating options
6 7 6 6 5 3.5
Selecting options
5 7 6 5 4 3
Measuring / evaluating organisational performance
5 5 5 5 5 4
Implementing strategic decisions
[image:38.595.76.522.96.520.2]4 7 5 5 3 4
Table 2 –Median scores showing regularity of providing support for strategic activities, split by level of involvement in strategy.
OR/MS Tools Median score of private sector respondents (n=78) Median score of public sector respondents (n=51)
% of private sector respondents
who have never heard
of tool
% of public sector respondents
who have never heard
of tool
Agent based models 1 2 53.85% 49.02%
Capital investment appraisal 5 3 17.95% 17.65%
Cost benefit analysis 6 5 0 0
Data mining 3 2
DEA / efficiency evaluation 1 1.5 20.51% 9.80%
Decision analysis 4 3 3.85% 0
Financial analysis / modelling
6 5 2.56% 0
MCDA (multi-criteria decision analysis)
2 3 17.95% 5.88%
Multivariate statistical analysis
3 4 1.28% 0
Quality methods 4 3 12.82% 3.92%
Risk analysis 2 1.5 50.00% 49.02%
Simulation 3 4 2.56% 0
Statistical analysis 5 5.5 0 0
System dynamics 1 2 8.97% 3.92%
Management / Strategy Tools Median score of private sector respondents (n=78) Median score of public sector respondents (n=51)
% of private sector respondents
who have never heard
of tool
% of public sector respondents
who have never heard
of tool
Benchmarking 5 4 0 1.96%
Brainstorming 6 5 0 0
Customer relationship management (CRM)
4.5 2 5.13% 17.65%
Portfolio matrices 3 2 30.77% 43.14%
Resource based planning 3 4 5.13% 15.69%
Value chain analysis 2 1.5 12.82% 30.37%
Visioning approaches 2 1 33.33% 33.33%
Soft OR/MS Tools
Median score of private sector respondents (n=78) Median score of public sector respondents (n=51)
% of private sector respondents
who have never heard
of tool
% of public sector respondents
who have never heard
of tool
Analytical hierarchy process 1 2 48.72% 39.22%
Cognitive mapping 2 1.5 10.26% 5.88%
Strategic Activity % of total activities supported by tool use
Set direction 7.64
Set goals 11.56
Assess external environment 12.19 Assess internal environment 11.28
Generate options 8.83
Evaluate options 15.56
Choose options 11.83
Measure perform 12.56
[image:41.595.154.443.86.253.2]Implement 8.55
OR/MS Tools Resps Dir Goals Ass Ext Ass Int Gen Opts
Eval Select Measure perf
Imple
Forecasting 23 9 12 11 12 2 8 8 12 3
Financial analysis 22 5 8 6 6 4 18 17 14 3
Simulation 21 1 5 7 6 8 18 11 8 5
Project management 20 5 6 5 4 3 5 5 7 18
Stats analysis 19 5 8 11 10 5 13 6 16 2
Cost benefit analysis 16 2 7 3 6 3 14 11 10 3
Risk analysis 12 0 2 8 7 1 8 6 3 5
MCDA 8 3 3 0 2 2 5 3 1 1
Data mining 7 1 2 4 3 4 6 5 5 3
Optimisation 6 1 1 1 1 0 4 6 3 2
Management / Strategy Tools
Resps Dir Goals Ass Ext
Ass Int
Gen Opts
Eval Select Measure perf
Imple
Brainstorming 15 11 11 7 6 14 4 2 0 0
SWOT 12 3 6 12 10 3 5 2 0 0
Balanced scorecard 10 3 6 3 6 4 5 3 10 4
Benchmarking 10 1 2 5 3 1 4 2 8 1
Resource based planning
9 2 2 4 5 3 6 7 3 6
Scenario planning 9 5 5 6 4 7 5 3 2 2
PEST analysis 7 1 5 6 5 4 0 1 1 0
CRM 1 3 2 1 1 1 1 3 1 3
Portfolio (BCG) matrices
4 1 3 1 2 0 3 1 1 0
Value chain analysis 2 0 0 1 0 1 1 2 1 1
Porter‟s 5 forces 1 1 1 1 0 0 0 0 0 0
Soft OR/MS Tools Resps Dir Goals Ass Ext
Ass Int
Gen Opts
Eval Select Measure perf
Imple Decision Explorer /
Cognitive mapping
3 3 3 3 2 3 2 2 3 2
SSM 3 2 1 1 1 2 0 0 0 2
Stakeholder analysis 3 2 2 2 1 3 2 2 0 3
Influence diagrams 2 1 1 0 0 1 1 1 1 0
Viable System Model (VSM)
[image:42.595.64.533.89.716.2]2 2 2 2 2 2 0 1 2 2
Figure 8 Frequency count of the number of activities supported by named tools.
0 20 40 60 80
1 2 3 4 5 6 7 8 9
N
o
o
f
a
c
ti
v
it
ie
s
s
u
p
p
o
rt
e
d
Tool 1 Tool 2
Simulation Cognitive mapping
Cost benefit analysis Financial analysis Forecasting
Influence diagrams MCDA
Risk analysis
Spreadsheet modelling (2 responses) Statistical analysis
SWOT Brainstorming (2 responses)
PEST (4 responses) Porter‟s five forces Risk analysis Scenario planning Statistical analysis Scenario planning Financial analysis
Forecasting
Simulation (6 responses) Statistical analysis System dynamics
Forecasting Business case analysis
Project management Financial analysis Influence diagrams System dynamics Influence diagrams Porter‟s Five Forces Scenario Planning Value Chain Analysis Viable System Model Statistical analysis Benchmarking
[image:44.595.106.494.97.565.2]Simulation
Tool 1 Tool 2 Tool 3 Tool 4 Tool 5 Tool 6 Influence diagrams System dynamics Simulation
MCDA Customer relationship managemen t
Resource allocation
MCDA System dynamics Simulation Scenario planning SWOT analysis PEST analysis Simulation Financial
modelling
Scenario planning
SSM System
dynamics Balanced scorecard Statistical analysis Risk analysis Scenario planning System dynamics Spreadsheet modelling Simulation Statistical analysis Benchmarki ng
Cost benefit analysis Forecasting SWOT analysis Risk analysis Project managemen t Financial modelling
VSM System
dynamics
Cognitive mapping
Value chain analysis
[image:45.595.81.517.95.515.2]Porter‟s five forces Balanced scorecard EFQM (Business excellence) Financial modelling Project managemen t Risk managemen t SSM
OR/MS Tool % of sample who have not heard of tool Overall median scores
Median Score, where 1 = never use tool, 7 = regularly use tool
Head of Str Plng team SP team Member Contribu te to SP Process
Contribu te to SP Projects
Process Aware
Agent based models
50.37 1 1 2 1 1.5 1
Capital investment appraisal
17.78 4 4 5.5 4 4 5
Cost benefit analysis
0.00 5 6 6 6 5 5
Credit scoring models
11.11 1 1 1 1 1 1
Data mining 0.00 2 1 3 2 3 1.5
DEA /
efficiency evaluation
15.56 1 1 1 1 2 1
Decision analysis
2.22 4 5 3.5 4 4 2
Financial analysis / modelling
1.48 6 7 6 5.5 6 5
Forecasting 0.00 5 5.5 5 5 5 5
Game theory 5.93 1 1 1 1 1 1
Heuristic & combinatorial optimisation methods
5.93 1 1 1 1 2 1
Inventory models
11.11 1 1 1 1 2 1
MCDA (multi-criteria
decision analysis)
12.59 2 2 2 2 2 2.5
Multivariate statistical analysis
0.74 3 2 4 2 4 2
Optimisation approaches
2.96 2 1.5 2 2 3 2.5
Project management
0.00 6 7 6 6 6 5.5
Quality methods
9.63 3 5 3.5 3.5 2 2
Real options analysis
49.63 2 2.5 3 1 2 1.5
Simulation 1.48 4 2 3 3 5 3.5 Statistical
analysis
0.00 5 4 5 5 6 4
System dynamics
7.41 2 1.5 2 1.5 2 1
Yield (revenue) management
21.48 1 1 1 1 2.5 1
Appendix 1 – Summary statistics for OR/MS tools included in survey
Management / Strategy Tool
% of sample who have not heard of tool Overall Median scores
Median Score, where 1 = never use tool, 7 = regularly use tool
Head of Str Plng team SP team Member Contrib ute to SP
Process
Contrib ute to SP
Projects
Process Aware
Balanced scorecard
1.48 4 3 5 4 4 4
Benchmarking 0.74 5 2 5 5 4 4
Brainstorming 0.00 5 5 6 6 5 5
Business excellence
model /
European foundation for quality
management (EFQM)
31.85 2 2 1 2 2 2
Core
competencies
8.15 4 4 4 4 3 2.5
Customer relationship management (CRM)
10.37 4 4 5 4 3 3.5
Delphi technique
27.41 1 1 1 2 1 1
Enterprise resource planning
33.33 2 4 2 1 2.5 2
Knowledge management
0.74 3 4 4 3 3 2
PEST (Political, Economic, Social,