The role of personality in the development of positive affect
35
0
0
Full text
(2) Abstract (English version) The relation between positive (state) affect and personality received considerable attention in previous research, but it remained unclear whether the Big Five personality characteristics are related to the development of positive affect on a state level (the experience of affect in one moment) over a longer period of time. The present study sought to fill that gap by investigating the role of the Big Five personality dimensions (Extraversion, Agreeableness, Conscientiousness, Emotional Stability and Imagination/Intellect) in the development of positive affect as a state over a six-year period of time. The analysis draws on data from the representative Dutch Longitudinal Internet Studies for the Social sciences (LISS panel) and included 2826 respondents between 2008 and 2013. Positive state affect was measured with the positive affect subscale of the PANAS, and personality was assessed with the 50-item version of the IPIP. Differences in the development of positive affect over time were investigated for respectively high and low scorers on each personality dimension. Data of four measurement occasions (2008, 2009, 2011, 2013) were included in the analyses, which consisted of Pearson correlation coefficients, multiple linear regression analysis and repeated-measures ANOVA’s. In general, positive state affect was found to be moderately stable over a six year period and showed a slight but significant decrease. All Big Five personality dimensions were found to have low positive associations with positive affect, with extraversion having the strongest relationship. The five dimensions explained together 17.7% of the variance of positive state affect. Significant interaction effects indicated that the decrease in positive affect took place between different measurement occasions for high and low scorers on each of the personality dimensions, except for agreeableness. The findings of the present study suggest that even momentarily affective conditions have a dispositional character to some extent, instead of being exclusively dependent on situational factors. As positive emotions do serve as a promising starting point for mental health promotion programs, future research might address possible implications of the relationship between positive affect and individual differences in personality.. 1.
(3) Abstract (Dutch version) De relatie tussen positief (state) affect en persoonlijkheid is in eerder onderzoek veel besproken. Het is echter nog steeds onduidelijk of de Big Five persoonlijkheidstrekken gerelateerd zijn aan de ontwikkeling van positief affect op een state level (de ervaring van affect op een bepaald moment) gedurende een langere tijdsperiode. De huiduge studie beoogde dit gat te vullen door de rol van de Big Five persoonlijkheidstrekken (Extraversie, Mildheid, Consciëntieusheid, Emotionele Stabiliteit en Intellect) tijdens de ontwikkeling van positief affect op een state level gedurende een periode van zes jaar te onderzoeken. Voor de analyse is gebruik gemaakt van data van de representatieve Nederlandse Longitudinale Internet Studies voor Sociale wetenschappen (LISS panel) en betrok 2826 respondenten tussen 2008 en 2013. Positief state affect werd met de positief affect subschaal van de PANAS gemeten en persoonlijkheid werd met de 50-item versie van de IPIP gemeten. Verschillen in de ontwikkeling van positief affect in de loop der tijd werden voor telkens hoog en laag scorende respondenten op elke persoonlijkheidstrek onderzocht. Data van vier meetmomenten (2008, 2009, 2011, 2013) werden in de analyses meegenomen. De analyse omvatte Pearson correlatie coëfficiënten, multiple lineare regressie analyses en repeatedmeasures ANOVA's. Over het algemeen toonde positief state affect een gematigde stabiliteit gedurende de periode van zes jaar en daalde licht maar significant. Alle Big Five persoonlijkheidstrekken toonden lichte positieve associaties met positief affect, waarbij extraversie de sterkste relatie toonde. De vijf persoonlijkheidstrekken verklaarden samen 17.7% van de variantie van positief state affect. Significante interactie effecten duidden aan dat de daling van positief affect in de loop der tijd voor hoog en laag scorende respondenten op de persoonlijkheidstrekken tussen verschillende meetmomenten plaats vond, met uitzondering van mildheid. De resultaten van de huidige studie suggereren dat zelfs momentele affectieve toestanden in een bepaalde mate een dispositioneel karakter hebben, in plaats van uitsluitend afhankelijk te zijn van situationele factoren. Omdat positieve emoties een veelbelovend beginpunt voor geestelijke gezondheidsbevordering programma's zijn, is een aanbeveling voor toekomstig onderzoek om met mogelijke implicaties van de relatie tussen positief affect en individuele verschillen van persoonlijkheid rekening te houden.. 2.
(4) Contents Abstract (English version) ....................................................................................................................... 1 Abstract (Dutch version) ......................................................................................................................... 2 Introduction ............................................................................................................................................. 4 Positive Psychology and Positive Affect.............................................................................................. 4 Positive Affect ...................................................................................................................................... 5 Stability of Positive Affect ................................................................................................................... 6 The relationship between Personality and Positive Affect .................................................................. 7 Research questions and Hypotheses.................................................................................................. 10 Methods ................................................................................................................................................. 12 Procedure .......................................................................................................................................... 12 Participants ....................................................................................................................................... 12 Measurements.................................................................................................................................... 13 Positive Affect ............................................................................................................................... 13 Personality ..................................................................................................................................... 14 Analysis ............................................................................................................................................. 15 Results ................................................................................................................................................... 16 Relationship between Positive Affect and the Big Five personality dimensions ............................... 16 Stability of Positive Affect ................................................................................................................. 17 Role of personality in development of Positive Affect over the years................................................ 19 Discussion ............................................................................................................................................. 23 Associations between Positive Affect and the Big Five personality dimensions ............................... 23 The role of personality in the development of Positive Affect ........................................................... 25 Strengths and Limitations .................................................................................................................. 27 Recommendations.............................................................................................................................. 28 Conclusion ............................................................................................................................................. 29 Appendix A ........................................................................................................................................... 30 Appendix B ........................................................................................................................................... 30 References ............................................................................................................................................. 31. 3.
(5) Introduction The present study explores the role of the Big Five personality dimensions in the development of positive state affect over a six-year period of time. Previous research already addressed the relation of positive affect and personality, for instance its relation to extraversion. Still, it remained unclear what role extraversion, agreeableness, conscientiousness, neuroticism and openness to experience play in the development of positive affect over a long period of time. The aim of the present study was to fill that gap by providing first insights into these relationships by using a representative Dutch six-year long-term panel. To begin, a short thematic introduction of positive affect within the field of positive psychology is given to provide an access to the topic. Subsequently, the construct of positive state affect is elucidated. Finally, the relation between positive state affect and the Big Five personality dimensions is illustrated by means of theoretical explanations and results of previous research findings. Positive Psychology and Positive Affect In the past, the common view of mental health implicated simply the absence of mental illness. Since 2005, the World Health Organization (WHO, 2005) supports the rethinking that mental health should rather be defined in a positive way. According to this view, mental health is “a state of well-being in which the individual realizes his or her own abilities, can cope with the normal stresses of life, can work productively and fruitfully, and is able to make a contribution to his or her community” (WHO, 2005, p.2). The change of perspective concerning mental health is also the subject of a new psychological field: positive psychology. Similar to the definition of the WHO, positive psychology defines mental health as the combination of three components: the subjective experience of well-being (emotional well-being), the optimal functioning of an individual that leads to self-realization (psychological well-being) and the optimal functioning of an individual within the society (social well-being) (Keyes, 2005). Positive affect (PA), the central theme of the present paper, can be assigned to emotional well-being (EWB). So, it is worth to consider EWB more precisely. According to Diener (1984), EWB consists of an affective aspect, including positive and negative affect, and a cognitive aspect concerning the general judgments about one’s life (life satisfaction). In the following, when EWB is mentioned, these three components (positive affect, negative affect and life satisfaction) are meant. Diener (1984) understands the experience of high EWB as a requirement for a good and happy life, thus that 4.
(6) PA outweighs negative affect while simultaneously a person judges his or her life as satisfied. Because the preponderance of PA is one important part of EWB and thus also of happiness, it is worth being investigated more precisely. By doing so, the interest of positive psychology to make the mechanisms underlying happiness more transparent is joined. In the following, the construct of PA is specified within its theoretical context. Positive Affect Affect is, according to Diener and colleagues (Diener, Suh, Lucas & Smith, 1999), an umbrella term for emotions and mood, and furthermore refers to people’s evaluation about their life events. In general, measures of PA aim to estimate a person’s tendency to evaluate life events rather in a positive way (Steel, Schmidt & Shultz, 2008). According to Watson and colleagues (Watson, Clark & Tellegen, 1988), PA refers to “the extent to which a person feels enthusiastic, active and alert. High PA is a state of high energy, full concentration, and pleasurable engagement (…)” (p. 1063). People who are in a state of low PA, experience decreased levels of happiness, confidence, and excitement, and are less energetic (Watson, 2002). Affect can be analyzed at either a state or a trait level. State and trait levels are seen as one continuous dimension where state affect refers to a short period of time (e.g. one moment, day, week, or month) and trait affect to a longer period of time (e.g. one year) (Steel, Schmidt & Shultz, 2008). Previous research indicates that it is worthy to investigate state affect separately from trait affect, as it differs in the strength of correlations to other variables, for example to personality dimensions (e.g. Steel, Schmidt & Shultz, 2008). Previous research mostly measured PA on a trait level, whereas the present study measured the intensity of PA at a specific moment in time, thus on the state affect level. Research shows that people experience affective feelings almost all the time (Diener, Sandvik & Pavor, 1991), and that these feelings can be categorized into pleasant and unpleasant (Kahnemann, 1999). The prevailing presence of affective feelings raises questions about their functional role in one’s life. Previous studies about the function of emotions usually addressed the negative feelings. Few researches focused on positive emotions, and PA was usually investigated as a component of EWB, whereas the present study will investigate PA apart. Fredrickson (1998) provided the broaden-and-build theory, one possible explanation for the functional role of positive emotions. According to this approach, positive emotions lead to specific short-term and long-term effects. First, positive emotions lead on the short term to a widening of attention, cognition and behavior (broaden-effect). Second, the 5.
(7) ‘broadened’ way of thinking and behavior facilitates the acquirement of lasting cognitive, social and physical resources in the long term (build-effect). These resources prepare the individual for future challenges as they enable new strategies to overcome problems and finally lead to positive outcomes in a person’s life. Happy people – those who experience a prevalence of PA - were found to do better on certain life domains, e.g. being more likely to get married, having more friends, making more money, performing better at work, having better health and may even live longer in comparison to unhappy people (Lyubomirsky, King & Diener, 2005; Lucas & Diener, 2008). Furthermore, it is also important to give attention to positive emotions, because previous research shows that they are able to reverse the effects of negative emotions. According to the ‘undoing hypothesis’ (Fredrickson & Levenson, 1998), positive emotions can reduce the negative physiological reactions that are related to negative emotions, e.g. by reducing stress hormones by means of broadening the resources of thinking and behavior. These findings illustrate that positive emotions and happiness are not simply the result of positive outcomes, but may also precede them. Taken together, PA seems to play an important functional role in life by facilitating the creation of cognitive, social and physical resources (e.g. broadened thinking, expanding friendships, rest and relax to rebuild energy) that in turn have an adaptive value as they prepare the individual for future challenges and enable positive outcomes on physical and mental health (Lyubomirsky, King & Diener, 2005; Fredrickson, 1998). The next paragraph addresses the stability of PA over time. Stability of Positive Affect Regarding the development of affect, most studies have concentrated on investigating longterm stability of EWB in general or life satisfaction in particular. Few empirical studies focused on long-term stability of affective reactions, and the studies that did so, focused mostly on trait affect and found a moderate stability (Lucas & Diener, 1999). One study that also investigated positive state affect is one by Watson and colleagues (Watson, Clark & Tellegen, 1988). They found that by using the Positive and Negative Affect Schedule (PANAS, Watson, Clark & Tellegen, 1988), even the moment ratings of affect showed a considerable stability of PA ratings. Respondents filled in the PANAS on two occasions that were 8 weeks apart. A correlation of .54 between these measurement occasions was found. The authors concluded that this result emphasizes the strong dispositional character of affect and concluded that “even momentary moods are, to a certain extent, reflections of one’s general affective level” (p. 1065). That conclusion illustrates the fact that state affect and trait 6.
(8) affect have to be interpreted as one continuous dimension instead of distinct units. This way of interpretation brings along the difficulty to determine whether trait affect might underlie momentary moods and thus whether it might have some impact on state affect in general. The discussion section below will deal more in-depth with this note. Taken together, the findings presented above indicate that state affect is likely to be stable to a certain extent over time and thus may be related to personality. Therefore, the question comes up if the Big Five personality dimensions are related to the development of positive state affect. The relationship between Personality and Positive Affect In general, personality psychology distinguishes five major personality traits (called the Big Five): extraversion (E), neuroticism (N), agreeableness (A), conscientiousness (C) and openness to experience (O) (McCrae & Costa, 2003). In the past decades, research on EWB showed that personality characteristics are strong and consistent predictors for PA in such an important way that theory of EWB would be incomplete when neglecting the influence of personality (Lucas & Diener, 1999). Steel and colleagues (Steel, Schmidt & Shultz, 2008) concluded in their meta-analysis that all personality traits explain up to 39% of the variance of EWB. As PA is supposed to be an important component of EWB, it is useful to consider the relationship between PA and personality traits more precisely. A great amount of research repeatedly found associations between PA and E (Lucas & Diener, 1999). Costa and McCrae (1980) found these correlations to be stable over 10 years. However, most studies focused on trait affect instead of state affect. Previous research found that both trait and state affect are correlated with E, with correlations at a state level being less strong than at a trait level (Lucas & Fujita, 2000; Steel, Schmidt & Shultz, 2008). For instance, in their meta-analysis Lucas and Fujita (2000) found a correlation between positive state affect and E of .15, while the correlation on a trait level was .38. However, it has to be noted that only two studies were included that considered the relationship between positive state affect and E. The authors concluded that the results may have underestimated this relationship due to methodological reasons (see Lucas and Fujita, 2000, for more details). Steel and colleagues (Steel, Schmidt & Shultz, 2008) found the associations between PA and personality in their meta-analysis to be functionally uniform for both affect on a trait and on a state level and it was not distinguished between these two levels. The correlations between E and PA were found to be moderate in a range between .44 to .25 depending on the scale used (Neuroticism-Extroversion-Openness Personality Inventory, NEO, Costa & McCrae, 1992; Eysenck Personality Questionnaire, 7.
(9) EPQ, Eysenck & Eysenck, 1975; Eysenck Personality Inventory, EPI, Eysenck & Eysenck, 1964), indicating that commensurability regarding measurement instruments does matter. Compared with research concerning the relation between E and PA, less research investigated the connection between PA and the other Big Five personality dimensions (N, A, C and O). The connection between PA and N is found to be negative. For instance, Steel and colleagues (Steel, Schmidt and Shultz, 2008) found correlations of -.35 between PA and N. This might not be surprising as people high on N are described as experiencing chronic anxiety, being depressive and emotionally unstable, moody and nervous (McAdams, 2009). Additionally, previous research indicated a positive correlation between A and PA. For instance, Steel and colleagues (Steel, Schmidt & Shultz, 2008) found that the association between PA and A was .15 and DeNeve and Cooper (1998) concluded that both E and A are the most predictive personality traits for positive state affect (.20 and .17 respectively). Both E and A are thought to have an impact on people’s relationships, in the sense of the quality of relationships (A) and the quantity of relationships (E). Then, they are supposed to facilitate the experience of PA through encouraging more and better relationships, which in turn is thought to be a factor to make people happier (Myers & Diener, 1995). According to McCrae and Costa (1991), C should also contribute to EWB by supporting positive experiences in achievement situations. People scoring high on C are described as being responsible, dependable, persistent and achievement-oriented to life (McAdams, 2009). Actually, Steel and colleagues (Steel, Schmidt & Shultz, 2008) also found a significant correlation between C and PA of .31, that in fact is higher than the correlation they found between PA and A. Regarding O, McCrae and Costa (1991) suggested that this personality characteristic facilitates both positive and negative experiences, and thus is not expected to show a strong correlation with EWB. However, the meta-analysis of Steel and colleagues (Steel, Schmidt & Shultz, 2008) found a correlation of .26 between O and PA. Taken together, previous research indicated connections between PA and all Big Five personality dimensions. Or more specifically, people scoring high on the personality dimensions E, A, C and O were found to score higher on PA than people that score low on these personality traits. By contrast, individuals with high scores on N were found to have lower levels of PA than people scoring low on N. In the following, theoretical considerations are presented that provide explanations for the relationship between PA and personality.. 8.
(10) One theoretical approach that considers the connection between PA and personality is the dynamic equilibrium model of Headey and Wearing (1992). This model suggests that certain personality characteristics, especially E, N and O, lead to specific equilibrium levels of positive and negative affect. After a pleasant or adverse life event, a deviation of that baseline level takes place. However, after some time, people return to their equilibrium level of affective experience due to their personality. Thereby, E is supposed to serve the return of PA to its baseline level. As E is thought to be the driving force in this process, it could be derived that after a positive or negative life event occurs, extraverts might return faster to their baseline PA level than low scorers on E. However, it remains unclear what role the other personality dimensions play concerning the development of PA. There are at least two more possible explanations that recurrently arise within scientific literature which emphasize personality as an important determinant of PA: instrumental (behavioral) and temperamental (biological) theories. According to the instrumental approach, personality characteristics lead in an indirect way to higher EWB. It is assumed that specific personality traits influence the choice of situations or the tendency to experience positive and negative life events (Lucas & Diener, 2008). For example, according to Lucas and Diener (2008), extraverts seek more social activities than introverts, and in this way also experience more positive feelings and a higher amount of EWB. A and C are thought to facilitate positive experiences by enhancing relationship quality and supporting achievement tasks, respectively (McCrae & Costa, 1991). On the contrary, O is supposed to predispose people to feel both positive and negative experiences more deeply, because of their broader and deeper scope of awareness and tendency to broaden their experience (McCrae & Costa, 1991). The second approach, the temperamental theories, assumes that there is a direct route from personality traits to affective experiences (Lucas & Diener, 2008). According to Costa and McCrae (1980), E predisposes people to experience more PA simply because they are more cheerful and enthusiastic than introverts. Actually, the construct similarity between PA and E emphasizes this view. Yik and Russell (2001) point out that many of the terms used to describe E (e.g. optimistic, energetic, and sociable) also appear in measures of PA. Further, research indicated that there happens to be a high overlap between these constructs (Steel, Schmidt & Shultz, 2008). For instance, Burger and Caldwell (2000) concluded that certain empirical studies found a considerable overlap between the PA scale within the PANAS and the NEO Extraversion scale in measuring nearly the same construct. Gray (1981) supposed another direct route from personality to PA, namely that PA is regulated through 9.
(11) neurophysiologic pathways. Thereby, an underlying adaptive system plays an important role: the behavioral activation system. The system fulfills an important role in regulating behavior and is in a specific way connected with personality characteristics and affective reactions. PA and E are therefore strongly associated with an active behavioral activation system (Westerhof & Bohlmeijer, 2010). The behavioral activation system is assumed to regulate behavior concerning rewards and that is why extraverts, in opposite to introverts, show higher reward sensitivity and eventually experience more positive emotions (Gray, 1981; Lucas & Diener, 2008). In sum, there are several theoretical explanations that emphasize the relationship between PA and the Big Five personality characteristics, especially E. Additionally, previous research approved some of these relationships by finding associations between PA and the Big Five dimensions. Research questions and Hypotheses The aim of the present study was to investigate the role of the Big Five personality traits in the development of positive state affect over time. Note, that in the present study the International Personality Item Pool (IPIP, 2014) was used to measure the Big Five personality characteristics. This scale measures emotional stability (ES) rather than N and intellect/imagination (I) rather than O. N and ES are interpreted as opposites, thus high scores on N correspond to low scores on ES, and vice versa. That is why in the following ES and I will be used instead of N and O, respectively. Research question 1: The current state of research repeatedly found relationships between all Big Five personality dimensions and PA on both state and trait level. Several theoretical approaches provided possible explanations for these associations (see section above). Given these findings and theories, the first research question is: Are the associations between the five personality dimensions and PA replicated in the present study, when PA is measured at a state level? Hypothesis 1 assumes that the present study will find E, A, C, ES and I having positive associations with positive state affect, with E having the strongest relationship of all Big Five personality dimensions. In other words, it is assumed that people scoring high on E, A, C, ES and I will show significantly higher scores on PA over time than people scoring low on E, A, C, ES and I, respectively.. 10.
(12) Research question 2: To our knowledge, the current state of research provides no knowledge about the role of personality in the development of PA over years. The second research question addresses this subject: What is the role of personality in the development of positive state affect over time? To gain first insights, the dynamic equilibrium model of Headey and Wearing (1992) provides the opportunity to approach the role of E in the development of PA. The model states that after a positive or negative live event caused a deviation of the equilibrium level of PA, E is, as a stable personality characteristic, thought to serve the return to the PA baseline level. As mentioned above, E is thought to be the driving force in the returning process and so it could be derived that after a life event occurs, extraverts might return faster to their baseline PA level than low scorers on E. Hypothesis 2 assumes that there is no significant fluctuation in either direction (increase and/or decrease) in PA over time for people with high scores on E. In contrast, people with low scores on E are expected to show significant increases and/ or decreases of PA level over time, because of their assumed slower return to their PA equilibrium level. Additionally, the role of I in the development of PA over time is investigated more precisely. People scoring high on I, like on O, are thought to have a broader and deeper scope of awareness and tendency to broaden their experience (McCrae & Costa, 1991) and are therefore supposed to feel both positive and negative experiences more deeply, which in turn could result in a fluctuation (increase and/ or decrease) in PA over time. Given these specific characteristics of I, hypothesis 3 assumes that a significant change in either direction (increase and/or decrease) in PA over the years will be visible for high scorers on I. In contrast, people scoring low on I are expected to experience no significant increase or decrease in PA across the time. Finally, an explorative analysis of the personality dimensions A, C and ES is conducted to complete the first insights into the role of personality in the development of PA over time.. 11.
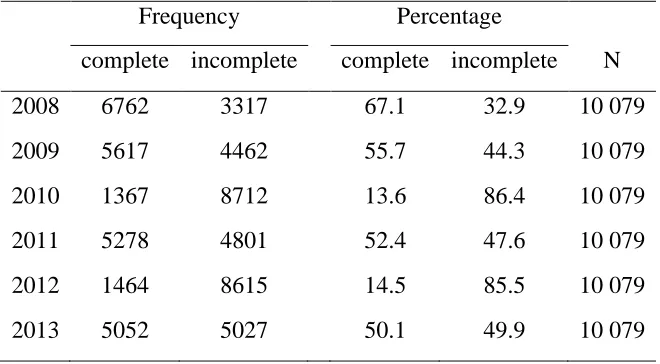
(13) Methods Procedure The present study draws on data from the Dutch Longitudinal Internet Studies for the Social sciences (LISS panel) administered by CentERdata (Tilburg University, The Netherlands). The internet panel is representative as it is based on a true probability sample of 5000 households that was drawn from the population register by Statistics Netherlands. For the LISS Core Study, participants were invited to fill out the same online questionnaires every year. The questionnaires included different main topics: Health, Politics and Values, Religion and Ethnicity, Social Integration and Leisure, Family and Household, Work and Schooling, Personality, and Economic Situation and Housing. The present study made use of the core module on personality over four measurement occasions: May 2008, May 2009, May 2011 and May 2013. From 10 079 respondents that participated between 2008 and 2013, 28 % (N= 2826) completed all relevant items and were included in the analysis. The measurement moments in May 2010 and May 2012 were excluded from the analysis because of the high rate of missing values (see Table 1) and because none of the respondents completed all relevant items among all six measurement moments. Table 1 Response rate 2008 - 2013 Frequency. Percentage. complete incomplete. complete incomplete. N. 2008. 6762. 3317. 67.1. 32.9. 10 079. 2009. 5617. 4462. 55.7. 44.3. 10 079. 2010. 1367. 8712. 13.6. 86.4. 10 079. 2011. 5278. 4801. 52.4. 47.6. 10 079. 2012. 1464. 8615. 14.5. 85.5. 10 079. 2013. 5052. 5027. 50.1. 49.9. 10 079. Participants The information about demographics was gathered by questions in the wave 2008 about age, gender, marital status and educational level.. 12.
(14) A sample of 2826 participants between the ages of 15 and 87 were included in the present study. Of the respondents, about half (52.9%, N = 1494) were female; 8.4% (N = 236) were aged 15-24 years, 10.2% (N = 288) 25-34 years, 18.1% (N = 511) 35-44 years, 23% (N = 649) 45-54 years, 25.7% (N = 725) 55-64, and 14.8% (N = 417) were aged 65 and older. The mean age was 49 (SD = 15.16). Regarding the educational level, 4.2% (N = 119) of the respondents had primary education, 26.7% (N = 755) intermediate secondary education, 8.5% (N = 240) higher secondary education, 23.5% (N = 668) intermediate vocational education, 25.3% (N = 716) higher vocational education, and 10% (N = 282) university education. 65% (N = 1837) of the respondents were married, 22.4% (N=633) have never been married, 0.4% (N=10) are separated, 8.3% (N=234) are divorced and 4% (N=112) are widow or widower. For the purpose of the present study, it was necessary to just include people in the sample that filled in all relevant items across the six years, because for the analysis by repeated-measures ANOVA’s data without missing values were required. Although the sample size was reduced strongly (see previous section), and the group of people that remained has to be seen as a selective sample, a comparison between the reduced and total sample size indicated that the representative character was maintained. Regarding the personality dimensions, a comparison with the total sample showed a higher mean value (and the same SD) on C by one point for the reduced sample. On the contrary, the mean values and SD’s of E, A, ES and I did not differ between the sample sizes (see Appendix A). Additionally, small differences in age, education, marital status and PA level were found. For example, the mean age and PA level were slightly higher in the reduced sample. However, the small differences did not create the impression that a distortion of the results took place. Taken together, the sample size of the present study is still considerably high and representative, and thus justifies, in this case, the use of a sample that exclusively involves completers. Measurements Positive Affect Positive state affect was measured by using the positive affect subscale of the Positive and Negative Affect Schedule (PANAS-PA, Watson, Clark & Tellegen, 1988), wherein the intensity of positive affect is measured at a specific moment in time. The items consisted of 10 words representing feelings and emotions. The respondents were asked to rate on a 7-point 13.
(15) scale, from not at all (1) to extremely (7), to what extent he or she experienced the specific emotions at the present moment. The PANAS-PA included the following items: interested, excited, strong, enthusiastic, proud, alert, inspired, determined, attentive and active. The scores were added to a total score with a range of 10 - 70, with higher scores indicating higher levels of PA. The internal consistency (Cronbach’s alpha) for the present study was 0.86. Personality Personality was measured by using the 50-item version from the International Personality Item Pool (IPIP, 2014). The IPIP was designed to measure the Big Five personality dimensions by 10 items per subscale: extraversion (E), agreeableness (A), conscientiousness (C), emotional stability (ES; reversed neuroticism), and intellect/imagination (I). Gow, Whiteman, Pattie and Deary (2005) found in a sample of students high correlations between the IPIP ES-scale and the NEO N-scale (-.83) and also between the IPIP I-scale and the NEO O-scale (.59). The negative correlation between the ES/N-scales indicates that ES and N can be regarded as opposites. That is why in the present study a high score on ES is interpreted as a low score on N and vice versa. The items of the IPIP consisted of statements that described people’s behavior. The participants were asked to rate on a 5-point scale, from very inaccurate (1) to very accurate (5), how precisely the statements described themselves as they generally were now. Example items were ‘Get irritated easily‘(reversed ES) and ‘Sympathize with others’ feelings’ (A). For the scoring procedure, each item marked with a ‘+’ was summed up to a total score, and each item marked with a ‘-‘ was summed up in a reversed way to a total score. The total score of each subscale varied between 10 and 50, with higher scores indicating higher levels of the personality dimension in question. For each personality dimension, a new variable representing the total score was calculated using the first measurement occasion (2008). The internal consistency (Cronbach’s alpha) in the present study was 0.86 for the E-scale, 0.75 for the A-scale, 0.77 for the C-scale, 0.87 for the ES-scale and 0.77 for the I-scale. To interpret the total score, the present study followed the recommendation of the IPIP’s publisher (Goldberg, 1999) to first calculate the sample mean for every personality dimension and then to interpret the scores within one-half SD above and below the mean as ‘average’, and scores above or below that range as ‘high’ or ‘low’, respectively (IPIP, 2014). As the average category was not of interest for the present study, it was excluded. Five new dichotomous variables were computed representing the low and high scorers of E, A, C, ES and I (see Appendix A). 14.
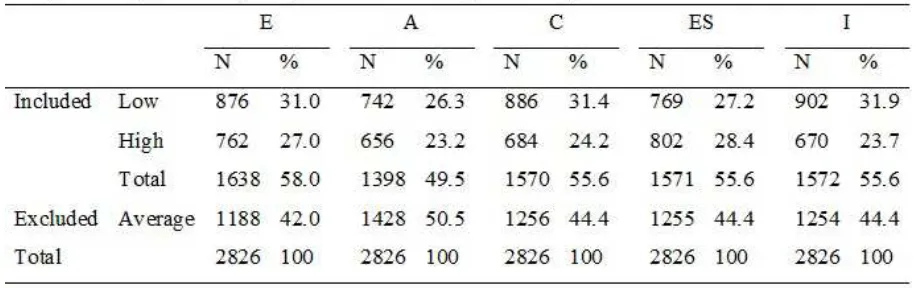
(16) Analysis For the analysis, the program IBM SPSS Statistics 21 was used. To investigate the first research question that asked whether the associations between the five personality dimensions and PA are replicated in the present study, when PA is measured at a state level, Pearson correlation analyses were conducted. More precisely, to examine whether E is related most strongly to PA of all the Big Five personality dimensions (hypothesis 1), Pearson correlation analyses were conducted for all five personality dimensions by using the data of 2008, as they are the starting point for the present study. Correlations ≤ .35 were interpreted as low or weak, .36 – .67 as moderate and .68 – 1.0 as high and strong with ≥ .90 as very high correlations (Mason, Lind & Marchal, 1983). Additionally, a multiple linear regression analysis was used to test if the personality traits significantly predicted the participants’ ratings of PA, when it was simultaneously controlled for the other personality characteristics, respectively. For that, the PA values of 2008 served as the dependent variable and all personality dimensions were included as independent variables. The second research question addressed the role of the Big Five personality dimension in the development of PA over time. To begin with, the differential stability of PA was determined by calculating a Pearson correlation coefficient for the PA values of the two years 2008 and 2013. For the explorative analyses regarding A, C and ES as well as hypotheses 2 - 3 five repeated-measures ANOVA’S were conducted to investigate the main effects of time, of the personality groups (high and low scorers), and the interaction between time and group for each personality dimension. In each repeated-measures ANOVA the total scores of PA were used as the within-subjects factor including 4 levels (four measurement occasions) and the different personality dimensions as the between-subjects factor, divided into high/low scorers. Note, that for the repeated-measures ANOVA’s only the people scoring high and low on the specific personality dimensions were included (see Table 2 for the number of included respondents). As the assumption of sphericity was not confirmed in all five repeated-measures ANOVA’s, the Greenhouse-Geisser values were always used for interpretation.. 15.
(17) Table 2. Additionally, descriptive statistics of PA for the high and low scorers were examined to gain further information about the direction of change, when main effects in group, in time and in interaction between time and group were found. Post Hoc tests with Bonferroni correction were calculated to get more specific information about changes in PA for low and high scorers on E and I (hypotheses 2 and 3). Results Relationship between Positive Affect and the Big Five personality dimensions To investigate whether the associations between the five personality dimensions and PA that were found in previous research are replicated in the present study, when PA is measured at a state level (research question 1), the first hypothesis was tested. More precisely, to test whether E shows the strongest positive association with PA among all Big Five personality dimensions (hypothesis 1), Pearson correlation coefficients were calculated. The results indicate that all five personality characteristics have statistically significant positive and weak relationships with PA (Table 3). E (r = .31, p < .01) actually has the strongest association with PA among all personality dimensions. However, the strength of the associations between A (r= .21, p < .01), C, I (with respectively r = .25, p < .01), ES (r = .24, p < .01) and PA do not differ greatly in comparison to the correlation between E and PA.. 16.
(18) Table 3 Pearson correlation coefficients among PA and Big Five personality dimensions in 2008 (N=2826) E A C ES I PA 2008. .32**. .21**. .25**. .24**. .25**. E. 1. .31**. .10**. .29**. .36**. A. .31**. 1. .32**. .05*. .27**. C. .10**. .32**. 1. .18**. .21**. ES. .29**. .05*. .18**. 1. .20**. I. .36**. .27**. .21**. .20**. 1. ** Correlation is significant at the .01 level (2-tailed). * Correlation is significant at the .05 level (2-tailed). Additionally, a multiple linear regression analysis was used to test if the personality traits significantly predicted participants’ ratings of PA. The results of the regression indicated that the five predictors together (E, A, C, ES and I) explained 17.7% of the variance of PA (F(5,2825)= 121.54, p < .000). It was found that all Big Five personality dimensions significantly predicted PA: E (ß= 0.21, p< .000), A (ß= 0.07, p= 0.001), C (ß= 0.16, p< .000), ES (ß= 0.13, p< .000) and I (ß= 0.10, p< .000). Taken together, the results of the Pearson correlations coefficients above and the multiple linear regression analysis indicate that hypothesis 1 can be confirmed, as E shows the strongest relationship with PA, even when it was controlled for the other personality dimensions. Stability of Positive Affect The next step of the analysis was to investigate the role of the Big Five personality dimensions in the development of positive state affect over the six year period of time (research question 2). To begin with, the differential stability of PA was determined by calculating a Pearson correlation coefficient. The result indicated a moderate stability of PA over a period of 6 years (2008-2013) with r= .52 (p< .001). Table 4 gives further information about the development of PA over the years. In general, a decrease of PA mean values among the time period of six years occurred: in 2008 the mean PA score was M = 46.30 (SD = 9.66) and dropped to M = 43.83 (SD = 10.21) in 2013. Additionally, Pearson correlation coefficients between PA scores on the different measurement occasions show a slight decrease in strength with an increasing distance between the compared years.. 17.
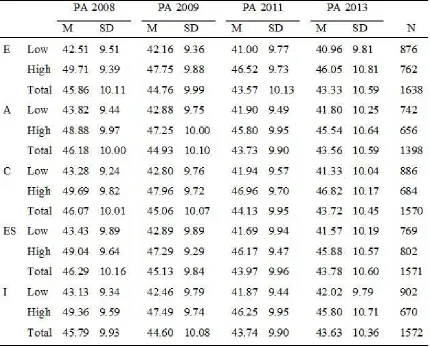
(19) Table 4 Descriptive statistics and correlations of PA across the measurement occasions (N=2826) M. SD. PA 2008. PA 2009. PA 2011. PA 2013. PA 2008. 46.30. 9.66. 1. .58*. .54*. .52*. PA 2009. 45.15. 9.72. .58*. 1. .57*. .52*. PA 2011. 44.05. 9.74. .54*. .57*. 1. .58*. PA 2013. 43.83. 10.21. .52*. .52*. .58*. 1. *Correlation is significant at the .01 level (2-tailed) Table 5 provides first insights into the development of PA per personality dimension: both high and low scorers on each personality dimension experience a decrease in PA over the six years. Table 5 Descriptive statistics for PA of low and high scorers at all personality dimensions among all measurement occasions. 18.
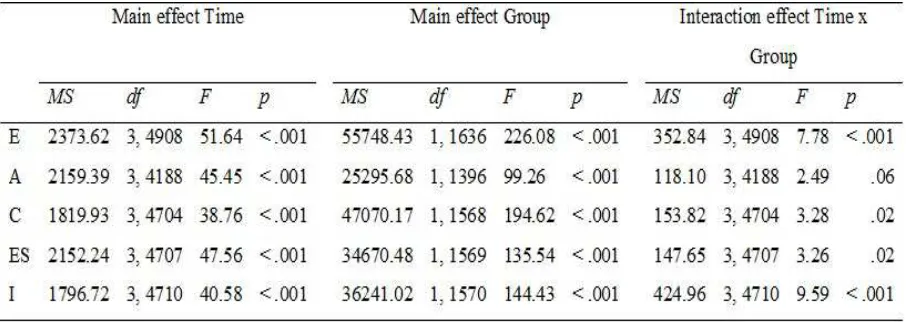
(20) Role of personality in development of Positive Affect over the years The next step in gaining first insights into the role of personality in the development of PA was to conduct repeated-measures ANOVA’s. Firstly, the results of the five repeatedmeasures ANOVA’s further confirmed the assumption of hypothesis 1, which assumed that people scoring high on E, A, C, ES and I respectively, will show significantly higher scores on PA across the four measurement occasions than people scoring low on E, A, C and ES, respectively. Significant main effects in groups (high and low scorers) were found for all five personality dimensions (Table 6), indicating significantly different PA scores for high and low scorers on all Big Five personality dimensions over time. Figure 1 and Table 5 additionally illustrate that the mean values for high scorers on E, A, C, ES and I are higher over time than for low scorers on these personality dimensions. Table 6 Main effect time, main effect group and interaction effect time x group for all five personality dimensions. 19.
(21) Figure 1 PA mean scores for low and high scorers on E, C, ES, I among the measurement occasions. Extraversion. Conscientiousness. Emotional Stability. Imagination. Secondly, all five repeated-measures ANOVA’s, each with one of the Big Five personality dimensions as a between-subjects factor, show significant main effects in time (Table 6), indicating that the previously observed change in PA mean scores over the time is significant for all personality dimensions. Finally, the repeated-measures ANOVA's show significant interaction effects between the factors 'time' and 'group' for E, C, ES and I (Table 6), indicating that a change in PA 20.
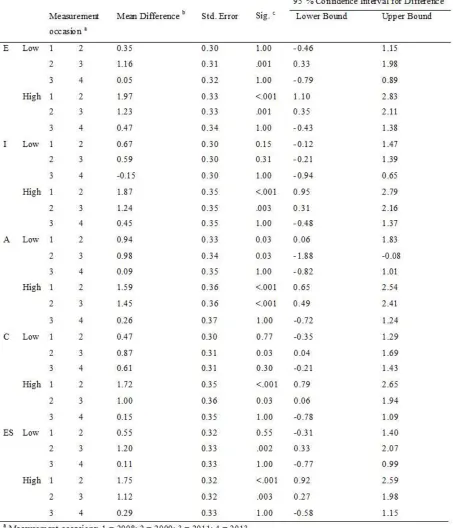
(22) scores over time was different for high and low scorers on these personality dimensions, respectively. For A, however, the interaction effect was not significant, F (3, 4188) = 2.49, p = .06. To get a better impression of where exactly the differences took place and to analyze the role of E and I in the development of PA, Pos Hoc tests with Bonferroni corrections were conducted. The Post Hoc tests with Bonferroni corrections show that for low scorers on E a significant change in PA took place between 2009 and 2011, p = .001 (see Table 7). Table 5 illustrates that PA decreased for those people in that period of time. High scorers on E experienced a significant decrease in PA between 2008 and 2009 (p <.001) and also between 2009 and 2011 (p = .001). Thus, hypothesis 2 that assumed that there is no significant increase or decrease in PA scores across the four time periods for high scorers on E, has to be rejected. Furthermore, the Post Hoc tests with Bonferroni corrections show that for low scorers on I no significant change in PA between the four measurement moments occurred. High scorers on I experienced a significant decrease in PA between 2008 and 2009 (p < .001) and between 2009 and 2011 (p < .003) (see Table 7 and Table 5). Thus, the results confirm hypothesis 3, which predicted a significant increase or decrease in PA scores over the four measurement occasions for high scorers on I, whereas it was expected that people scoring low on I would not experience a significant fluctuation in either direction in PA scores across the time. Finally, regarding the explorative analysis the Post Hoc tests with Bonferroni correction indicated for A, C and ES that firstly for both high and low scorers on A a significant decrease regarding the PA level took place between 2008 and 2009 and between 2009 and 2011. Secondly, a significant decrease in PA could be observed for both low scorers on C and ES between 2009 and 2011 and for both high scorers on C and ES between 2008 and 2009 and between 2009 and 2011, respectively.. 21.
(23) Table 7. 22.
(24) Discussion Previous research about emotions usually addressed the negative ones, whereas the present study focused, in compliance with the recent development of defining mental health in a positive way, on PA, as it is part of the affective component of EWB. Despite the common view of seeing affect as a momentary appearance that depends exclusively on the situational factors, previous research found repeatedly associations between personality and PA, with E having the strongest connection (e.g. DeNeve & Cooper, 1998; Steel, Schmidt & Shultz, 2008). This was leading to the assumption that even momentary affect has to a certain extent a dispositional character (Watson, Clark & Tellegen, 1988). However, previous research left the open question of what role extraversion, agreeableness, conscientiousness, emotional stability and imagination play in the development of positive state affect over a longer period of time. The aim of the present study was to fill that gap. Associations between Positive Affect and the Big Five personality dimensions In general, the present study did replicate the associations found by previous research between the Big Five personality dimensions and PA (research question 1). The strength of the associations between E and PA and between A, C, ES, I and PA respectively did not differ greatly. In contrast to DeNeve and Cooper (1998), A was not found to have the second strongest association with PA. On the contrary, A showed the lowest correlation of all Big Five personality characteristics. That finding is in compliance with a more recent metaanalysis of Steel and colleagues (Steel, Schmidt & Shultz, 2008), that also found A to have the weakest connection with PA. The different results could be explained by commensurability of the studies included in the meta-analysis of DeNeve and Cooper (1998). Steel et al. (2008) criticizes that DeNeve and Cooper (1998) compared essentially different measures in their meta-analysis, which eventually resulted in weaker correlations between personality and PA. Furthermore, a difference in the strength of correlations between the present study and the meta-analysis of Steel et al. (Steel, Schmidt & Shultz, 2008) can be explained with the different definitions of positive state affect. For example, Steel and colleagues (Steel, Schmidt & Shultz, 2008) defined studies as measuring the state level when the ratings of PA contained the time frame of one moment up to one month, whereas the present study defined just a moment rating as measuring the state level. Previous research found the strength of the association to be rising with increasing temporal aggregation, considering PA ratings that include long time periods, such as the rating of emotions over the past weeks, past year, or in general. In such ratings, respondents average their affective 23.
(25) experiences over a longer time frame and over more life events (Watson, Clark & Tellegen, 1988). That is why in the present study the as low interpreted associations between respectively E, A, C, ES, I and PA should not be underestimated. The explained variance of PA by all Big Five personality dimensions is different to the variance found by Steel and colleagues (Steel, Schmidt & Shultz, 2008). They found N, E, O, A and C measured by the NEO scale to explain the variance of PA by 24%. A possible explanation for the difference between the variance of the present study (17.7%) and the variance found by Steel, Schmidt and Shultz (2008) could also be the commensurability as different personality models underlie the IPIP and the NEO. Steel and colleagues (2008) found that the different personality models that underlie the NEO (Costa & McCrae, 1992), EPQ (Eysenck & Eysenck, 1975) and EPI (Eysenck & Eysenck, 1964) account for significantly different amounts of variance in PA. Despite the moderate to strong correlations between the IPIP and NEO (Gow, Whiteman, Pattie & Deary, 2005) such differences in commensurability could have lead to the different variances, as the NEO measures N instead of ES and O instead of I. The IPIP I-dimension seems to stress more the items assessing ideas and imagination, whereas the NEO O-scale items seem to be somewhat broader in their scope and involve the aspect of trying new experiences (Gow, Whiteman, Pattie and Deary, 2005). However, hypothesis 3 that addressed I could be confirmed, despite that it was based on literature about O. This might suggest that the differences between the scales did not affect all results of the present study. Nevertheless, the correlations between the scales are not perfect and future research should consider these differences in commensurability when deducing hypotheses from previous literature and research. Finally, the present study replicated the finding of previous research (e.g. Steel, Schmidt & Shultz, 2008) of E having the strongest association of all Big Five personality dimensions with positive state affect (hypothesis 1). Hypothesis 1 was further confirmed by the finding that people scoring high on each of E, A, C, ES and I having significantly higher scores on PA across the four measurement occasions than people scoring low on E, A, C, ES and I, respectively. These results are in line with several theoretical explanations. Firstly, they are in compliance with the instrumental (behavioral) approach according to which the specific characteristics of the different personality dimensions are thought to facilitate the experience of positive feelings in an indirect way (Lucas & Diener, 2008). Secondly, the temperamental theory emphasizes E as the most important personality characteristic having a relationship with PA by assuming that people scoring high on E facilitate the experience of positive feelings through the direct route of being more cheerful and enthusiastic than introverts (Costa 24.
(26) and McCrae, 1980). Finally, the construct similarity between E and PA also supports this connection. Yik and Russell (2001) pointed out that many of the terms used to describe E (e.g. optimistic, energetic, and sociable) also appear in measures of PA. The role of personality in the development of Positive Affect The second research question addressed the role of personality in the development of PA over time. In general, first insights were gained by detecting that decreases in PA over time took place on different measurement occasions for high and low scorers on each of the personality dimensions, except for A, where the decreases took place at the same moments over time. More detailed results were found for E and I, as discussed below. It was assumed that the results would show no significant increase or decrease in PA scores across time for high scorers on E in comparison to low scorers on E (hypothesis 2). This hypothesis could not be confirmed, as the results indicated a significant decrease in PA levels for both high and low scorers on E. The finding disagrees on the first sight with the dynamic equilibrium model (Headey and Wearing, 1992) as explained above, and is accompanied by the finding that PA scores for the general sample decrease over the six years. However, because of the long period of time between the measurement occasions and given that eventually all people, independent of their personality traits, are thought to return to their baseline level, the present study could probably not detect any difference in returning time between high and low scorers on E. A recommendation for future research might be to connect the measurement of PA to concrete life events and repeat the measurement e.g. monthly to detect possible differences in the speed of return to the baseline level of PA between extraverts and introverts. An additional possible explanation for the falsification of hypothesis 1 is the way the present study categorized the high and low scorers (range of one half SD above/below the mean). This way of categorizing the personality dimensions has the advantage of achieving relatively broad groups of high and low scorers, in comparison to determine a range of one SD above/below the mean that would result in smaller groups of more extreme high/low scorers. The present study chose for one half SD in order to compensate for a certain fluctuation within the sample regarding the personality scores across the years. Although the absolute and differential continuity of personality suggested that the personality characteristics were stable over the six years (see Appendix B), the stability was not perfect, partly because the IPIP cannot be a perfectly reliable measure (McAdams, 2009). The calculation of smaller groups with more extreme high/low scorers might have lead to a 25.
(27) fluctuation with respondents scoring high/low on a specific personality dimension in 2008 eventually scoring average in 2013. To compensate for such an effect, it was decided to make broader groups of high and low scorers. One consequence of that decision is, however, that people included in the high and low groups might not represent the specific characteristics that are described in literature for people scoring very high or low on a specific personality dimension. For example, people scoring very high on E are thought to be cheerful and enthusiastic (Costa and McCrae, 1980). That in turn might explain, why extraverts were not found to return earlier to their baseline level of PA than introverts. A comparison with the total sample of the present study indicated no considerable differences between the mean scores of the IPIP factors (see Appendix A). Whereas a comparison with a Scottish study (Gow, Whiteman, Pattie and Deary, 2005) actually showed differences, with the mean scores of the five IPIP factors of the present study being considerably higher (see Appendix A). However, because personality characteristics should be interpreted as a continuum and not as static groups, it is difficult to say at what point people should show the specific characteristics of a personality trait. However, there was a small significant decrease in PA. Considering the mean values, the decrease in PA is not very strong, so one could argue that the baseline level is still maintained over the years. The moderate differential stability of PA indicates that people tend to hold their relative positions on PA between the measurement occasions. Additionally, according to Diener, Lucas and Scollon (2006), the baseline level of wellbeing is not static and can change to some extent over a longer period of time as a consequence of life events. It is also noteworthy that between the last measurement occasions (2011 and 2013) the significant decrease in PA stopped for all groups of all personality dimensions. To be able to determine whether the trend of the decrease in PA is remaining, it is necessary to observe its development over a longer time period (e.g. over decades). Finally, regarding the interpretation of the decrease in PA between two measurement moments, it does not seem necessary to take into account that the timeframes between measurement moments 2 and 3 and between 3 and 4 is two years respectively, in comparison to the one year period between measurement occasion 1 and 2. That is because the moderate differential stability of PA between the measurement occasions is nearly consistent. Furthermore, the results confirmed hypothesis 3, which assumed a significant increase or decrease in either direction for PA scores over the four measurement occasions for high scorers on I, whereas it was expected that people scoring low on I would not experience a significant change in PA scores across time. People scoring high on I are expected to have, 26.
(28) like people scoring high on O, a broader and deeper scope of awareness and the tendency to broaden their experience (McCrae & Costa, 1991). As a consequence, I is thought to facilitate a deeper experience of both positive and negative feelings and thus to experience changes in either direction in their level of PA over time. Strengths and Limitations A strength of the present study was the measurement of PA with the PANAS, because it measures the intensity of PA as a distinct component from negative affect. Research about the PANAS showed that positive and negative affect are two independent factors and can be seen as orthogonal dimensions (Watson, Clark & Tellegen, 1988). An index that integrates positive and negative affect into one ‘happiness’ score, instead of measuring them separately, is supposed to be at risk of losing valuable information (Diener, 2000). Additionally, for instance, Lucas and Diener (1999) recommend the use of a scale that considers the intensity and not just the frequency of affect, because this way one can gain more specific information about evaluation processes that underlie a person’s judgments about his or her life. They state the example of two individuals that experience a similar quantity of positive and negative events and thus would have the same ratio of positive and negative affective experiences, but in fact do have very different lives according to their experienced intensity of affect. Thus, the PANAS enabled the measurement of a ‘pure’ PA value and took the quality of PA in terms of the experienced intensity into account. The present study found a moderate differential stability of positive state affect over the six year period of time. This finding is in compliance with a study of Watson and colleagues (Watson, Clark & Tellegen, 1988) that also found a moderate stability of positive state affect. Still, the finding of the present study is interesting, as the time period of stability is with six years considerably longer than in the study of Watson and colleagues, which investigated an eight-week period of time. The fact that PA shows such a stability over six years emphasizes the conclusion of Watson, Clark and Tellegen (1988), that even moment ratings of affect do, to a certain extent, have a strong dispositional character. Note, that state and trait affect are seen as one continuous dimension (Steel, Schmidt & Shultz, 2008). The present study did measure affect on a state level, but a limitation is that it was not controlled for possible effects of trait affect that might underlie momentary moods. Thus, one explanation for the found stability of positive state affect in the present study could be that trait affect did underlie the experience of momentary moods and might have had some impact 27.
(29) on the stability of positive state affect across time. In order to make predictions about positive state affect, future research might control for affect on a trait level. Recommendations To gain first impressions about the relationship between personality and PA over a long time period, the present study investigated the association between PA and each of the Big Five personality dimensions. A recommendation for future research is to investigate the relationship between certain combinations of personality characteristics and PA, because personality is a rather complex construct consisting of an individual’s combination of multiple facets and traits. Furthermore, this could lead to new insights regarding the idea of a possible existence of a ‘happy personality’ (DeNeve & Cooper, 1998). That is, if certain combinations of personality characteristics might predispose people to experience in general a preponderance of PA. Based on the results of the present study and the meta-analysis of Steel, Schmidt and Shultz (2008) an interesting question for future research might for example be if people scoring simultaneously high on E, C and low on N/high on ES would experience more PA over time in comparison to people that score high on just one of E, C, ES/low on N, or in comparison to average scorers. It is important to gain deeper insights into the relationship between personality characteristics and PA, as these results may have certain implications for practice, as illustrated below. Positive emotions can serve as a starting point for mental health promotion programs like they are used within Positive Psychology, because research indicates that happiness and positive emotions precede positive outcomes on certain life domains and on physical and mental health (Fredrickson & Levenson, 1998), instead of just being a result of them (Lyobomirsky, Kind & Diener, 2005). The aim of mental health promotion programs is to use the beneficial implications of positive emotions to support or improve mental health and prevent or reduce mental problems in case of stress (Bohlmeijer, Bolier, Westerhof & Walburg, 2013). Furthermore, there are even considerations of how environmental factors and policy decisions could support EWB on a national level to increase the overall quality of life in societies (Lucas & Diener, 2008). However, as the present study and previous research (e.g. Steel, Schmidt & Shultz, 2008) indicated that personality accounts for a considerable part of PA and thus also of EWB, the question comes up to what extent PA is susceptible and to what extent it would be important to take into account individual differences in personality. For example, it might be necessary to give high scorers on N extra support, while people that score high on E might have an inherent advantage in learning and using problem solving 28.
(30) behavior due to their disposition. Thus, before implementing interventions on individual or national level, questions concerning specific personality characteristics of the target group might have to be addressed. Nonetheless, aspirations of using the beneficial consequences of positive emotions should not get discouraged by the dispositional character of PA and EWB. After all, personality is known to change to a certain extent over time (McAdams, 2009), and with it probably its relationship with PA. Furthermore, next to personality are situational factors and life circumstances also an important correlate of EWB and could be used as a starting point for positive change. Taken together, positive emotions do serve as a promising starting point for mental health promotion programs, when the role of individual personality differences are clarified and, if necessary, taken into account during the implementation.. Conclusion The present study confirmed the results of previous research that personality does to a certain extent play a role in the experienced PA level over time as high scorers on all investigated personality dimensions experienced significantly higher PA levels than low scorers. Additionally, the results suggest that personality does play a role in the development of PA, because a decrease in PA level over time took place on different measurement occasions for high and low scorers on each personality dimension, except for A where the changes appeared at the same measurement occasions. The personality characteristic I seemed to play a special role, as people scoring low on this dimension did not experience a significant increase or decrease in PA level over the six year period of time. Taken together, the present study gained the insight that personality does, to a certain extent, matter in the development of PA over time. This provides the opportunity for further research to investigate in what way it is necessary to take into account individual differences in personality to guarantee a successful implementation of mental health promotion programs.. 29.
(31) Appendix A Descriptive statistics and category range for E, A, C, ES and I for present study (reduced and total sample) and for study of Gow, Whiteman, Pattie and Deary (2005) (rounded numbers) Reduced Sample. Total sample. Study Gow et al. (2005). M (SD). Low. High. M (SD). M (SD). E. 33 (6). Lowest – 30. 37 – Highest. 33 (6). 22 (8). A. 39 (5). Lowest – 36. 43 – Highest. 39 (5). 32 (6). C. 38 (5). Lowest – 35. 42 – Highest. 37 (5). 27 (6). ES. 34 (7). Lowest – 30. 39 – Highest. 34 (7). 21 (8). I. 35 (5). Lowest – 32. 39 – Highest. 35 (5). 27 (6). Appendix B Stability coefficients of personality for the time interval 2008 – 2013 Person’s correlation coefficient r Extraversion. .77*. Agreeableness. .68*. Conscientiousness. .69*. Emotional Stability. .71*. Imagination. .72*. * Correlation is significant at the .01 level (2-tailed).. 30.
(32) References Bohlmeijer, E.T., Bolier, L., Westerhof, G.J. & Walburg, J.A. (2013). Handboek Positieve Psychologie – Theorie, Onderzoek, Toepassingen. Amsterdam: Boom. Burger, J.M. & Caldwell, D.F. (2000). Personality, social activities, job-search behavior and interview success: Distinguishing between PANAS trait positive affect and NEO extraversion. Motivation and Emotion, 24, 51–62. Costa, P.T., Jr., & McCrae, R.R. (1980). Influence of extraversion and neuroticism on subjective well-being. Happy and unhappy people. Journal of Personality and Social Psychology, 38, 668–678. Costa, P.T., & McCrae, R.R. (1992). Revised NEO Personality Inventory (NEO PI-R) and NEO Five-Factor Inventory professional manual. Odessa, FL: Psychological Assessment Resources. DeNeve, K.M. & Cooper, H. (1998). The Happy Personality: A Meta-Analysis of 137 Personality Traits and Subjective Well-Being. Psychological Bulletin, 124(2), 197229. Diener, E. (1984). Subjective well-being. Psychological Bulletin, 95, 542–575. Diener, E., Lucas, R. & Scollon, C. (2006). Beyond the hedonic treadmill: Revising the adaptation theory of well-being. American Psychologist, 61, 305-314. Diener, E., Sandvik, E., & Pavor, W. (1991). Happiness is the frequency, not the intensity, of positive versus negative affect. In F. Strack,M. Argyle, & N. Schwarz (Eds.), Subjective well-being: An interdisciplinary perspective (pp. 119–139). Elmsford, NY: Pergamon Press. Diener, E., Suh, E.M., Lucas, R.E. & Smith, H.L. (1999). Subjective Well-Being: Three Decades of Progress. Psychological Bulletin, 125 (2), 276-302. Diener, E. (2000). Subjective Well-Being. The Science of Happiness and a Proposal for a National Index. American Psychologist, 55 (1), 34-43. DOI 10.1037//0003066X.55.1.34. 31.
(33) Eysenck, H.J. & Eysenck, S.B.G. (1964). Manual of the Eysenck Personality Inventory. San Diego, CA: Educational and Industrial Testing Service. Eysenck, H. J., & Eysenck, S. B. G. (1975). Manual for the Eysenck Personality Questionnaire (Junior and Adult). London: Hodder & Stoughton. Fredrickson, B.L. (1998). What good are positive emotions? Review of General Psychology, 2(3), 300–319. Fredrickson, B.L. & Levenson, R.W. (1998). Positive emotions speed recovery from the cardiovascular sequelae of negative emotions. Cognitions and Emotion, 12, 191-220. Goldberg, L. R. (1999). A broad-bandwidth, public domain, personality inventory measuring the lower-level facets of several five-factor models. In I. Mervielde, I. Deary, F. De Fruyt, & F. Ostendorf (Eds.), Personality Psychology in Europe, Vol. 7 (pp. 7-28). Tilburg, The Netherlands: Tilburg University Press. Gow, A.J., Whiteman, M:C., Pattie, A. & Deary, I.J. (2005). Goldberg’s ‘IPIP’ Big-Five factor markers: Internal consistency and concurrent validation in Scotland. Personality and Individual Differences, 39, 317-329. DOI 10.1016/j.paid.2005.01.011 Gray, J.A. (1981). A critique of Eysenck’s theory of personality. In H. J. Eysenck (Ed.), A model for personality (pp. 246–276). New York: Springer-Verlag. Headey, B. & Wearing, A. (1992). Understanding happiness: A theory of subjective wellbeing. Melbourne, Victoria, Australia: Longman Cheshire. International Personality Item Pool (2014): A Scientific Collaboratory for the Development of Advanced Measures of Personality Traits and Other Individual Differences (http://ipip.ori.org/). Internet Web Site. Yik, M.S.M. & Russell, J.A. (2001). Predicting the Big Two of affect from the Big Five of personality. Journal of Research in Personality, 35,247–277. Kahneman, D. (1999). Objective happiness. In D. Kahneman, E. Diener, & N. Schwarz (Eds.), Well-being: The foundations of hedonic psychology (pp. 3–25). New York: Sage Foundation.. 32.
(34) Keyes, C.L.M. (2005). Mental illness and/or mental health? Investigating axioms of the complete state model of health. Journal of Consulting and Clinical Psychology, 73, 539-548. Lucas, R.E & Diener, E. (1999). Personality and Subjective Well-Being. In E. Diener (2009). The Science of Well-Being. The Collected Works of Ed Diener (pp. 75-102). Dodrecht Heidelberg, London, New York: Springer. DOI 10.1007/978-90-481-2350-6 Lucas, R.E. & Diener, E. (2008). Subjective Well-Being. In M. Lewis, J.M. Haviland-Jones & L. Feldman Barrett (Eds.), Handbook of Emotions (pp. 471-484): New York: Guilford Press. Lucas, R.E. & Fujita, F. (2000). Factors Influencing the Relation Between Extraversion and Pleasant Affect. Journal of Personality and Social Psychology, 79 (6), 1039-1056. Lyubomirsky, S., King, L. & Diener, E. (2005). The benefits of frequent positive affect: Does happiness lead to success? Psychological Bulletin, 131, 803-855. Mason, R.O., Lind, D.A., Marchal, W.G. (1983). Statistics: An Introduction. New York: Harcourt Brace Jovanovich Inc. McAdams, D.P. (2009). The Person: An Introduction to the Science of Personality Psychology (5th edition). New York: Wiley. McCrae, R. R., & Costa, P. T. (1991). Adding liebe und arbeit: the full five-factor model and well being. Personality and Social Psychology Bulletin, 17, 227–232. McCrae, R.R. & Costa, P.T. (2003). Personality in adulthood: A five-factor theory perspective (2nd ed.). New York: Guilford Press. Myers, D.G. & Diener, E. (1995). Who is happy? Psychological Science, 6, 10-19. Steel, P., Schmidt, J. & Shultz, J. (2008). Refining the Relationship Between Personality and Subjective Well-Being. Psychological Bulletin, 134 (1), 138-161. DOI 0.1037/00332909.134.1.138 Watson, D., Clark, L.A. & Tellegen, A. (1988). Development and Validation of Brief Measures of Positive and Negative Affect: The PANAS Scales. Journal of Personality and Social Psychology, 54 (6), 1063-1070. 33.
(35) Watson, D. (2002). Positive Affectivity. The Disposition to Experience Pleasurable Emotional States. In C.R. Snyder & S.J. Lopez (Eds.), Handbook of Positive Psychology (pp. 106-119). New York: Oxford University Press. Westerhof, G.J. & Bohlmeijer, E.T. (2010). Psychologie van de levenskunst. Amsterdam: Boom. World Health Organization (2005). Promoting mental health: Concepts, emerging evidence, practice. Genève: WHO.. 34.
(36)
Figure

+4

Related documents
The proposed indexing that uses Generalized Hash Tree (GHT) expedites projection and selection operations on encrypted medical XML records stored in WORM storage.. We implemented
There are infinitely many principles of justice (conclusion). 24 “These, Socrates, said Parmenides, are a few, and only a few of the difficulties in which we are involved if
19% serve a county. Fourteen per cent of the centers provide service for adjoining states in addition to the states in which they are located; usually these adjoining states have
Хат уу буудай нъ ТгШсит ёигит зүйлд хамаарагддаг нэг настай ихэечлэн зусах хэлбэртэй үет ургамал бөгөөд уураг ихтэй, шилэрхэг үртэй, натур жин их байдгаараа
To study the relationship between nitric oxide and sperm capacitation in vitro , and to provide a theoretical basis for the use of NO-related preparations in improving sperm
In conclusion, this study showed that in a patient group with mainly moderate and severe COPD experience a loss of peripheral muscle strength and endurance, exercise capacity
It was decided that with the presence of such significant red flag signs that she should undergo advanced imaging, in this case an MRI, that revealed an underlying malignancy, which
A perceived way out of the administrative challenge was to transform university knowledge production in order to create jobs, ensure equitable income distribution, improve
