MASTER THESIS
THE USER EFFECTS OF
USING TEXTUAL CUES TO
INCREASE IMAGE VIEWING
ATTENTION
D.S. Kornalijnslijper
FACULTY ELECTRICAL ENGINEERING, MATHEMATICS AND COMPUTER SCIENCE
HUMAN MEDIA INTERACTION
EXAMINATION COMMITTEE
Writing this thesis has been a personal achievement. It has been quite an intense and interesting experience, which would not have been possible without the support and advice of several important people who contributed to the completion of this thesis.
The help, advice and knowledge of my supervisor, Dr. Mariet Theune, was the corner stone of my progress. I thank her for sharing her ideas, correcting me on my mistakes and for her great patience during this project. Special thanks to the members of the committee, Betsy van Dijk and Joyce Karreman, for providing their input, advice on statistics and help around the Faculty of Behavioural Sciences. Special thanks to Rose for her sublime correction of my English.
I thank my girlfriend Adriana Stan for giving me support, advice, for reading the work, and above all, for giving me the motivation to see this project through and finish the thesis.
Abstract i
Acknowledgement iii
Contents vi
List of Figures viii
List of Tables ix
1 Introduction 1
1.1 Textual Cues and Multimedia Presentation Systems . . . 1
1.2 Learning from words and illustrations . . . 2
1.3 Benefits of Cues on cognitive processes . . . 3
1.4 Mapping concepts and structures . . . 4
1.5 Related cue research . . . 6
1.6 Objective and Research questions. . . 8
1.7 Thesis outline . . . 8
2 Recall performance experiment 9 2.1 Method . . . 11
2.1.1 Participants . . . 11
2.1.2 Materials . . . 11
2.1.3 Pre-experiment trials. . . 15
2.1.4 Equipment . . . 15
2.1.5 Procedure . . . 15
2.1.6 Post-test questions . . . 16
2.1.7 Statistical tests . . . 17
2.2 Processing of the data . . . 18
2.2.1 Reported level of English . . . 21
2.3 Results. . . 22
2.3.1 Participants . . . 22
2.3.2 Influence of Cues . . . 23
2.3.3 Influence of Gender . . . 24
2.3.4 Influence of English Level . . . 25
2.3.5 Influence of Mother Tongue . . . 26
2.3.6 Relation between Mother Tongue and reported English Level . . . 27
2.3.7 Influence of Reading and Answering time . . . 27
2.3.8 Post-test results . . . 29
2.4.1 Reasons for no found effects of cues . . . 36
2.4.2 Influence of reported English level and mother tongue . . . 38
3 Reading observation experiment 41 3.1 Method . . . 42
3.1.1 Participants . . . 42
3.1.2 Materials . . . 42
3.1.3 Equipment . . . 42
3.1.4 Procedure . . . 42
3.2 Processing of the data . . . 43
3.2.1 Precision . . . 43
3.2.2 Discarded data . . . 43
3.2.3 Counting attention switches . . . 43
3.3 Results. . . 46
3.3.1 Participants . . . 46
3.3.2 Attention switching to the illustration . . . 46
3.4 Discussion . . . 49
4 Conclusion and Recommendations 51 Bibliography 55 Appendix A Materials 57 A.1 Text and image sources . . . 57
A.2 Presentations . . . 58
A.3 Presentation questions . . . 84
1.1 The example of a chair. . . 2
1.2 The influenza virus . . . 5
2.1 The beer brewing process . . . 10
2.2 The Tuareg and the Tuareg conflicts . . . 14
3.1 Example of gaze point shifting . . . 44
3.2 Switching from text to illustration . . . 45
3.3 Partial scan path showing participant 1 (no cues) reading the Tuareg presentation . . . 47
3.4 Partial scan path showing participant 2 (simple cues) ignoring a cue in the Tuareg presentation . 48 3.5 Partial scan path showing participant 3 (simple cues) following a cue in the Tuareg presentation 48 3.6 Partial scan path showing participant 4 (explicit cues) ignoring a cue in the Tuareg presentation 48 3.7 Partial scan path showing participant 5 (explicit cues) following a cue in the Tuareg presentation 49 A.1 The structure and development of hurricanes (example presentation) - Presentation without cues 59 A.2 1: The Tuareg and the Tuareg conflicts - Presentation without cues. . . 60
A.3 2: The Tuareg and the Tuareg conflicts - text with cues . . . 61
A.4 2: African migration routes to western Europe - Presentation without cues . . . 62
A.5 2: African migration routes to western Europe - text with cues . . . 63
A.6 3: The mid-ocean ridge system - Presentation without cues . . . 64
A.7 3: The mid-ocean ridge system - text with cues . . . 65
A.8 4: Replication of the influenza virus - Presentation without cues . . . 66
A.9 4: Replication of the influenza virus - text with cues . . . 67
A.10 5: The various beef cuts from a cow - Presentation without cues . . . 68
A.11 5: The various beef cuts from a cow - text with cues . . . 69
A.12 6: The rock cycle - Presentation without cues . . . 70
A.13 6: The rock cycle - text with cues. . . 71
A.14 7: Oceanic depths and divisions - Presentation without cues . . . 72
A.15 7: Oceanic depths and divisions - text with cues . . . 73
A.16 8: The thermohaline circulation - Presentation without cues . . . 74
A.17 8: The thermohaline circulation - text with cues . . . 75
A.18 9: The beer brewing process - Presentation without cues . . . 76
A.19 9: The beer brewing process - text with cues . . . 77
A.20 10: The malaria parasite and its replication - Presentation without cues . . . 78
A.21 10: The malaria parasite and its replication - text with cues . . . 79
A.22 11: An anatomy of the Sun - Presentation without cues . . . 80
A.23 11: An anatomy of the Sun - text with cues . . . 81
A.24 12: The working of the fluorescence microscope - Presentation without cues . . . 82
2.1 Minimum reading time per condition . . . 19
2.2 Total discarded data sets . . . 21
2.3 Correct answers per condition and reported level of English . . . 22
2.4 Correct answers per condition . . . 23
2.5 Correct answers per gender . . . 24
2.6 Correct answers per condition and reported level of English combined . . . 25
2.7 Correct answers per mother tongue . . . 26
2.8 Mother tongue versus reported English level . . . 27
2.9 Reading time . . . 28
2.10 Answering time . . . 28
2.11 Frequency of presentation difficulty per condition . . . 29
2.12 Correct answers per condition and presentation difficulty. . . 30
2.13 Language difficulty per condition . . . 30
2.14 Correct answers per condition and language difficulty. . . 31
2.15 Ease of questions per condition . . . 32
2.16 Correct answers per condition and rating for the ease of questions . . . 32
2.17 Rating of the level of English per condition . . . 33
2.18 Correct answers per condition and English level rating . . . 34
2.19 Inclination to give up per condition. . . 35
2.20 Correct answers per inclination to give up . . . 35
3.1 Participants overview. . . 46
3.2 Attention switches to illustration and the number of correct answers per participant . . . 47
B.1 Gender per condition . . . 87
B.2 Age per condition. . . 87
B.3 Language per condition . . . 87
Introduction
Cues are a common and broadly used method of guiding readers’ attention. Cues are found in books, papers, magazines, internet web pages and interactive study software. They are used in multiple representations of content such as written- or spoken text, illustrations and animations. Cues, also called signalling devices, aid the reader in selecting, organising and integrating the displayed information (Mautone & Mayer,2001; Mayer,
2005a; Koning de, Tabbers, Rikers, & Paas,2009). They come in various shapes and forms: written or spoken in words, sounds, arrows, connecting lines, colouring, flashing, boldfacing, underlining, italics, headings or outlines. Each cue type has its own way of standing out from the rest of the material, capturing the attention and then redirecting the reader to other content. In the redirected content the reader is either offered extra information or shown a different representation which further elaborates on the topic.
1.1
Textual Cues and Multimedia Presentation Systems
In this thesis I will discuss the effects of textual cues written in words. They are a common type of cue which are often found in illustrated text. Specifically, I will look at textual cues which are integrated in a short body of text and which refer and draw attention to illustrations. Text is quite flexible and different variations of the cues could be made as suggested by Peeck (1993). Cues could be simple e.g. “See the image” or explicit like written in the text of figure 1.2: “See (step 3-5) in the image how proteins are synthesized and move back in the nucleus or to the Gogli apparatus.”. Seufert and Brunken (2004) categorise the simple cues as less-directive and explicit cues as directive. Less-directive cues let readers identify the essential information by themselves. E.g. a simple cue directs the reader only to the illustration without going into further details on the contents inside the illustration. Directive cues are explicit and direct the reader to the essential concept that needs to be studied. E.g. an explicit cue can elaborate on the textual content by directly referring to the illustrated content. In this study I will compare both simple and explicit cues and use them in illustrated-text presentations such as the example shown in figure 1.2.
(Androutsopoulos, Oberlander, & Karkaletsis,2007) could suggest to authors what to integrate as cues while they are creating a document or presentation. The automatic generation of a simple cue will be less complicated than generating an explicit cue.
Before I continue to discuss the use of textual cues I will first give a brief introduction on the processes that underlie the learning from words and illustrations.
1.2
Learning from words and illustrations
[image:14.595.398.474.415.551.2]What words cannot describe is sometimes better shown with an illustration. Each representation has its own qualities for communicating information. Words are abstract and generic and images are concrete and specific (Fletcher & Tobias,2005; Schnotz,2005). Words can describe the dimensions of an object, its use and construction in general terms, but they cannot show the actual object. E.g. using the generic term chair informs the reader that this is an object that functions as a seat, but the reader would have no idea what the chair in question looks like. Using words to describe the chair’s dimensions, construction and design and purpose could be a lengthy process and the reader would still use their own references and expectations to construct a mental picture of the item. This visualisation, however detailed the text, would still be an approximation of the chair itself. Adding a picture would help the reader see what the chair looks like. However, the illustration is specific and shows only one or a few examples. See for example the description of a chair in figure 1.1. Presenting both the text and the illustration helps the reader to gain a better and integrated understanding (Fletcher & Tobias,2005).
Figure 1.1: The example of a chair. Source: Wikipedia
A chair is a raised surface used to sit on, commonly for use by one person. Chairs are most often supported by four legs and have a back; however, a chair can have three legs or could have a different shape. The design may be made of porous materials, or be drilled with holes for decoration; a low back or gaps can provide ventilation. The back may extend above the height of the occupant’s head, which can optionally contain a headrest. Chairs can also be made from more creative materials, such as recycled materials like cutlery and wooden play bricks, pencils, plumbing tubes, rope and PVC pipe.
an integrated mental representation.
These processes require conscious control and cost resources in the limited working memory. The demand placed on working memory capacity and processing is called cognitive load (Schnotz & K¨urschner, 2007). Schnotz and K¨urschner explain the working of three types of cognitive load: intrinsic, extraneous and germane load. Intrinsic load is caused by the processing of essential material and relations necessary to achieve a learning objective such as understanding how a system works. Extraneous load is caused by processing of non-essential or extraneous material that is not relevant to the learning objective and is an unnecessary load due to bad design and organisation of the material. Extraneous load interferes with learning because it places load on the limited cognitive capacity and should be reduced as much as possible. Germane load is caused by an intensive learning effort that involves deeper processing to create a coherent mental organization of the material (Mayer, Hegarty, Mayer, & Campbell,2005; Schnotz & K¨urschner,2007). The total cognitive load is the sum of these 3 types of load. When the intrinsic load is high and there is a lot of extraneous material then working memory capacity may be overloaded. Learning might then suffer because there is no capacity left for germane load.
When the text and illustration describe a complicated topic or describe various detailed aspects then selecting and organizing the material becomes more demanding. Seufert and Brunken (2004) note that readers with insufficient prior knowledge are often unable to handle the task. They will study the representation that is the most familiar to them and will only switch if they have problems understanding. Seufert and Brunken (2004) further note that prior knowledge helps us make sense of the presented material; it helps us in selecting essential material and offers structure to organize before integration in long term memory. Without this aid the number of elements in the material that require processing can overload the working memory. In contrast, readers with high prior knowledge need less mental effort and so have a lower cognitive load.
1.3
Benefits of Cues on cognitive processes
According to theories CTML and ITPC, textual and illustrative content can only contribute to a coherent mental model if both are simultaneously in working memory and before the information decays. Therefore, it is best to study related content from both representations in quick succession. Cues can aid bringing related content simultaneously in working memory by referencing and thus, ‘connecting’ related content spread in different representations. Cues could increase the chance that readers select related and essential content mixed in between other content. Hence, cues could reduce the cognitive load placed by selection and could help to mentally organize the material. This is similar to the effect of the contiguity principle (Mayer & Ross,2002; Mayer,2005b). The contiguity principle states that text and illustration should be presented together in space and time rather than after each other. The spatial contiguity principle says that text and illustration should be presented spatially close together rather than far apart. The temporal contiguity principle says that text and illustration should be presented with the least possible time between them and preferably simultaneously. In addition, switching between the two representations without guidance requires visual searching which increases chances of readers viewing extraneous material (Koning de et al.,2009) and will cost extra time, all the while information decays from working memory. This is similar to what the spatial contiguity principle describes. When both representations are far apart then readers need to use cognitive resources for visual searching. Thus, the materials are less likely to appear in working memory at the same time (Mayer & Ross,2002). Cues could reduce visual searching because they link the essential content.
the extraneous load. Cues do not prevent the reading of extraneous material, however, by placing the essential material in quick succession in working memory they can lower the interference from extraneous load. Mayer (2005b) calls this the signalling principle.
1.4
Mapping concepts and structures
In order to acquire knowledge from both text and illustration, the reader must create referential connections between the representations and must relate the build structure with the presented topic (Seufert & Brunken,
2004). They call this coherence formation and they distinguish between two types of strategies for mapping the contents in the text and illustration. The first strategy is to rely on surface features of the representation that indicate correspondence, e.g. the use of emphasis with boldfacing, italics or colouring. These features can serve as signals for mapping and may lead the reader to process the cued elements and structures more deeply. However, Seufert and Brunken note the possibility that these surface features are only superficially observed. The guidance of attention can lead to a narrow focus on the surface features. Readers may not actively think and therefore fail to engage deeper into the subject. The second strategy employs a deeper analysis of the elements in both representations by matching and mapping their relations through analysis, e.g. by understanding how a process or a system, described in a text and shown by an image, operates and how individual elements interact. According to Seufert and Brunken, this help is mostly given verbally, e.g. as instructions. Peeck (1993) discusses this type of verbal aid in light of increasing students’ attention to illustrations. For example, a teacher could instruct the students to not forget to look at the pictures. However, Peeck explains that simply telling a student to study will not likely lead to deeper learning. His suggestion is to use more specific instructions to increase the effects on learning from illustrations. Instructions could also be elaborated by telling a student what to observe in general or what to observe in particular. Assignments, such as telling a student to do something with the illustration (comparing, tracing, labelling), are even more effective, according to Peeck.
1.5
Related cue research
A large body of research has been done on textual cues within text, called signal devices. However, these signals refer to elements within one representation and not to others, such as illustrations. Examples of text signalling devices that guide attention are: titles and headings, which label dominant themes, and boldfacing, italics, and colouring that draw attention on words. Other text signals provide organisation, such as: headings, enumeration, overviews and previews, pointer phrases and logical connection phrases. These signals have been reported to improve recall of relevant information and improve transfer for problem solving tests (Mautone & Mayer,2001). However, these findings are not directly applicable to relational cues between representations. Switching within text can require a jump in concept; however, the information is still shown in the same abstract format and with similar wording. On the other hand, the switch from textual information to pictorial information requires integrating abstract knowledge with concrete knowledge and is not processed the same way in working memory (Mayer & Ross,2002; Mayer,2005b). Furthermore, I assume text signalling devices are forming a unity with the text whereas textual cues that refer to illustrations interrupt the reader and draw attention to a different representation.
Surprisingly, research on textual cues between multiple representations has been limited. Reinking, Hayes, and McEneaney (1988) reported at the time of writing that “the effects of cueing attention to graphic aids (illustrations) by including written cues embedded in text is yet unknown”. Reinking et al. started an experiment to see if cues were of benefit for poor readers that might not know when to switch to illustrations. They researched: 1. the effect of text with pictures preceded by a general instruction, 2. text with pictures with explicit cues embedded and 3. the combination of a general instruction and embedded explicit cues. The general instruction stood above the main body of text and told readers to “Look at the picture to help yourself better understand and remember the information in this passage”. The explicit cues were placed at the end of a paragraph and were similar to the explicit cues mentioned above: “Note in Figure 1A the layers of cinders, ash, and lava that make up this volcano.” In addition, the explicit cues were set in bold and boxed with a black border whereas, the general instructions were not. Participants were 7th and 8th grade students at high school and divided in two groups: poor and good readers. Text comprehension was measured immediately after reading a topic, by means of multiple choice questions of which half could be explicitly found in the text and half implicitly. Furthermore, recall of the information presented in the graphics was tested in a post test exercise. Results from the text comprehension test indicated that in general cues and instructions improved comprehension significantly for poor readers, but not for good readers. However, explicit cues were more effective than the general instruction. Explicit cues improved graphic recall for both good and poor readers but benefited poor readers more. The comprehension gap between poor and good readers was bigger in the no cues condition. Given the increase of comprehension, Reinking et al. concluded that explicit cues increase attention to illustrations. However, it is not clear from this experiment whether the increased attention would have been the same if the explicit cues had not been bold faced and boxed. Boldfacing and boxing are both visually acute methods of drawing attention similar to colouring and flashing. Thus, it is not clear if the cues would have been as effective without the visually enhancing features.
illustrations serve as structural summarisers and organise the material, and they function as elaborative cues that help readers to connect elements from the two representations. The annotations are relevant to textual cue research but are different from the textual cues used in my experiment; the annotation are not embedded in the main text body and do not reference the illustrations.
McTigue (2009) conducted an experiment to assess the combined use of textual cues embedded in text and of labels in illustrations. Labels were placed in a white box which made them stand out from the illustration. The textual cues were explicit in their instruction and directed the reader to look at the illustration: “Look again at the diagram, at number 6, to see where steam is turned to water”. The number used in the cue text corresponded with a numbered location in the illustration. The participants were 6th grade students with an average age of 12 years. Text comprehension was tested with two types of questions: fact recall questions and inferential questions which required application beyond the text. Results showed that cues did not provide substantial benefits to students and showed only minor results. McTigue (2009) discusses a number of possible causes for the results: i) The 6th grade students might have lacked the skills to comprehend the information in the text and illustration, skills such as those needed to interpret abstract concepts and interpret diagrams. ii) Results might have been limited by the type of questions asked in the comprehension test and the participants’ motivation. Another possibility, not mentioned in this paper, is that offering both labels and cues at the same time might have been more aid than necessary, because the visual properties of the labels might have drawn enough attention and made additional cueing from the text redundant.
The goal is to research the effects of referencing through words without the use of visually prominent features. I will assess two types of textual cues: simple and explicit cues. As discussed above, the simple cues reference the illustration as a whole and do not reference specific concepts. The explicit cues reference concepts and items found in the illustration, which are relevant to the read text.
1.6
Objective and Research questions
In this study I will assess the effect of textual cues which are embedded in a main text body, on the recall and subjective experience of presented information. In addition, I will record the eye movement of a small number of participants to assess if participants follow the directions of the cues. The presented information consists of brief illustrated-text presentations and is presented on an internet website. The cues will come in two variations; simple and explicit. Simple cues will only refer to the illustration as a whole without mentioning specific concepts or items. The reader must then search for the essential material within the illustration. Explicit cues will guide the reader by referring to essential concepts or items in the illustration. See section 1.1 for examples. The questions I seek to answer are:
• Do simple textual cues to illustrations improve the recall of the information presented in illustrated text presentations?
• Do simple textual cues affect the subjective perception of the presentation difficulty, language difficulty, question difficulty and the participants’ level of English?
• Do explicit textual cues to illustrations improve the recall of the information presented in illustrated text presentations?
• Do explicit textual cues affect the subjective perception of the presentation difficulty, language difficulty, question difficulty and the participants’ level of English?
• Is there a noticeable difference in the recall of information between simple and explicit cues?
• Do simple textual cues cause participants to study a picture in illustrated text presentations?
• Do explicit textual cues cause participants to study a picture in illustrated text presentations?
1.7
Thesis outline
Recall performance experiment
2.1
Method
2.1.1
Participants
Participants were gathered from a pool of students from the faculty of behavioural sciences at the University of Twente. Because the presentations described complex information and were written in English, participants were requested to join only if they had a good level of English, one that could be expected from university students. In addition, participants should not be colour blind to avoid complications while viewing the illustrations.
2.1.2
Materials
The experiment consisted of 12 illustrated-text presentations and 1 example that was shown. All materials can be found in appendixA.
Layout
To minimize the number of variables I kept the layout simple and the same for all presentations. Each presentation contained of a single illustration and a piece of text written in English language. The text body was placed on the left half of the presentation and the image on the right. The text was aligned justified, thus flushed to its left and right border. The text needed to fit on a computer screen without scrolling to avoid unnecessary distractions while reading. The limiting factors were the vertical resolution of the used computer screen and the used font size. I chose a vertical size based on my personal experience with students’ laptop screen sizes. Modern laptops are common among students and most have at least a vertical resolution of 800 pixels. On average, the text was 350 words long.
Type of illustrations
The chosen illustrations clarified or added information to the written text and were not merely decorational. Prior research has shown that informative and constructive illustrations that add useful information or help to clarify concepts are more effective for learning purposes (Mayer, Steinhoff, et al.,1995; Carney & Levin,2002; Hooijdonk, Vos, et al.,2007). If the illustration has no added value other than being decorational, then a cue would only distract the reader from reading essential content.
Modifications
To avoid confusion while reading, I checked the illustrations for objects or labels which were not described in the text. The participants should not be left to wonder about unexplained contents. When an illustration contained unexplained contents then either the text or the illustration was altered to create one integrated presentation. Furthermore, I made certain that the text and illustrations would support the placement of at least three textual cues to reference the illustration from the text. The reason for this choice is explained in paragraph2.1.2.
Topics
‘Oceanic depths and divisions’, ‘The thermohaline circulation’, and ‘The mid-ocean ridge system’ all describe something which happens in the oceans. However, the topics are all diverse and do not overlap. The selected topics always describe a process, a situation, or the organization of a network or an object. This allows for the text and illustration to have enough complexity to add relevant content to the presentation, which cannot be captured at a single glance.
Origin of the materials
All presentations were assembled from various internet resources which are referenced in Appendix section A.1. Not all sources supplied both a text and an illustration which met the requirements described above. Texts and illustrations sometimes originated from different sources and were altered to match each other.
The selected topics were the following:
1. The structure and development of hurricanes (example presentation), 2. The Tuareg and Tuareg conflicts,
3. African migration routes to western Europe, 4. The mid-ocean ridge system,
5. Replication of the influenza virus, 6. The various beef cuts from a cow, 7. The rock cycle,
8. Oceanic depths and divisions, 9. The thermohaline circulation, 10. The beer brewing process,
11. The malaria parasite and its replication, 12. An anatomy of the Sun,
13. The working of the fluorescence microscope.
Adding cues
Three textual cues were added to the main text body of each presentation in the simple and explicit cues conditions. With only one cue per presentation, participants might have recognized a relation between the cue and the queried content in the question. To avoid that participants would focus on the cues to answer the questions 3 cues were added and for consistency this was done for every presentation. The simple textual cues were phrases like: ”See the picture”, ”See the image” or ”See the map”. The explicit textual cues were designed to relate essential content in the text and illustration. They described more details than the simple cues: e.g.,
”Notice in the middle right of the image the merozoites moving from the exo-erythrocytic phase to the red blood cells in the erythrocyte phase.”The cues should not break the flow of text. Their location in the text must guide the attention of the reader to the illustration at the right moment. This was immediately after a piece of text that described a part of the topic that was also depicted in the illustration.
2.1.3
Pre-experiment trials
An earlier version of the materials proved to be too easy for the participants. During a pre-experiment trial two male students completed the test and answered all questions correctly regardless of the use of cues. The ceiling effect was probably caused by a number of problems:
1. All the presentations covered similar topics from the medical domain, 2. The students said to have some prior knowledge of the medical domain,
3. The text length was about 140 words and thus, there was little information to memorize.
To correct for the ceiling effect, I redesigned the materials as described above in section 2.1.2. Diverse knowledge domains were used to minimize the effects of prior knowledge. The texts were made longer, and more difficult, topics were selected to increase the amount and complexity of the memorized information. In a second pre-experiment trial with renewed materials four participants (2 male and 2 female) were included. Two participants complained about the length of the experiment (The average time spent was about 1 hour.). The results were mixed; with some participants scoring very well while others scored badly.
2.1.4
Equipment
Participant pool system
The participants signed up for the experiment via the ‘proefpersonenpool’ (participants pool) website of the faculty for behaviour sciences at the University of Twente. The participants received 1 university credit after completion. Failure to attend the experiment without prior explanation was punished with a reduction of 5 university credits.
Web-based experiment system
The experiment website used a system for presenting web-based questionnaires and experiments called WWStim (Veenker,2003). The system does have its limitations. The standard set-up does not allow the experimenter to first show the stimuli and then the question. An alternative implementation from standard use made this possible. However, this disabled the option to randomize the presentations. I further adapted the implementation with a time registration system which recorded the time of opening and closing of a web page. With the time stamp information I got an indication of the reading time per presentation and answering time per question.
2.1.5
Procedure
A link leading from the participant pool system guided the participants to the experiment website. A welcome page instructed participants that they would need to study 12 illustrated text presentations. Furthermore, it explained all the steps necessary to complete the experiment and informed the participants that the experiment would last about one hour. There was no time constraint set on the experiment. No details were given on the purpose of the experiment to avoid guessing on the experiment variables. A focus on the experiment variables might have influenced the participants to look for cues and could have caused a different reading behaviour. After the introduction page followed a personal details form. Participants were asked to give their:
• age
• mother tongue (Arabic, Chinese, Dutch, English, French, German, Italian, Japanese, Spanish or Other)
• reading level of English (mother tongue, proficient/excellent, advanced, intermediate, elementary or beginner)
• email address (optional)
Filling in the email address was optional and was only intended for students that wished to receive more information on the experiment.
Next an instruction page followed. Participants were instructed to read and study an example presentation and then 12 experiment presentations. In addition, they were informed that each presentation would be followed by a question on the content of the presentation.
The example presentation contained no cues regardless of the experiment condition. Each presentation page requested participants to study the presentation and to click on continue when they would be ready. Each presentation page was followed by a question page with 1 question and 4 multiple choice answers. It was not possible to view the presentation or to return to the presentation page while answering a question. Participants could continue to the next presentation by pressing the next button. However, they could only continue after choosing an answer. After the example, an intermediate instruction page was shown that informed the participants that the example was finished and that 12 presentation were to follow. In addition, the page instructed participants to read and study at their own pace.
After reading all presentations and answering all questions, participants were asked to answer the post-test questions. The participants were shown an instruction page that informed them that all presentations had been shown and that next five evaluation questions would follow. In addition, the page informed them that these were the last questions of the experiment. Participants had to answer a question before being allowed to continue to the next. After answering all questions, the participants were thanked for their participation. It was possible to leave a comment or ask questions via a comments box.
2.1.6
Post-test questions
The post-test questions were designed to measure how participants subjectively experienced the difficulty of the presentations, the difficulty of the language used in the presentations and the easiness of the presentation questions. Furthermore, the participants were asked again to assess their level of English which might have changed after reading the presentations. Lastly, to measure discomfort participants were asked to indicate how often they considered stopping the experiment before reaching the end of it.
These are the post-test questions:
1. Considering the presentations that you have read, how many presentations did you consider difficult to study?
(a) none,
(b) 1 to 3,
(c) 4 to 6,
(d) 7 to 9,
2. Considering the presentations that you have read, how difficult did you find the language used in the presentations?
Not difficult 2 2 2 2 2 2 2 Very difficult
3. Considering the questions following each presentation, how many questions do you think were easy to answer?
(a) none,
(b) 1 to 3,
(c) 4 to 6,
(d) 7 to 9,
(e) 10 to 12.
4. Considering the presentations that you have read, how do you assess your level of English? Excellent 2 2 2 2 2 2 2Basic
5. Considering the experiment as a whole, how many times did you consider stopping before reaching the end of the experiment?
(a) never considered,
(b) 1 time,
(c) 2 to 5 times,
(d) more than 5 times.
2.1.7
Statistical tests
The results from the experiment were tested using generally accepted and used statistical tests. Choosing the right test depends on the type of tested data (interval, categorical or ordinal data), the number of tested groups, and results from pre-tests, such as Levene’s test of Homogeneity of Variance and the Shapiro-Wilk test. Levene’s test of Homogeneity of Variance is intended to test for statically significant differences of variance. The Shapiro-Wilk test is intended to test the distribution of data. A statically significant result from the Shapiro-Wilk test means data is not normally distributed.
When testing the difference between two independent groups on an interval or ratio scale, I used the independent two-sample Student’s t-test. When testing between more than two independent groups, I used the one-way ANOVA test. To reliably perform the ANOVA test, a number of assumptions have to be satisfied:
• The groups are independent and random,
• The data should be normally distributed,
• The groups have the same variances.
assumption, I tested for equality of variance with Levene’s test of Homogeneity of Variance. If either test was significant, then I used a non-parametric test.
Tests between two groups on an ordinal scale were done using a non-parametric test. When testing between two groups, I used the Mann-Whitney U test. When there were more than two groups, I used the Kruskal-Wallis test. To test the difference in ranges (the minimum and maximum values) between groups, I used Levene’s test of Homogeneity of Variance.
Tests between groups on a nominal scale were done using the Pearson’s Chi-Squared test. If any of the observed counts were smaller than 10 or if the expected count was less than 5, then I used Fisher’s Exact test. The Fisher’s Exact test I will abbreviate from here on as FET.
To test the correlation between variables, I used Pearson’s r test for normally distributed data and Spearman’s rho test for not normally distributed data.
All tests were conducted using a two-sided alpha level of 0.05.
2.2
Processing of the data
The gathered data needed to be processed prior to analysing the results. The experiment set-up allowed participants to participate via the Internet and in any location of their liking. This limited the barrier for participation and made it easier to gather participants. However, the situation in which the participants studied the presentations was not under control and this influenced the experiment. Incomplete data sets and unforeseen behaviour were excluded from the results. In this chapter, I will discuss in which cases these data sets were excluded from the results.
The experiment set-up did not restrict the number of times a participant could start the experiment. Thus, for each participation a new dataset was recorded. Recording started when the personal data was entered and continued up to the last post-test question. If a participant broke off the experiment mid-way then the data set was registered as incomplete. The personal data, the experiment data, and the post-test data was registered within each dataset. The experiment data consisted of 12 answers given on the presentation questions and a time stamp taken at the transition to the next page in the experiment. The timestamps show approximately how long each page was open. This gives an indication of how much time the participants spent reading a presentation or how long a question was pondered upon. The view time of a page was calculated by subtracting the ending time stamp of the previous page from the ending time stamp of the current page. The recorded time is distorted by the web page load time and can be distorted by plausible distractions during the experiment, e.g. for making a cup of tea or answering a phone call. Since the experiment was not held in a laboratory under controlled conditions, distractions cannot be ruled out. Finally, a data set contains the post-test data which consists of 5 answers to the post-test questions.
Below I specify a number of requirements on each data set. When a data set did not fall within the requirements, it was discarded from the analysis.
1. Incomplete data
A participation was required to have a complete data set with all experiment data. Those that did not, I considered to be incomplete and were discarded from the analysis.
2. Minimum total reading time
113 participants between the age of 30 and 45 years reported to spend more time on browsing, scanning, keyword spotting, one-time reading and non-linear reading than 10 years prior to the experiment. They read more selectively and did less in-depth reading. Morkes and Nielsen (1997) showed similar findings. In 3 experiments they tested different reading techniques for the web. They conclude web readers scan, search for keywords and like concise pages. Web readers like to get quickly to the point. Similar reading techniques are skimming and scanning. Skimmers ’scan’ for relevant information and skip irrelevant parts with the aim to absorb information faster than while reading at normal speed. Reported normal speeds vary between 199 to 250 words per minute (wpm) (Masson,1982; Muter & Maurutto,1991; Dyson & Haselgrove,2000; Hewitt, Brett, & Peters, 2007; Duggan & Payne, 2009). Experiments on skimming while reading from a computer screen (Muter & Maurutto,1991; Dyson & Haselgrove,2000; Duggan & Payne,2009,2011) observe various speeds ranging from 460 to 600 wpm. Based on results from Muter and Maurutto (1991) and a pilot study of 22 students, Hewitt et al. (2007) concluded that comprehension suffers at reading speeds above 8 words per second (480 wpm). They note this to be a conservative boundary and that the speed and comprehension may vary per student. In their experiment they measured the reading speed of students per note size. The notes varied from 0 - 24 to 600 - 624 words with incremental steps of 25 words. They found that when the text got longer more students read faster. When reading the shortest notes 0.2% of the student read faster than 8 wps and 51.9% for the longest notes. Not only document length but also the amount of characters per text line influences the reading speed (Dyson & Haselgrove,2001). It is probable that skimming and scanning were used by participants in this experiment which was held on the web and read from a computer screen. One could argue that readers participating in a web experiment will behave differently when they read regular web content. However, the computer screen remains of influence as concluded by Liu (2005). Skimming and scanning participants should not be excluded from this experiment. However, as suggested by Hewitt et al. (2007), participants reading too fast might have missed essential information. Some speedy participants might not have read at all. Including those results might undesirably skew the results.
[image:31.595.206.389.576.632.2]Considering the various reported speeds in prior research, I set the maximum reading speed at 600 wpm. By counting the total word length of all 12 presentations and based on this maximum reading speed, a minimum total reading time was calculated for each experiment condition. See table 2.1for the minimum reading times per condition. Those participants that read faster than the minimum reading speed might have skipped over cues and did not engage in meaningful learning. Thus, the data sets of those participations were discarded from the analysis. Note that the participant was not necessarily excluded. See the next requirement for more information on participants with multiple participations.
Table 2.1: The word length and minimum reading time per condition.
Word count Min. reading time
No cues 3962 6 min. 36 sec.
Simple cues 4070 6 min. 47 sec.
Explicit cues 4494 7 min. 29 sec.
3. Excessive reading or answering time
contained times that exceed excessively as described above. 4. Multiple participations
For various reasons a participant might have participated in the experiment multiple times. For example, a participants’ Internet connection might have disconnected or the experimenter requested a new attempt. Preferably, the first participation was used for the analyses because, during later attempts, the participant might have remembered information from the earlier attempts. Also, the participant might have changed reading style, for example by skipping parts that were already understood or memorized. Furthermore, due to the experiment set-up, every participation was assigned sequentially to any of the 3 conditions. Thus, a participant could have participated in multiple conditions. The effects of one condition could then be transferred to another condition. Hence, given these possible unwanted effects, extra requirements are needed to decide which participation to include in the analysis.
(a) Only one data set per participant is included in the analysis and all others are discarded,
(b) The data set of the first participation is used in analyses if it meets the requirements mentioned above in points 1, 2 and 3,
(c) If the first participation was discarded then the next participation is considered until a data set is found which meets the requirements,
(d) In addition, to minimize the effects due to the transfer of knowledge between participations, discarded prior participations must satisfy one of the following conditions:
i. In earlier participations the participant did not actually start the experiment and had not studied any of the presentations or,
ii. The participant read faster than the total minimum reading time or, iii. About two weeks had passed since the last discarded participation.
Summary
Following the above requirements only one data set per participant was included in the analysis.
• Each data set was complete,
• The total reading time was longer or equal to the minimum total reading time,
• Each data set did not have excessive reading or answering times,
• In case of multiple participations, the effects due to the transfer of knowledge between participations was minimized.
Included data sets.
A total of 60 data sets were included in the analysis.
Discarded data sets.
In total 56 data sets have been discarded. See table 2.2for a complete overview per requirement.
to sequential condition assignment their new attempt took place in a different condition than their failed attempt. As a result, the two partial data sets are from two different conditions. Therefore, the two data sets cannot be combined and both attempts were discarded. Participants in 17 participations read the presentations faster than the minimum reading time. 3 participations were discarded because reading or answering time deviated above 2.5x standard deviation from the mean. 1 participation was redundant because the same participant had already participated successfully. 1 participation was discarded because an earlier attempt was held less than two weeks earlier.
Table 2.2: The number of discarded data sets per type of requirement. Frequency
(N=56)
Experiment not started 16 (29%)
Incomplete experiment data 18 (32%)
Less than minimal reading time 17 (30%)
Excessive reading or answering score(s) 3 ( 5%)
Redundant valid data set 1 ( 2%)
Time difference between attempts 1 ( 2%)
2.2.1
Reported level of English
Table 2.3: Correct answers per condition and reported level of English
No cues Simple cues Explicit cues Total
(n=19) (n=20) (n=21) (N=60)
Mother tongue (n=0) (n=0) (n=0) (n=0)
Mean - - -
-Standard deviation - - -
-Range - - -
-Proficient/Excellent (n=5) (n=1) (n=1) (n=7)
Mean 8.20 4 6 7.29
Standard deviation 1.30 - - 1.98
Range 7-10 4-4 6-6 4-10
Advanced (n=9 ) (n=12) (n=15) (n=36)
Mean 7.88 7.79 6.88 7.42
Standard deviation 2.98 2.89 3.03 2.73
Range 5-10 3-11 2-12 2-12
Intermediate (n=4) (n=6) (n=5) (n=15)
Mean 5.75 6.67 7.00 6.53
Standard deviation 1.71 1.21 1.23 1.36
Range 4-8 6-8 6-9 4-9
Elementary (n=1) (n=0) (n=0) (n=1)
Mean 8 - - 8
Standard deviation - - -
-Range 8-8 - - 8-8
Beginner (n=0) (n=1) (n=0) (n=1)
Mean - 7 - 7
Standard deviation - - -
-Range - 7-7 - 7-7
2.3
Results
The results that have been gathered are divided in 3 parts: First, I will present the participant data and show the test results for homogeneity of the conditions. Homogeneity of the conditions is favourable to exclude possible unwanted differences in the results due to group differences. Second, I will present the results from the recall test (the number of correct answers on the presentation questions) and present the test results on the influence of the cues. After which, I assessed if differences within the participants influenced the recall results. For example by comparing differences between men and women. Third, I will present the post-test results and test for differences between the conditions. After which I will assess the relation between the post-test results and the recall results. Out of convenience, in the remainder of this document I will abbreviate “the number of correct answers on the presentation questions” as “the number of correct answers”.
2.3.1
Participants
experiment. The tables are presented in the appendix.
• Gender (see table B.1),
• Average age (see table B.2),
• Mother tongue (see table B.3),
• Reported level of English (see table B.4).
No significant differences between the 3 conditions were found in terms of participants gender (2/3 were female and 1/3 male), average age (21 years) and mother tongue (50% Dutch and 50% German). There was no significant difference in the reported level of English between the conditions. In the no cues condition, about 1/4 of the participants reported a Proficient/Excellent level of English, 1/2 reported an Advanced level and 1/4 reported an Intermediate level. In the simple cues condition almost 2/3 reported an Advanced level and almost 1/3 reported an Intermediate level. In the explicit cues condition over 2/3 reported an Advanced level and 1/4 reported an Intermediate level. The remainders were spread over other levels.
These results show that the participant groups had similar properties. This was a desired outcome to avoid possible unwanted differences in the results due to group differences.
2.3.2
Influence of Cues
The first test assesses the difference in the number of correct answers between the experiment conditions. The number of correct answers compared to the no cue condition decreases when simple cues are used and even more with the explicit cues. However, the differences were not statistically significant (F(2,57) = 0.29, p = .75). A second test using Levene’s test for equality of variances, to assesses the difference in the ranges (the minimum and maximum values) between the conditions, showed no statically significant differences (F(2,57) = 1.17, p = .32). See table 2.4. The total average shows that participants had 60%, 7 out of 12, answers correct. Each question had 4 possible answers giving a guessing participant a chance of 1 on 4. Participants might have increased their chances for guessing by excluding unlikely answers based on prior knowledge.
Table 2.4: Correct answers per condition (all data sets)
No cues Simple cues Explicit cues Total
(n=19) (n=20) (n=21) (N=60)
Mean 7.47 7.10 6.90 7.15
Standard deviation 1.71 2.55 2.68 2.34
Range 4-10 3-12 2-12 2-12
Summary
• Gender,
• Mother tongue,
• The reported level of English,
• Reading and answering time,
2.3.3
Influence of Gender
Below I present the results from testing on the influence of gender. In three tests I assess if gender makes a difference in the number of correct answers.
In the first test, I tested the difference in the number of correct answers between men and women in general. Women scored higher than men, see table 2.5. However, the difference is not statistically significant (t(58) = -0.56, p = .58).
In the second test, I tested the difference of the number of correct answers between men and women in each of the 3 conditions. Scores on the number of correct answers in the no cue and simple cue condition were almost the same for women and men, see table 2.5. The difference between men and women, for both conditions, was not significant: no cues (t(17) = -0.24, p = .82) and simple cues (t(18) = -0.13, p = .90). Scores on the number of correct answers in the explicit cue condition were higher for women than for men. However, the difference is not significant (t(4.53) = -0.45, p = .67). Levene’s test indicated unequal variances between men and women in the explicit cue condition (p = .002), so degrees of freedom were adjusted from 19 to 4.53.
In the third test, using the same groups, I assessed for each gender the difference in the number of correct answers between the experiment conditions. Levene’s test indicated unequal variances between the experiment conditions in the group of male participants (p = .002). Thus, the Kruskal-Wallis test was used to assess the male participants. The number of correct answers for both men and women are lower in the cued conditions than in the no cue condition. However, the differences between the conditions for the male participants were not statistically significant (H(2) = 0.56, p = .76). Furthermore, the differences in the female group were not statistically significant (F(2,39) = 0.16, p = .85).
Table 2.5: Correct answers per gender
No cues Simple cues Explicit cues Total
(n=19) (n=20) (n=21) (N=60)
Male (n=6) (n=7) (n=5) (n=18)
Mean 7.33 7.00 6.20 6.89
Standard deviation 1.03 3.16 4.44 2.95
Range 6-9 3-11 2-2 2-11
Female (n=13) (n=13) (n=16) (n=42)
Mean 7.54 7.15 7.13 7.62
Standard deviation 1.98 2.30 2.03 2.06
Range 4-10 3-12 3-12 3-12
Summary
2.3.4
Influence of English Level
The next tests assess whether the participant’s level of English makes a difference in the number of correct answers. Participants were asked before the experiment to specify their level of English. The available answers were; Proficient/Excellent, Advanced, Intermediate, Elementary and Beginner. See table 2.3. These levels were combined to two new levels ‘Higher’ and ‘Lower’ as discussed in section 2.2.1. Table 2.6shows an overview of the mean number of correct answers and standard deviation per combined English level and experiment condition.
In the first test, I assessed the differences between Higher and Lower level in general. The difference between the two levels is not statistically significant (t(54,46) = 1.37, p = .18). Levene’s test showed a statistically significant difference between the variances (p = 0.01). Thus, the degrees of freedom were adjusted to 54,46.
In the second test, I tested the differences in the number of correct answers between the Higher and Lower levels for each experiment condition. Levene’s test showed a statistically significant difference between the variances of the Higher and Lower level in the simple cues condition (p = .02). Thus, the test on the simple cue condition was done using the Kruskal-Wallis test. Participants in the no cues condition of the Higher level group have statistically significant more correct answers than those of the Lower level group (t(17) = 2.12, p = .049). The differences between the Higher and Lower level in the simple cue and explicit cue conditions were not statistically significant: simple cue (t(16.55) = 0.62, p = .54) and explicit cue (t(19) = -0.09, p = .93).
[image:37.595.136.460.488.648.2]In the third test, I tested the differences in the number of correct answers between the experiment conditions for both levels Higher and Lower. See table 2.6. Levene’s test showed a statistically significant difference between the variances in the Higher level (p = .04). Thus, the test on the ‘Higher’ level was done using the Kruskal-Wallis test. Both tests on the Higher and Lower level did not show a statistically significant difference: Higher (H(2) = 1.21, p = .55) and Lower (F(2,14) = 0.44, p = .65).
Table 2.6: Correct answers per condition and reported level of English combined
No cues Simple cues Explicit cues Total
(n=19) (n=20) (n=21) (N=60)
Higher (n=14 (n=13) (n=16) (n=43)
Mean 7.93 7.31 6.88 7.35
Standard deviation 1.49 3.09 3.03 2.63
Range 5-10 3-12 2-12 212
Lower (n=5) (n=7) (n=5) (n=17)
Mean 6.20 6.71 7.00 6.65
Standard deviation 1.79 1.11 1.23 1.32
Range 4-8 5-8 6-9 4-9
Summary
2.3.5
Influence of Mother Tongue
The next tests assess whether the participant’s mother tongue makes a difference in the number of correct answers. Participants were asked before the experiment to specify their mother tongue. See table 2.7 for an overview of the mean number of correct answers and standard deviation per reported English level and experiment condition.
I first I tested the difference in the number of correct answers between the mother tongues in general. Category ‘other’ has only one participant. The differences in the number of correct answers between the mother tongues is
not statistically significant (F(2,57) = 0.77, p = .47).
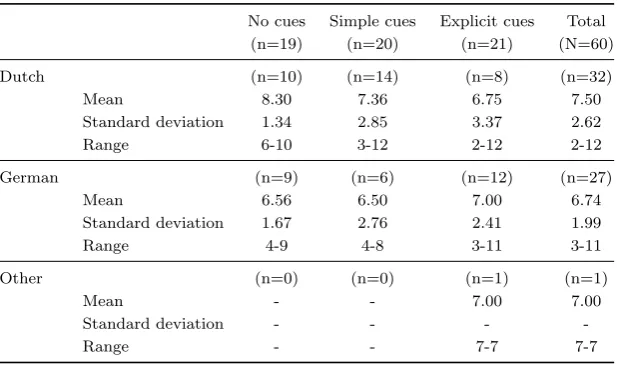
In the second test, I tested the difference of the number of correct answers between the mother tongues in each of the 3 conditions. Dutch participants score better than German participants in the no cues condition. This trend continues less strongly in the simple cues condition and disappears in the explicit condition. German participants score slightly better than Dutch participants in the explicit cues condition. Differences between Dutch and German participants in the no cues condition were statistically significant (t(17) = 2.53, p = .02). No statistically significant differences in the number of correct answers were found between the mother tongues in the simple cues and explicit cues conditions: simple cue (t(18) = 0.68, p = .51) and explicit cue (F(2,18) = 0.02, p = .98). A second test excluding the category ‘other’ in the explicit cues condition was not significant either (t(18) = -0.19, p = .85).
[image:38.595.144.453.475.658.2]In the third test, I tested the differences in the number of correct answers between the experiment conditions for each mother tongue. No test was conducted for category ‘other’ because it only appeared in one condition and thus, no difference could be tested. Tests on the Dutch group and German group showed no statistically significant differences: Dutch (F(2,29) = 0.81, p = .46) and German (F(2,24) = 0.17, p = .84).
Table 2.7: Correct answers per mother tongue
No cues Simple cues Explicit cues Total
(n=19) (n=20) (n=21) (N=60)
Dutch (n=10) (n=14) (n=8) (n=32)
Mean 8.30 7.36 6.75 7.50
Standard deviation 1.34 2.85 3.37 2.62
Range 6-10 3-12 2-12 2-12
German (n=9) (n=6) (n=12) (n=27)
Mean 6.56 6.50 7.00 6.74
Standard deviation 1.67 2.76 2.41 1.99
Range 4-9 4-8 3-11 3-11
Other (n=0) (n=0) (n=1) (n=1)
Mean - - 7.00 7.00
Standard deviation - - -
-Range - - 7-7 7-7
Summary
2.3.6
Relation between Mother Tongue and reported English Level
Both the analyses of the reported English level and mother tongue showed statically significant differences within the no cues condition. Thus, it could be that there is a relation between the mother tongues Dutch and German and the English levels Higher and Lower. It could be that the differences in the number of correct answers observed in section 2.3.5are due to the level of English.
[image:39.595.190.406.304.451.2]The differences between mother tongue and the reported English level were not statistically significant in all three conditions: no cues (p = .63), simple cues (p = 1.00)and explicit cues (p = 1.00). The analyses was done using a FET test. The number of Dutch and German participants in the no cues condition are fairly equal within each level of English. If the level of English was causing the difference in the number of correct answers, I would expect to see more Dutch than German participants in the Higher level and vice versa in the Lower level. However, this is not the case. The Dutch and German participants are fairly equally distributed over the English levels. The difference in the number of correct answers in the no cues conditions between Dutch and German participants is thus not explicitly due to the reported level of English.
Table 2.8: Mother tongue versus reported English level
Higher Lower Total
No cues (n=14) (n=5) (N=19)
Dutch 8 (57%) 2 (40%) 10 (53%)
German 6 (43%) 3 (60%) 9 (47%)
Simple cues (n=13) (n=7) (N=20)
Dutch 9 (69%) 5 (71%) 14 (70%)
German 4 (31%) 2 (29%) 6 (30%)
Explicit cues (n=16) (n=5) (N=21)
Dutch 6 (38%) 2 (40%) 8 (38%)
German 9 (56%) 3 (60%) 12 (57%)
Other 1 (6%) 0 1 (5%)
Summary
Dutch and German participants in the no cues condition are fairly equally distributed over the reported levels of English. Furthermore, tests show no statistically significant differences. Thus, the English level is not perse the cause of the difference in the number of correct answers between Dutch and German participants in the no cues condition.
2.3.7
Influence of Reading and Answering time
In this section I test whether reading and answering time can predict the number of correct answers. While participants were performing the experiment the total viewing time per presentation and answering page was recorded. See tables 2.9and 2.10. A Shapiro-Wilk test gave statistically significant results for both the reading (p <.001) and answering time (p<.001). The distribution of the time values is asymmetric and is positively skewed (the majority of the data is on the left side of the mean). Because the data is skewed I will present both the mean and the median.
explicit cues conditions are similar but the median shows most explicit cues participants were faster. Simple cues participants have about the same answering time as the no cues participants. Differences in the answering time between the conditions were not statistically significant (H(2) = 1.41, p = .49).
Table 2.9: Reading time
No cues Simple cues Explicit cues Total
(n=19) (n=20) (n=21) (N=60)
Mean 00:27:06 00:35:51 00:27:49 00:30:16
Median 00:23:59 00:27:58 00:18:49 00:23:11
Range 00:06:51-01:07:27 00:08:55-01:36:21 00:07:59-01:22:44 00:06:51-01:36:21
Table 2.10: Answering time
No cues Simple cues Explicit cues Total
(n=19) (n=20) (n=21) (N=60)
Mean 00:05:59 00:06:13 00:05:29 00:05:53
Median 00:05:00 00:04:40 00:03:55 00:04:09
Range 00:02:07-00:17:37 00:01:36-00:16:54 00:01:49-00:20:35 00:01:36-00:20:36
In the next tests I assessed if the number of correct answers was related to the reading time and answering time in general. The number of correct answers per condition and in general can be viewed in table 2.4. The number of correct answers is positively correlated with the reading time (Spearman’s rho = 0.27; p = .04), although the relation was not very strong. The number of correct answers is positively correlated to the answering time (Spearman’s rho = 0.34; p = .01), however the relation was again not very strong.
Next, I tested if the number of correct answers was related to the reading time and answering time within each experiment condition. There was no significant correlation in any of the three conditions between the number of correct answers and the reading time: no cues (Spearman’s rho = 0.27; p = .26), simple cues (Spearman’s rho = 0.16; p = .50) and explicit cues (Spearman’s rho = 0.43; p = .05). The results for the explicit cues condition is only weakly significant and it shows a positive but weak correlation. This suggests there might be a weak relation between the number of correct answers and the reading time. The median reading time of the explicit cues participants is about 22% faster than the no cues participants and 33% faster than those in the simple cues condition. A possible explanation is that explicit cues participants reached reading speeds close to scanning and started skipping information. This certainly can have impacted the amount of recalled information. In the other conditions skipping might have been less to a degree that it had no significant impact on the amount of recalled information. The same test with the reading time showed no significant correlation in any of the three conditions: no cues (Spearman’s rho = 0.18; p = .47), simple cues (Spearman’s rho = 0.39; p = .09) and explicit cues (Spearman’s rho = 0.32; p = .15).
Summary
[image:40.595.134.462.255.322.2]that explicit cues allowed participants to read faster. However, there was no significant difference in reading time between the conditions. Thus, my results do not support this hypothesis.
2.3.8
Post-test results
I will now present the post-test results. 5 questions were asked on the following topics:
• Presentation difficulty,
• Presentation language difficulty,
• Ease of the questions,
• Rating of English level,
• Inclination to give up.
For each question I tested for differences in the results between and within the conditions. Following, I tested the relation between the post-test results and the recall test results between and within the conditions. By comparing how the participants answered the post-test questions and the number of correct answers they gave in the recall experiment.
Presentation difficulty
[image:41.595.177.418.495.585.2]Participants were asked to specify how many of the presentations they considered difficult. The available answers were; ‘none’, ‘1 to 3’, ‘4 to 6’, ‘7 to 9’ and ‘10 to 12’ presentations. Table 2.11shows the results of the participants’ ratings on presentation difficulty. I tested the differences in presentation difficulty ratings over all experiment conditions. The result from the Fisher’s Exact test did not reveal a statistically significant difference (p = .74).
Table 2.11: Frequency of presentation difficulty per condition
No cues Simple cues Explicit cues Total
(n=19) (n=20) (n=21) (N=60)
none 0 2 (10%) 0 2 (3%)
1 to 3 1 (5%) 1 (5%) 3 (14%) 5 (8%)
4 to 6 6 (32%) 7 (35%) 8 (38%) 21 (35%)
7 to 9 8 (42%) 6 (30%) 8 (38%) 22 (37%)
10 to 12 4 (21%) 4 (20%) 2 (10%) 10 (17%)
Table 2.12: Correct answers per condition and presentation difficulty
No cues Simple cues Explicit cues Total
(n=19) (n=20) (n=21) (N=60)
none (n=0) (n=2) (n=0) (n=2)
Mean 0 7 0 7
Standard deviation - 5.66 - 5.66
Range - 3-11 - 3-11
1 to 3 (n=1) (n=1) (n=3) (n=5)
Mean 8 12 10 10
Standard deviation - - 2.65 2.36
Range 8-8 12-12 7-12 7-12
4 to 6 (n=6) (n=7) (n=8) (n=21)
Mean 8.17 6.29 6.88 7.05
Standard deviation 2.32 1.50 1.81 1.94
Range 4-10 4-8 4-9 4-10
7 to 9 (n=8) (n=6) (n=8) (n=22)
Mean 7.13 7.50 5.88 6.77
Standard deviation 1.46 2.59 3.14 2.47
Range 5-9 3-11 2-11 2-11
10 to 12 (n=4) (n=4) (n=2) (n=10)
Mean 7 6.75 6.50 6.80
Standard deviation 1.41 2.22 0.71 1.55
Range 6-9 4-9 6-7 4-9
Summary When analysing the presentation difficulty rating no statistically significant differences were found between the experiment conditions. Furthermore, when assessing the relation between the presentation difficulty rating and the number of correct answers no statistically significant differences were found.
Language difficulty
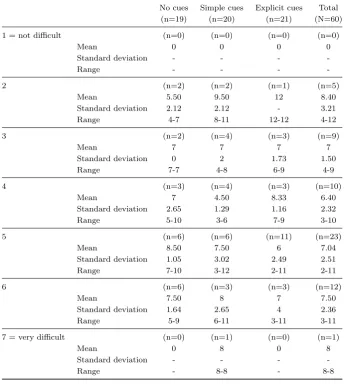
Participants were asked to rate on a 7 point rating scale how difficult they found the language used in the presentations. A rating of 1 was classified as ‘not difficult’ and a rating of 7 as ‘very difficult’. The frequency of ratings for language difficulty are shown in table 2.13.
I tested the differences in language difficulty ratings over all experiment conditions. The result from the Fisher’s Exact test did not reveal a statistically significant difference (p = .81)
Table 2.13: Language difficulty per condition
No cues Simple cues Explicit cues Total
(n=19) (n=20) (n=21) (N=60)
1 = not difficult 0 0 0 0
2 2 (5%) 2 (10%) 1 (5%) 5 (8%)
3 2 (5%) 4 (20%) 3 (14.3%) 9 (15%)
4 3 (32%) 4 (20%) 3 (14.3%) 10 (17%)
5 6 (42%) 6 (30%) 11 (52%) 23 (38%)
6 6 (21%) 3 (15%) 3 (14.3%) 12 (20%)
7 = very difficulty 0 1 (5%) 0 1 (2%)
Mean 4.63 4.35 4.57 4.52
Standard deviation 1.34 1.39 1.08 1.26
[image:42.595.159.440.596.736.2]