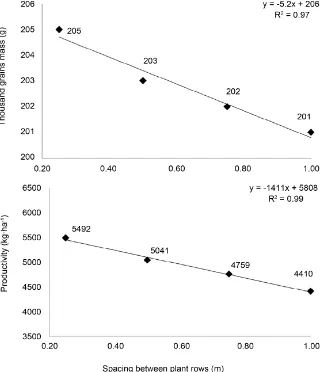
Spacing between Soybean Rows
Full text
Figure


Related documents
First class Master’s Degree in Biochemistry/ Microbiology/ Biotechnology or equivalent degree from a recognized University with 8 years R&D/ Teaching experience in the relevant
“Equity Funds” means the First State Asian Equity Plus Fund, the First State Asian Growth Fund, the First State Asia Innovation Fund, the First State Asia Pacific All Cap Fund,
the essential difference is not between ‘play’ and ‘work’ as culturally defined activities but between the ‘flow’ experience (which typically occurs in play activities but may
Significantly more respondents without formal sustainability programs indicate that sustainability is not a consideration in capital investment decisions, while significantly
Our finding about the role of relational knowledge as an enabler but not as a recipe in global ISD outsourcing projects with multiple vendors extends such research by offering a
The Iranian Civil Code is silent with respect to the effects of hardship and accordingly the possibility of contract modification where sanction makes contract performance
Social networks are an opportunity to foster and strengthen dialogue between companies and their audiences and also to integrate social expectations into their corporate
Background: To explore the possibility of creating three-dimensional (3D) estimation models for patient-specific wall thickness (WT) maps using patient-specific and cohort-averaged


